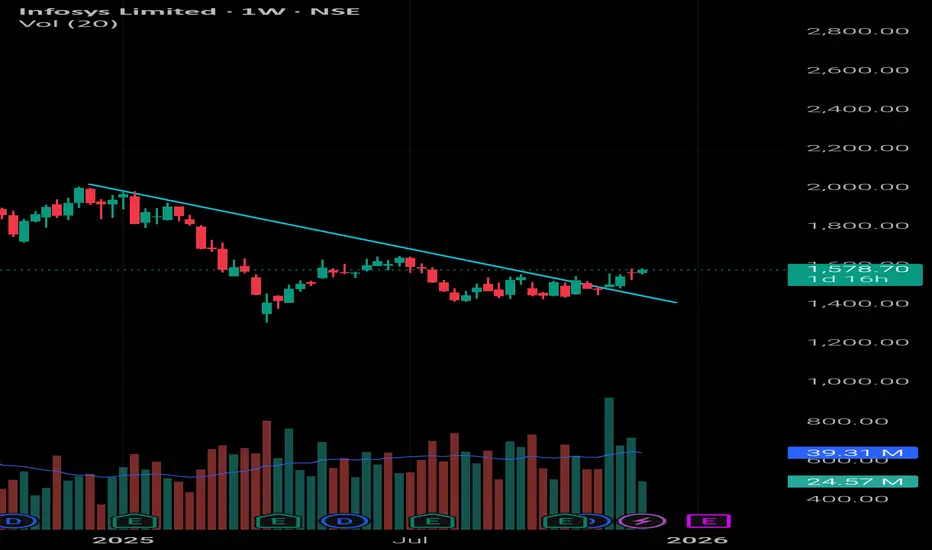
Infy Weekly Chart Breakout Infy Weekly Chart Breakout showing increasing in volume also. Closely watch the strength of breakout in coming weeks. Purely for Paper trade. First learn than earn.
If you want real trade than care should be taken for risk management.
Trade ideas
Smart Liquidity Trading StrategiesWhat Is Liquidity?
Liquidity refers to orders waiting to be executed—stop losses, limit orders, breakout orders, etc. These orders accumulate in predictable areas:
Above swing highs
Below swing lows
Near major support or resistance
Around imbalance zones
At psychological levels (like 50, 100, 1000)
Institutional traders know retail traders place stops in these obvious areas. So the market often moves first to collect these orders, then reverses to the real direction.
This mechanism is often referred to as:
Stop hunting
Liquidity sweep
Stop-loss raid
Smart money trap
Smart liquidity strategies attempt to take advantage of these manipulations.
Core Concepts Behind Smart Liquidity Trading
Below are the key building blocks every trader must understand before applying smart liquidity strategies.
1. Liquidity Pools
Liquidity pools are zones where large groups of traders have placed orders. Markets gravitate toward these pools to fill big institutional orders.
Two main types exist:
a) Buy-side liquidity (BSL)
This sits above swing highs.
Breakout buyers place buy stops.
Sellers place stop losses above highs.
When price moves up to sweep these, big players offload large sell positions.
b) Sell-side liquidity (SSL)
This sits below swing lows.
Breakout sellers place sell stops.
Buyers place their stop losses below lows.
Price often dips to sweep these orders before a sharp reversal upward.
2. Liquidity Grabs / Sweeps
These are fast price moves beyond a key high or low followed by sharp rejection.
This signals that:
Liquidity has been collected.
Big traders have executed their orders.
A reversal is highly probable.
Example:
Price breaks a major high → retail buys breakout → institutions sell into that buy-side liquidity → market reverses.
3. Market Structure Shifts
Once liquidity is taken, the next signal is a Market Structure Shift (MSS) or a Change of Character (CHOCH).
It shows that the previous trend ended and a new one is forming.
After sweeping sell-side liquidity, a bullish MSS means price is ready to move up.
After sweeping buy-side liquidity, a bearish MSS indicates downward movement.
This combination—liquidity sweep + structure shift—is the foundation of smart liquidity strategies.
4. Imbalance and Fair Value Gaps (FVG)
When institutions aggressively enter trades, price moves fast and leaves an imbalance—an area where few or no trades happened.
These gaps often get revisited later.
A typical smart liquidity sequence:
Liquidity sweep
Market structure shift
Price retraces to imbalance (FVG)
Smart entry zone triggers
This provides high-probability and low-risk setups.
Smart Liquidity Trading Strategies
Now let’s break down the most effective strategies used by traders following institutional and smart money concepts.
1. Liquidity Sweep + Market Structure Shift Strategy
This is the most popular and powerful strategy.
Steps:
Identify liquidity pool
Above previous highs (BSL)
Below previous lows (SSL)
Wait for price to sweep the liquidity
A quick wick or candle body breaching the zone.
Wait for Market Structure Shift (MSS)
A break in the current trend.
Enter on retracement
At the origin of displacement
Or at a fair value gap (FVG)
Place stop-loss
Below the sweep (for long)
Above the sweep (for short)
Target next liquidity pool
This strategy works on all timeframes.
2. Breaker Block Strategy (Post-Liquidity Grab)
Breaker blocks form when a previous support or resistance zone fails after liquidity collection.
Logic:
Market grabs liquidity beyond a key level.
Price reverses and breaks that level.
The broken zone becomes a powerful entry block.
How to trade:
Identify failed high/low.
Mark the breaker block.
Wait for a retest.
Enter with stop behind the block.
Breaker blocks are highly effective in trending markets.
3. Equal Highs / Equal Lows Targeting
Equal highs or lows attract liquidity because traders place stops or entries in these zones.
Smart traders:
Anticipate sweeps of equal highs/lows.
Enter after sweep.
Target the next liquidity level.
Double-top and double-bottom formations often become liquidity traps.
4. Inducement Strategy
Inducement refers to false setups designed to lure retail traders.
Example:
A mini double-top forms below a larger liquidity pool. Retail shorts early, providing liquidity for institutions to run the real move.
Steps:
Identify small equal highs/lows.
Understand they often induce premature entries.
Expect price to sweep inducement liquidity first.
Enter after true liquidity sweep at the major level.
This prevents entering too early.
5. Liquidity Mapping Multi-Timeframe Strategy
Smart traders never trade on one timeframe. Liquidity must be aligned.
Steps:
HTF (Daily/4H)
Identify major liquidity pools (key highs/lows).
MTF (1H/15M)
Identify intermediate liquidity and imbalance.
LTF (1M/5M)
Look for sweep + MSS to refine entries.
This produces sniper entries with minimal stop-loss.
6. Liquidity Void / Imbalance Filling Strategy
Markets often:
Create a liquidity void (fast, one-sided movement).
Later return to fill that void.
Continue moving in original direction.
Traders enter when price enters the imbalance and shows structure shift.
Why Smart Liquidity Strategies Work
Traditional indicators often lag and don’t explain why price behaves a certain way.
Smart liquidity strategies work because they are based on market logic:
Institutions cannot enter without liquidity.
Retail traders place predictable stop-losses.
Market makers move price to where orders sit.
Liquidity hunts are deliberate, not random.
Price must rebalance inefficiencies.
This makes smart liquidity trading a powerful approach for anticipating market manipulation and aligning with institutional flow.
Advantages of Smart Liquidity Strategies
✔ High accuracy
✔ Trades align with institutional flow
✔ Low stop-loss and high risk-to-reward
✔ Clear rule-based structure
✔ Works across forex, stocks, crypto, indices, commodities
✔ Helps avoid retail traps and fake breakouts
Final Thoughts
Smart liquidity trading strategies are not magic—they are based on understanding how institutional players operate. By learning to identify liquidity pools, sweeps, market structure shifts, imbalance zones, and inducement setups, traders gain a powerful edge over the market.
The key is patience:
You wait for liquidity to be swept, then enter on confirmation—not before.
Master this discipline, and your trading becomes more precise, logical, and consistently profitable.
Premium PatternsFinal Tips to Master Premium Chart Patterns
Patterns don't work alone—context is everything.
Look for liquidity sweeps before pattern confirmation.
Avoid trading patterns in the middle of trends.
Volume is the key filter to avoid false breakouts.
Journal each pattern you trade and review monthly.
Use pattern + order block confluence for top accuracy.
Never chase the breakout—wait for retest.

Technical Indicators Used in Momentum Trading1. Relative Strength Index (RSI)
The Relative Strength Index (RSI) is one of the most popular momentum indicators used by traders. Developed by J. Welles Wilder, the RSI measures the speed and magnitude of price movements over a specified period, typically 14 days. The indicator oscillates between 0 and 100 and helps identify overbought and oversold conditions in the market.
Overbought Condition: RSI above 70 suggests that the asset might be overbought, indicating potential for a price correction or trend reversal.
Oversold Condition: RSI below 30 suggests the asset may be oversold, providing potential buying opportunities.
RSI is particularly effective in momentum trading because it reflects the strength of price trends and highlights potential entry and exit points. Traders often combine RSI with other indicators to confirm momentum.
2. Moving Average Convergence Divergence (MACD)
The MACD is another essential tool in momentum trading. It measures the relationship between two moving averages, typically the 12-day and 26-day exponential moving averages (EMA), and produces a MACD line. A 9-day EMA of the MACD, known as the signal line, helps identify buy or sell signals.
Bullish Signal: When the MACD line crosses above the signal line, it suggests upward momentum.
Bearish Signal: When the MACD line crosses below the signal line, it indicates downward momentum.
MACD is valuable for momentum traders because it captures trend strength and potential reversals, allowing traders to time entries and exits more effectively.
3. Stochastic Oscillator
The Stochastic Oscillator is a momentum indicator that compares the closing price of an asset to its price range over a specific period, usually 14 periods. It consists of two lines: %K (fast line) and %D (slow line).
Overbought Condition: Readings above 80 suggest that the asset may be overbought.
Oversold Condition: Readings below 20 indicate that the asset may be oversold.
The Stochastic Oscillator is particularly effective in identifying short-term momentum shifts and spotting potential reversals in both trending and range-bound markets. Traders often use stochastic divergences, where price moves contrary to the oscillator, to detect weakening trends.
4. Average Directional Index (ADX)
The Average Directional Index (ADX) measures the strength of a trend rather than its direction. It is derived from the +DI and −DI lines, which indicate upward and downward directional movement. ADX values range from 0 to 100:
Strong Trend: ADX above 25 indicates a strong trend.
Weak or No Trend: ADX below 20 suggests a weak or sideways market.
Momentum traders rely on ADX to identify when a trend is gaining strength, which is essential for confirming momentum-driven trades. Unlike oscillators, ADX does not provide overbought or oversold signals but instead signals trend strength.
5. Bollinger Bands
While Bollinger Bands are primarily used to measure volatility, they also help identify momentum changes. Bollinger Bands consist of a moving average (usually 20-period SMA) and two standard deviation lines above and below it.
Price Breakout: When the price moves outside the bands, it indicates strong momentum.
Squeeze: Narrow bands indicate low volatility and potential for a momentum breakout.
Momentum traders use Bollinger Bands to spot explosive moves and gauge the strength of trends. When prices ride the upper or lower band, it often signifies strong trend momentum.
6. Commodity Channel Index (CCI)
The Commodity Channel Index (CCI) measures the deviation of the asset's price from its moving average. Typically, a 20-period CCI is used, oscillating between +100 and −100.
Overbought: CCI above +100.
Oversold: CCI below −100.
CCI is particularly useful in momentum trading for identifying cyclical trends and potential reversals. It is often combined with trend-following indicators to improve accuracy.
7. On-Balance Volume (OBV)
The On-Balance Volume (OBV) is a volume-based momentum indicator. It accumulates volume based on whether the price closes higher or lower than the previous period.
Rising OBV: Confirms upward price momentum.
Falling OBV: Confirms downward price momentum.
OBV is valuable for traders to confirm price trends with volume support. Momentum traders often rely on OBV divergences to spot potential reversals before they occur.
8. Ichimoku Cloud
The Ichimoku Cloud is a comprehensive indicator that combines trend, momentum, and support/resistance in a single view. Key components include the Tenkan-sen, Kijun-sen, Senkou Span A, and Senkou Span B.
Bullish Momentum: Price above the cloud.
Bearish Momentum: Price below the cloud.
Ichimoku Cloud helps momentum traders identify trend direction and potential entry/exit points while also providing a sense of trend strength.
9. Practical Tips for Using Momentum Indicators
Combine Indicators: No single indicator provides perfect signals. Traders often combine RSI, MACD, and ADX for better confirmation.
Confirm Trend Direction: Use trend-following indicators alongside oscillators to avoid false signals in sideways markets.
Time Frame Selection: Short-term traders may prefer 5–15 minute charts, while swing traders use daily or weekly charts.
Watch for Divergence: Momentum divergence, where price moves contrary to an indicator, often signals weakening momentum.
Risk Management: Momentum trading can be fast-moving; always use stop-loss orders and position sizing.
10. Conclusion
Momentum trading relies heavily on technical indicators to make informed decisions. Indicators such as RSI, MACD, Stochastic Oscillator, ADX, ROC, Bollinger Bands, CCI, OBV, and Ichimoku Cloud provide traders with quantitative insights into trend strength, potential reversals, and overbought or oversold conditions. By understanding the strengths and limitations of each indicator, momentum traders can optimize their strategies, identify high-probability trade setups, and manage risk effectively.
While technical indicators are powerful tools, successful momentum trading also requires discipline, market awareness, and a solid risk management plan. Using indicators in conjunction with proper trading psychology and market knowledge increases the likelihood of consistent profitability in dynamic markets.
Introduction to Put-Call Ratio (PCR)Psychology in Option Trading
Option trading is not just technical—it's emotional.
Traders face:
Fear of missing out (FOMO)
Overtrading during high volatility
Holding losers too long
Expecting miracles from OTM options
Disciplined psychological control is essential.

Part 3 Learn Institutional Trading 1. Option Buying Risks
High time decay
Entire premium can be lost
Low probability of profit if market does not move fast
2. Option Selling Risks
Unlimited loss potential
Requires high margin
Needs strong risk management skills
3. Volatility Risk
Changes in implied volatility affect premium prices.
4. Liquidity Risk
Low liquidity leads to poor fill prices.
5. Emotional Risk
Options move fast, causing psychological stress for beginners.
Thus, risk management, position sizing, and discipline are essential.

Earnings Season Trading1. What Makes Earnings Season Important?
Earnings reports reveal the true financial health of a company. This data often contradicts or validates market expectations built over the previous quarter. When results surprise on the upside or downside, stocks can react with sudden gaps, breakouts, or reversals. Because these results directly influence valuation metrics like P/E ratio, growth trajectory, and forward guidance, institutions and retail traders adjust their positions, creating volatility.
Additionally, the commentary provided during earnings calls—about demand trends, inflationary pressures, capex plans, and future growth—shapes market sentiment for weeks or months. Sectors such as banking, IT, pharmaceuticals, autos, and FMCG often show correlated moves during earnings, offering broader index-level opportunities.
2. Key Components of an Earnings Report
To trade earnings effectively, you must understand the elements of the quarterly report:
a. Revenue (Top Line)
Measures the total sales generated. Higher-than-expected revenue indicates strong demand.
b. Net Profit / EPS (Bottom Line)
Earnings per share (EPS) is the most watched metric. A beat or miss relative to analysts’ expectations heavily influences stock reactions.
c. Operating Margins
Margin expansion or contraction shows pricing power, cost control, and business efficiency. For some sectors—like FMCG or metals—margins matter more than revenue.
d. Guidance
Future expectations provided by management. Often, guidance has more impact than the current quarter’s results because markets are forward-looking.
e. Commentary
Insights on economic conditions, demand trends, and risks can swing sentiment quickly.
Understanding these elements helps traders anticipate market reaction better.
3. Why Stocks Move So Much During Earnings?
Stocks move based on:
a. Expectation vs Reality
Markets don’t move on results alone—they move on surprises.
Positive surprise → strong rally
Negative surprise → sharp fall
In-line results → muted reaction or volatility fade
b. Market Sentiment
Even a positive result can lead to selling if the stock had already run up before earnings. This is called “buy the rumour, sell the news.”
c. Options Positioning
Options traders often take hedged positions before earnings. When implied volatility (IV) collapses after results, this can create large directional moves, especially in stocks like Apple, Google, Infosys, Reliance, or HDFC Bank.
d. Institutional Flows
Big players re-balance their portfolios based on earnings quality, driving big price swings.
4. Trading Strategies During Earnings Season
Earnings season offers multiple profitable strategies, but each comes with specific risks. Here are the most effective ones:
**1. Pre-Earnings Momentum Trading
Some stocks show clear directional movement as earnings approach.
If sentiment is bullish and analysts expect a beat, stock may rise before results.
Conversely, if the company already warned of weak numbers, traders short it before earnings.
But this strategy is risky—the stock can gap against you post-results.
**2. Trading Earnings Gaps
Once results are released, stocks often open with big gap ups or gap downs. Traders look for:
Gap continuation (if stock breaks above or below resistance convincingly)
Gap fading (if the reaction seems exaggerated)
For example:
A stock gaps up 10% on fantastic results but immediately fails to hold levels → short opportunity.
**3. Post-Earnings Trend Trading
The safest earnings strategy. Instead of gambling on the announcement, traders wait for the results to come out and trade the trend that follows.
If results are strong and stock sustains above key levels, you enter long and ride the trend for days or weeks.
Advantages:
No overnight risk
You trade based on confirmed data
Institutional flow supports the move
**4. Options Trading – Implied Volatility Play
Earnings season sees a spike in IV. After results, IV collapses sharply (IV crush).
Strategies to use:
Straddles / Strangles before earnings (for expected big move)
Iron condors (if expecting limited movement)
Post-earnings debit spreads (lower IV = cheaper premium)
Options trading around earnings is powerful but requires skill and risk-management.
5. Risk Management During Earnings Trading
Earnings season is profitable but risky. Here are essential risk-control rules:
a. Avoid Overleveraging
Extreme volatility can wipe out leveraged positions instantly.
b. Use Stop-Loss Orders
Volatility spikes can trap traders in losing trades. SLs protect capital.
c. Position Sizing
Limit exposure to a single stock to 2–5% of portfolio during earnings week.
d. Never Hold a Large Position Overnight
Unexpected results can cause massive gaps.
e. Analyze Sector Trends
If the entire sector is weak, even good results may not lead to big rallies.
6. Fundamental and Technical Tools for Earnings Trading
Fundamental Tools
Analyst estimates (Bloomberg, Reuters)
YoY and QoQ performance trends
Management guidance
Peer performance
Macro environment (inflation, interest rates, global cues)
Technical Tools
Support and resistance levels
Volume analysis
Gap trading indicators
RSI, MACD, ADX for momentum
Candlestick signals around results
Combining both technical and fundamental analysis gives a competitive edge.
7. How Institutions Trade Earnings
Institutional investors like FIIs, DIIs, and mutual funds:
Focus more on long-term guidance than short-term results
Increase positions in companies showing stable margin improvement
Reduce positions if management commentary signals future weakness
Hedge through index options rather than individual stocks
Understanding institutional behavior helps predict sustained trends.
8. Common Mistakes Traders Should Avoid
• Gambling on earnings direction
Predicting results is risky; avoid blindly holding through results.
• Ignoring guidance
Even excellent results can cause a fall if forward guidance is weak.
• Trading too many stocks at once
Focus on high-liquidity names only.
• Not checking macro events
Inflation data, Fed meetings, RBI policy can overpower earnings impact.
Conclusion
Earnings season is a golden period for traders, packed with volatility, opportunity, and market-shaping trends. To trade successfully, it’s essential to understand the relationship between expectations and outcomes, interpret earnings reports correctly, and apply robust risk-management techniques. The best approach is a balanced one—avoiding excessive risk while taking advantage of clear post-earnings trends. When executed well, earnings season trading can significantly boost your returns and provide valuable insights into market behavior.

INFOSYS MY TECHNICAL VIEWS 19-11-25After retest of support, multiple times, price ready to go up.
Nifty It and Infosys charts are almost identical..
Nifty is already in trend. VIX Normal. dollar index below 100. Good delivery. Everything look perfect. Anything missing?
Your views and suggestion are invited.

Trade Best With These Premium Charts PatternsChart patterns form the visual language of financial markets. They compress the psychology of buyers and sellers into a structure that traders can read, interpret, and act upon. Among the numerous patterns that appear on charts, a special set falls into the category of premium chart patterns—high-probability, high-confidence structures that institutions respect and smart traders rely on.
These patterns work across:
Equities (NSE, BSE)
Index futures (Nifty, Bank Nifty, GIFT Nifty)
Commodities and Forex
Crypto markets
They are especially powerful when combined with:
Volume Profile
Order Flow
Market Structure (BOS, CHoCH, Liquidity)
Fibonacci
Supply & Demand zones

Higher low formationInfosys took support of the Fib level 0.618 at 1490 and is moving upwards. 1560 becomes an immediate resistance

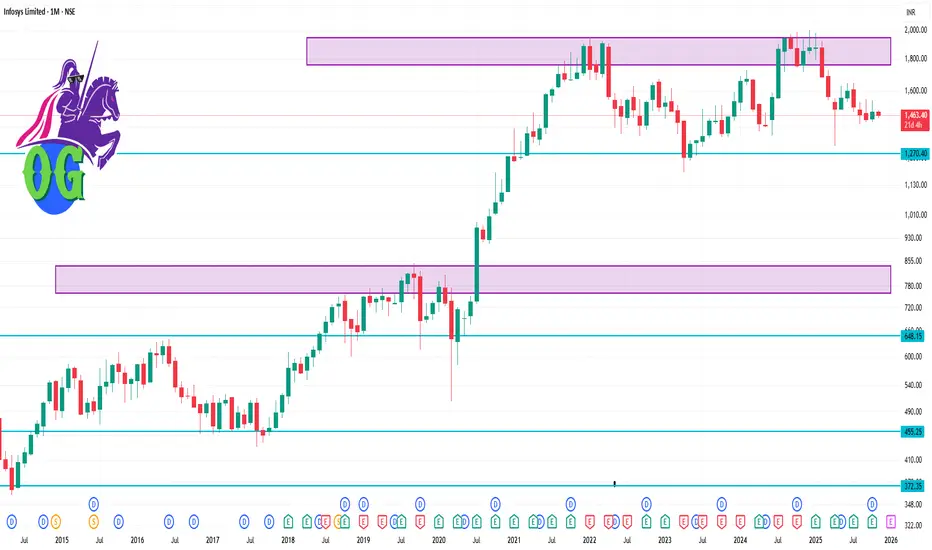
INFY 1 Week Time Frame 🎯 Key Levels
Based on recent chart and analysis sources:
Support zone around ₹ 1,440 – ₹ 1,420.
Resistance zone near ₹ 1,530 – ₹ 1,550.
52-week high ~ ₹ 2,006 and low ~ ₹ 1,307.

INFY 1 Month Time Frame 📊 Current status
Latest quoted price is around ₹1,466.70.
Technical indicators (daily & monthly) show a bearish bias. On daily, moving averages all give “Sell”.
From chart commentary: Intermediate resistance visible at ~ ₹1,479–₹1,523. Support stated around ~ ₹1,425–₹1,385, and a stronger support zone near ~ ₹1,348 in a deeper break scenario.
🎯 Key levels for the 1-month horizon
Resistance zone: ~ ₹1,479 up to ~ ₹1,523 — clearing this zone would be a positive signal. (see analysis above)
Support zone / trigger zone:
Initial support: ~ ₹1,425–₹1,385.
Deeper support (if breakdown): ~ ₹1,348.
Important pivot region: The current price around ~ ₹1,466–₹1,470 sits between support and resistance — watching whether it breaks down or starts a reversal.
Understanding How Options Work: Calls and Puts Simplified1. What Are Options?
An option is a type of financial contract that gives the buyer the right, but not the obligation, to buy or sell an underlying asset (like a stock, index, or commodity) at a predetermined price (called the strike price) before or on a specific date (called the expiration date).
Think of options as insurance contracts — they allow you to protect, speculate, or leverage your positions in the market.
The buyer of the option pays a premium (price of the option).
The seller (also called the writer) receives this premium and is obligated to fulfill the contract if the buyer decides to exercise it.
There are two types of options:
Call Option – the right to buy an asset.
Put Option – the right to sell an asset.
2. Call Options Explained (The Right to Buy)
A call option gives the buyer the right to buy an underlying asset at the strike price within a certain period.
Let’s take an example:
Suppose Stock A is trading at ₹100. You buy a call option with a strike price of ₹105 for a premium of ₹3, expiring in one month.
This means:
You pay ₹3 per share for the right to buy Stock A at ₹105 any time before expiry.
If the stock price rises above ₹105, your option gains value because you can buy at ₹105 while the market price is higher.
Scenario 1: Stock goes up to ₹115 before expiry.
You can buy at ₹105 and immediately sell at ₹115 — making a profit of ₹10.
Your net profit = ₹10 (gain) - ₹3 (premium) = ₹7 per share.
Scenario 2: Stock stays below ₹105.
Your option is out of the money (no advantage in exercising it).
You lose only the premium paid (₹3).
So, a call option benefits from rising prices.
3. Put Options Explained (The Right to Sell)
A put option gives the buyer the right to sell an underlying asset at the strike price within a certain period.
Example:
Stock B is trading at ₹100. You buy a put option with a strike price of ₹95 for a premium of ₹2.
This means you have the right to sell Stock B at ₹95 even if the price falls.
Scenario 1: Stock falls to ₹85 before expiry.
You can sell at ₹95 while the market price is ₹85 — gaining ₹10.
Your net profit = ₹10 (gain) - ₹2 (premium) = ₹8 per share.
Scenario 2: Stock stays above ₹95.
You wouldn’t exercise your right to sell at ₹95 when the market offers ₹100.
You lose only the premium (₹2).
So, a put option benefits from falling prices.
4. Understanding Option Premiums
The premium is the price of the option, and it consists of two parts:
Intrinsic Value:
The amount by which an option is in the money.
For a call: Intrinsic Value = Current Price - Strike Price
For a put: Intrinsic Value = Strike Price - Current Price
Time Value:
Extra value because there’s still time left before expiration.
The longer the time to expiry, the higher the premium.
Example: If a call option on Stock A (price ₹110) has a strike of ₹100, it’s already ₹10 in the money. If the premium is ₹12, then ₹10 is intrinsic value and ₹2 is time value.
5. How Option Sellers Make Money
While buyers pay the premium and hope the market moves in their favor, option sellers profit if the market doesn’t move much.
Call Seller (Writer): Hopes the price stays below the strike price.
Put Seller (Writer): Hopes the price stays above the strike price.
If the option expires worthless, the seller keeps the entire premium. However, sellers face unlimited potential losses if the market moves sharply against them — which is why writing options requires higher margin and risk management.
6. Why Traders Use Options
Options are powerful because they offer multiple strategic uses:
a. Hedging (Protection)
Investors use options to protect existing positions.
Example: If you own a stock at ₹100 and fear a short-term decline, you can buy a put option at ₹95. If the stock falls, your put gains, offsetting the loss.
b. Speculation
Traders buy calls if they expect prices to rise or puts if they expect prices to fall. Because options cost less than the actual stock, they allow for higher leverage — magnifying potential returns.
c. Income Generation
Experienced traders sell (write) options to earn premiums, especially in sideways markets. Covered call writing and cash-secured puts are popular income strategies.
7. Option Moneyness: In, At, and Out of the Money
Understanding an option’s moneyness helps evaluate its worth.
In the Money (ITM): Already profitable if exercised.
Call: Market Price > Strike Price
Put: Market Price < Strike Price
At the Money (ATM): Market Price = Strike Price
Out of the Money (OTM): Not profitable if exercised.
Call: Market Price < Strike Price
Put: Market Price > Strike Price
For example, if a stock trades at ₹100:
₹90 call = ITM
₹100 call = ATM
₹110 call = OTM
8. Expiration and Time Decay (Theta Effect)
Every option has an expiration date — after which it becomes worthless.
As time passes, the time value portion of the premium decreases — this is known as time decay or theta.
Time decay accelerates as the option nears expiry. That’s why buyers usually prefer longer durations (more time value), while sellers prefer shorter ones (faster decay).
9. Risk and Reward Profile
Here’s how the payoff works for each type:
Call Buyer: Unlimited profit (as price rises), limited loss (premium).
Call Seller: Limited profit (premium), unlimited loss (if price soars).
Put Buyer: High profit (as price falls), limited loss (premium).
Put Seller: Limited profit (premium), high loss (if price crashes).
This asymmetry is what makes options both powerful and risky.
10. Real-World Example: A Simplified Scenario
Let’s take a complete example:
You believe Reliance Industries (trading at ₹2500) will rise. You buy a call option with a strike of ₹2550, paying ₹40 premium.
If Reliance rises to ₹2650 → Gain = ₹100 - ₹40 = ₹60 profit.
If Reliance stays below ₹2550 → Option expires worthless → Loss = ₹40.
Alternatively, if you think it will fall, you buy a put option with a strike of ₹2450 for ₹35.
If Reliance drops to ₹2350 → Gain = ₹100 - ₹35 = ₹65 profit.
If it stays above ₹2450 → Option expires worthless → Loss = ₹35.
11. Why Understanding Calls and Puts Matters
Options aren’t just tools for speculation — they’re also essential for managing market exposure and improving portfolio efficiency. Once you understand the behavior of calls and puts, you can combine them into advanced strategies like spreads, straddles, or iron condors — each designed for specific market outlooks.
12. Conclusion: Simplifying the Power of Options
At their core, call and put options are about flexibility. They allow you to control an asset without necessarily owning it, limit your downside while amplifying your upside, and customize your market exposure.
Call = Right to Buy (Bullish tool)
Put = Right to Sell (Bearish tool)
By mastering these basics, you lay the foundation for smarter trading decisions — whether your goal is profit, protection, or passive income. In the world of finance, knowledge of options doesn’t just open doors; it gives you the power to design your own opportunities.
Part 2 Ride The Big Moves a. Single-Leg Strategies
Buy Call: Used when expecting a sharp rise.
Buy Put: Used when expecting a sharp fall.
Sell Call or Put: Used when expecting low volatility or price stability.
b. Multi-Leg Strategies
Covered Call: Holding a stock and selling a call against it to earn premium income.
Protective Put: Buying a put to hedge against downside risk in a stock position.
Straddle: Buying both a call and a put at the same strike to profit from volatility.
Strangle: Similar to a straddle but with different strike prices.
Bull Call Spread: Buying a lower strike call and selling a higher strike call to reduce cost.
Bear Put Spread: Buying a higher strike put and selling a lower strike put to reduce premium outlay.
These strategies help manage risk-reward ratios, making options suitable for both speculative and hedging purposes.

Divergence SecretsOption Premium and Its Components
The premium (price of an option) is determined by several factors. It consists of:
Intrinsic Value (IV): The real value if the option were exercised immediately.
For a call: IV = Spot Price – Strike Price (if positive).
For a put: IV = Strike Price – Spot Price (if positive).
Time Value (TV): The extra premium paid for the time left until expiry, reflecting the potential for price movement.
So,
Option Premium = Intrinsic Value + Time Value.
As the option nears expiry, the time value decays—a phenomenon known as time decay or Theta decay.

Part 10 Trade Like Institutions Option Trading Strategies
Options offer immense flexibility. Traders can combine calls and puts in various ways to create strategies suitable for bullish, bearish, or neutral markets. Some popular ones include:
Covered Call: Holding a stock while selling a call option to earn premium income.
Protective Put: Buying a put option to hedge a long stock position.
Bull Call Spread: Buying one call option and selling another at a higher strike to limit cost.
Bear Put Spread: Buying one put and selling another at a lower strike to profit from a downtrend.
Iron Condor: A non-directional strategy involving both calls and puts to profit from low volatility.
Straddle: Buying both a call and a put with the same strike to profit from big moves in either direction.
These strategies balance risk and reward depending on the trader’s view and volatility expectations.

Option TradingTypes of Options: Calls and Puts
Options are divided into two main categories:
Call Options: The buyer of a call expects the underlying asset’s price to rise. For example, if a trader buys a call option on Reliance stock with a strike price of ₹2500, and the stock rises to ₹2600 before expiry, the trader can exercise the option and profit from the difference.
Put Options: The buyer of a put expects the asset’s price to fall. If the same Reliance stock falls to ₹2400, the put option buyer profits by selling at ₹2500 (the strike price).
Call and put options can be used separately or in combination to create complex strategies based on different market conditions.

Technical Market Explode: Understanding Sudden Market Breakouts1. What Is a Technical Market Explosion?
A technical market explosion refers to a sharp, sudden, and high-volume move in an asset’s price that breaks through established technical levels such as resistance, support, or trendlines. It often happens when price consolidates for a long time and then breaks out, leading to a surge in volatility and directional momentum.
In simpler terms, the market “explodes” because:
Buyers or sellers rush in together after a key breakout.
Stop-losses and pending orders trigger en masse.
Volume multiplies, creating a snowball effect.
Momentum traders, algorithms, and institutions join the move.
These explosions can occur in either direction — bullish or bearish — but they share similar technical signatures.
2. The Psychology Behind Explosive Moves
Every explosive technical move is rooted in trader psychology. Markets are driven by human emotion — primarily fear and greed. When prices are trapped in a range, uncertainty dominates. But once a decisive move breaks that range, traders who were waiting on the sidelines jump in, while those on the wrong side rush to exit.
For example:
When a stock breaks above long-term resistance, greed fuels buying as traders fear missing out.
When it breaks below support, fear dominates as investors panic-sell to cut losses.
This feedback loop of emotion and momentum creates the conditions for an explosive market.
3. Technical Patterns That Lead to Explosions
There are several chart patterns and price structures that often precede a market explosion. Recognizing them early is key to anticipating the move.
A. Consolidation Breakout
When prices trade in a narrow range for weeks or months — forming a rectangle or sideways pattern — energy builds up. Once a breakout happens with volume, the stored pressure is released explosively.
B. Triangle Patterns
Symmetrical, ascending, or descending triangles represent contracting volatility. As the apex nears, traders prepare for a breakout. The tighter the triangle, the stronger the eventual explosion.
C. Cup and Handle
This bullish continuation pattern shows accumulation followed by a small pullback (handle). When price breaks the handle with volume, an explosive upward trend often begins.
D. Flag and Pennant
After a strong move, a flag or pennant forms as a short pause. The breakout from these continuation patterns triggers another sharp move — often matching the length of the prior trend.
E. Double Bottom / Top Breakouts
When prices fail to make new lows or highs twice and then reverse, the breakout past the neckline triggers a major directional explosion.
These patterns are visual representations of market tension. Once the tension releases, price often moves swiftly in the breakout direction.
4. Indicators Signaling an Impending Explosion
Technical traders use indicators to identify potential explosive setups before they happen. Some of the most reliable tools include:
A. Volume Expansion
Volume is the lifeblood of any breakout. A sudden spike in volume after a period of contraction signals that a big move is underway. Traders often look for volume confirmation — the move must be supported by higher-than-average trading activity.
B. Bollinger Bands Squeeze
When Bollinger Bands narrow, volatility is low. A breakout of the bands usually precedes an explosive move as volatility expands. This is one of the most accurate signals for volatility-based trading.
C. Moving Average Crossovers
A short-term moving average crossing above a longer one (like the 20-day above 50-day) often precedes an upside explosion. Conversely, a bearish crossover may signal a downside blast.
D. RSI Divergence
When price consolidates but RSI shows divergence, it can indicate hidden accumulation or distribution before a breakout.
E. MACD Histogram Expansion
A rising MACD histogram after a long flat period shows increasing momentum — a key precursor to a technical breakout.
F. Average True Range (ATR) Expansion
ATR measures volatility. A sudden increase in ATR suggests that the market is gearing up for larger price movements.
5. The Role of Volume and Liquidity
In any explosive move, volume and liquidity play crucial roles. When liquidity is thin, even modest orders can move prices significantly. Conversely, when a breakout happens with institutional-level volume, it confirms strong participation.
An explosive market generally shows:
High relative volume (2–3x the average daily volume)
Sharp price gaps
Low liquidity at key levels
Aggressive order book imbalances
For traders, watching volume-weighted average price (VWAP) can help confirm whether the breakout is genuine or merely a false spike.
6. Institutional and Algorithmic Triggers
Modern markets are heavily influenced by algorithms and institutional trading systems. These entities monitor technical levels across thousands of assets and execute large orders once certain thresholds are crossed.
When price breaks a critical resistance:
Algorithms trigger buy programs.
Stop orders from short-sellers are hit.
Momentum funds pile in.
The combined force creates an amplified price surge, making the market appear to “explode” in one direction. Similarly, when the market breaks down, sell programs trigger a cascading effect.
This is why explosive moves are often synchronized across sectors or even global markets — algorithms act simultaneously across correlated instruments.
7. Phases of a Technical Explosion
A technical market explosion generally unfolds in three phases:
Phase 1: Buildup (Compression)
Price trades within a narrow range.
Volatility contracts.
Volume dries up.
Traders get bored or uncertain.
This is the “quiet before the storm” stage.
Phase 2: Breakout (Ignition)
A sudden surge in volume breaks key levels.
Price moves decisively in one direction.
Stop-losses and pending orders trigger.
Momentum builds rapidly.
This is the explosion phase — the most profitable for short-term traders.
Phase 3: Continuation or Reversal (Aftershock)
The market either continues strongly (trend formation) or retraces due to profit-taking.
Technical traders watch for retests of the breakout zone.
New participants join if the trend sustains.
Understanding these phases helps traders enter during ignition and exit before exhaustion.
8. Real-World Examples of Explosive Technical Moves
A. Indian Stock Market Breakouts
Adani Enterprises (2020–2022): A long consolidation near ₹200–₹300 followed by a massive breakout, driven by volume and institutional inflow, resulted in a 10x explosion.
Reliance Industries (2020): The stock exploded after breaking out of a multi-year consolidation, aligning with heavy foreign investment and digital business announcements.
B. Global Examples
Bitcoin (2020): Broke the $12,000 resistance after months of tight range, leading to an explosive rally past $60,000.
NASDAQ 100 (2023): Tech-driven rally exploded after breaking a major downtrend line as AI adoption surged.
Each of these examples followed a technical setup, consolidation, breakout, and momentum phase, confirming that explosions are technically driven rather than random.
9. How to Trade an Explosive Market
A. Identify the Setup Early
Look for signs of volatility compression — narrow Bollinger Bands, flat ATR, and tight price ranges. These are your early alerts.
B. Confirm With Volume and Price
Never enter on a weak breakout. Ensure that the breakout is supported by above-average volume and a strong close beyond resistance/support.
C. Use Multi-Timeframe Analysis
A breakout on the daily chart confirmed by a weekly trendline often leads to a more sustainable explosion. Multi-timeframe alignment reduces false signals.
D. Manage Risk Aggressively
Explosive markets are volatile. Use:
Tight stop-losses below key breakout zones.
Trailing stops to lock in profits.
Partial profit-taking during strong moves.
E. Watch for Retests
Often, after an explosion, the price pulls back to test the breakout zone. This retest offers a safer entry with reduced risk.
F. Don’t Chase Late Moves
Once the explosion has run too far, risk-reward deteriorates. It’s better to wait for the next consolidation.
10. Risks and False Breakouts
Not every breakout turns into an explosion. False breakouts — when price briefly breaks out and then reverses — can trap traders. These occur due to:
Lack of follow-through volume.
Market maker manipulation.
News-based volatility spikes.
To avoid false moves:
Confirm volume and closing price beyond breakout levels.
Wait for candle confirmation (at least one strong close above/below level).
Avoid trading during uncertain macroeconomic announcements.
11. The Role of News and Fundamentals
While “technical explosion” is largely chart-driven, fundamentals often align with technicals to strengthen the move. For instance:
Positive earnings or government policy can ignite a technical breakout.
Geopolitical shocks or rate hikes can trigger bearish explosions.
Thus, the best explosive trades occur when technical structure and fundamentals converge.
12. Long-Term Implications
Explosive market moves often mark the beginning of new trends or reversal of old ones. For example:
A breakout from multi-year resistance can signal a new bull cycle.
A breakdown below long-term support can mark the onset of a bear market.
These explosions can redefine sector leadership, influence macroeconomic flows, and create multi-year opportunities for investors.
13. Key Takeaways
A technical market explosion is a powerful breakout driven by volume, momentum, and emotion.
It originates from compression, followed by ignition, and often leads to trend formation.
Recognizing patterns, volume confirmation, and volatility contraction helps traders anticipate the move.
Risk management and discipline are critical — not every explosion sustains.
Combining technical signals with market context ensures the best results.
Conclusion
A technical market explosion is one of the most thrilling and profitable phenomena in trading. It represents the moment when chart patterns, trader sentiment, and institutional forces converge to drive massive price movement. While such explosions can yield extraordinary returns, they also demand discipline, preparation, and technical mastery. By studying historical breakouts, monitoring volatility compression, and aligning with momentum, traders can anticipate and participate in these market surges with confidence. In essence, the ability to identify and trade a technical market explosion transforms a trader from a follower of price to a predictor of power — turning volatility into opportunity.
Thematic Trading vs. Sectoral Rotation: A Comprehensive Analysis1. Introduction to Market Strategies
Investors constantly seek strategies to outperform the market, hedge risks, and align investments with broader economic and societal trends. Two such strategies—thematic trading and sectoral rotation—have gained prominence in recent years due to their potential to deliver above-average returns while allowing investors to align their portfolios with macroeconomic or microeconomic shifts.
Thematic trading involves identifying long-term structural trends or themes that could drive growth across multiple sectors and regions. This strategy is typically future-oriented and is influenced by technological innovation, demographic shifts, environmental changes, and other global trends.
Sectoral rotation, on the other hand, focuses on moving investments between different sectors of the economy depending on the current stage of the economic cycle or market sentiment. It is cyclical and tends to rely on macroeconomic indicators, corporate earnings reports, and sector-specific valuations.
While both strategies aim to enhance returns, their methodologies, timelines, and risk profiles differ significantly.
2. Thematic Trading: Definition and Approach
Thematic trading is the practice of investing based on overarching global or domestic trends that are expected to persist over a long period. These themes are not limited to individual sectors but often span multiple industries, geographies, or asset classes.
2.1 Key Characteristics
Long-term horizon: Thematic trading typically involves a medium- to long-term investment horizon, often spanning several years or even decades.
Trend-driven: Themes are identified based on macro trends like technological innovation (e.g., AI, robotics), environmental sustainability (e.g., renewable energy), or demographic shifts (e.g., aging populations, urbanization).
Cross-sector approach: Investments often span multiple sectors affected by the theme. For example, a “clean energy” theme could include solar manufacturers, battery producers, and electric vehicle companies.
Narrative-based: Thematic investing often relies on compelling narratives supported by research rather than purely quantitative indicators.
2.2 Examples of Popular Themes
Technology Revolution: AI, cloud computing, 5G, and semiconductors.
Green Energy & Sustainability: Solar, wind, electric vehicles, and ESG-focused companies.
Demographic Shifts: Companies targeting aging populations, healthcare innovation, or emerging markets urbanization.
Digital Economy: E-commerce, fintech, online entertainment, and cybersecurity.
2.3 Advantages of Thematic Trading
Alignment with macro trends: Investors can capitalize on long-term structural shifts before they are fully priced into the market.
Diversification across sectors: Even though the investment is theme-based, exposure across multiple industries reduces the risk of sector-specific shocks.
High growth potential: Being early in a theme can lead to substantial capital gains, especially if the trend becomes dominant.
2.4 Challenges of Thematic Trading
Execution risk: Identifying a successful theme and selecting the right companies or instruments requires extensive research.
Volatility: Themes can be highly sensitive to market sentiment, technological breakthroughs, or regulatory changes.
Timing difficulty: While the long-term trend may be solid, short-term corrections can be severe.
3. Sectoral Rotation: Definition and Approach
Sectoral rotation is a strategy where investors periodically shift their investments from one sector to another to capitalize on economic cycles. Unlike thematic trading, which is trend-driven, sectoral rotation is cycle-driven.
3.1 Key Characteristics
Short- to medium-term horizon: Typically ranges from a few months to a few years, depending on the economic cycle.
Cyclicality: Sector performance is tied to the stages of the economic cycle—expansion, peak, contraction, and trough.
Macro-driven: Investors rely heavily on macroeconomic indicators, such as GDP growth, interest rates, inflation, and consumer confidence, to anticipate sector performance.
Active management: Sector rotation requires regular monitoring and adjustments to the portfolio based on evolving economic conditions.
3.2 Economic Cycle and Sector Performance
Different sectors historically perform better at different stages of the economic cycle:
Economic Stage Sectors Likely to Outperform
Expansion Technology, Industrials, Consumer Discretionary
Peak Energy, Materials, Industrials
Contraction Consumer Staples, Utilities, Healthcare
Trough Financials, Real Estate, Technology (selective)
This table demonstrates that sector rotation is closely tied to macroeconomic trends rather than long-term structural shifts.
3.3 Advantages of Sectoral Rotation
Capitalizing on cycles: Investors can enhance returns by moving capital into sectors poised to outperform in the current economic phase.
Risk mitigation: By exiting underperforming sectors, investors can reduce exposure to cyclical downturns.
Data-driven decisions: Decisions are grounded in macroeconomic and sector-specific data, making it systematic.
3.4 Challenges of Sectoral Rotation
Timing risk: Mistiming entry or exit from sectors can erode returns.
Frequent adjustments: Requires active portfolio management, which can increase transaction costs.
Market unpredictability: Economic indicators do not always perfectly predict sector performance; external shocks can disrupt patterns.
4. Practical Implementation
4.1 Implementing Thematic Trading
Research: Identify global megatrends and assess their sustainability.
Stock selection: Pick companies that are leaders or innovators in the theme.
ETFs & mutual funds: Thematic ETFs offer diversified exposure to the theme without concentrated stock risk.
Portfolio allocation: Typically a part of a broader diversified strategy due to high volatility.
4.2 Implementing Sectoral Rotation
Macro analysis: Monitor economic indicators such as interest rates, industrial production, consumer spending, and inflation.
Sector selection: Identify sectors likely to outperform in the current stage of the economic cycle.
Tactical allocation: Adjust portfolio weights periodically to optimize returns.
Use of ETFs: Sector ETFs allow quick rotation without individual stock risk.
5. Synergies and Integration
Interestingly, investors can combine thematic trading and sectoral rotation to balance long-term growth and short-term tactical gains. For example:
Base investment in long-term themes like renewable energy or AI for structural growth.
Tactical adjustments through sectoral rotation based on economic cycles to capture cyclical opportunities in related sectors.
This hybrid approach leverages the strengths of both strategies—long-term upside potential from thematic exposure and short-term performance enhancement from tactical rotation.
6. Risk Considerations
6.1 Thematic Trading Risks
Misjudging the theme’s longevity or relevance.
Concentration in a narrow set of high-growth stocks.
Regulatory or technological disruptions affecting the theme.
6.2 Sectoral Rotation Risks
Poor timing leading to missed gains or losses.
Unexpected macro shocks that disrupt sector performance.
Overtrading, leading to high transaction costs.
Mitigation strategies include diversification, continuous research, use of ETFs, and disciplined rebalancing.
Conclusion
Thematic trading and sectoral rotation are powerful investment strategies, each tailored to different market perspectives and investor goals.
Thematic trading offers exposure to transformative long-term trends and is suitable for investors with a higher risk appetite and long-term horizon. It relies on strategic vision and foresight into future developments.
Sectoral rotation is a tactical, cycle-driven approach that allows investors to capitalize on short- to medium-term opportunities in line with the economic cycle. It demands active monitoring and timing skills.
Understanding the distinction, strengths, and limitations of these strategies enables investors to select the right approach—or a combination—for their portfolio objectives. While thematic trading emphasizes vision and innovation, sectoral rotation emphasizes timing and macro awareness. When used thoughtfully, both can significantly enhance portfolio returns while mitigating risk.

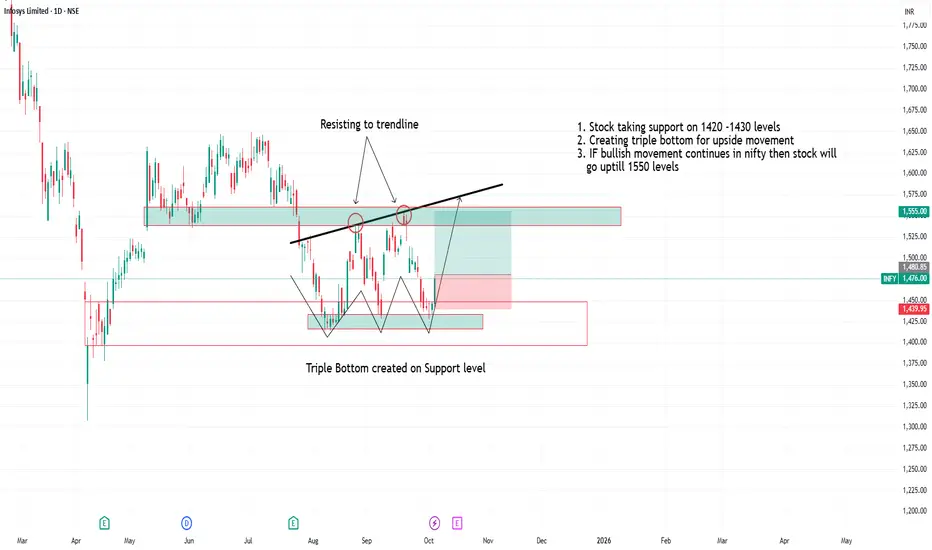
Infosys creating triple bottom on 1420-1430 level1. Stock taking support on 1420 -1430 levels
2. Creating triple bottom for upside movement
3. IF bullish movement continues in nifty then stock will
go uptill 1550 levels
Exploring Financial Market Types1. Money Market
The money market is a segment of the financial market that deals with short-term borrowing and lending of funds, usually with maturities of one year or less. It is primarily used by corporations, financial institutions, and governments to manage short-term liquidity needs.
Key Instruments in the Money Market:
Treasury Bills (T-Bills): Short-term debt instruments issued by governments to raise funds. They are considered risk-free and highly liquid.
Commercial Papers (CPs): Unsecured promissory notes issued by corporations to meet short-term funding needs. They generally have maturities ranging from a few days to nine months.
Certificates of Deposit (CDs): Time deposits issued by banks that pay a fixed interest upon maturity.
Repurchase Agreements (Repos): Short-term borrowing agreements where securities are sold and later repurchased at a predetermined price.
Functions:
Liquidity Management: Provides short-term funds to banks, corporations, and governments.
Efficient Allocation: Facilitates smooth functioning of the banking system.
Monetary Policy Transmission: Central banks use the money market to implement monetary policy through instruments like repos and T-bills.
The money market is characterized by low risk and relatively lower returns compared to long-term markets. Its efficiency ensures that the economy maintains liquidity and stability.
2. Capital Market
Capital markets deal with long-term funds, generally with maturities exceeding one year. They are crucial for economic growth as they enable corporations and governments to raise funds for investments in infrastructure, expansion, and other productive activities. Capital markets are broadly divided into primary markets and secondary markets.
a. Primary Market:
Also known as the new issue market, it is where new securities are issued and sold to investors.
Initial Public Offerings (IPOs): Companies raise equity by offering shares to the public for the first time.
Bond Issuance: Governments and corporations raise debt funds by issuing bonds.
b. Secondary Market:
Once securities are issued in the primary market, they are traded in the secondary market. Examples include stock exchanges like the New York Stock Exchange (NYSE), NASDAQ, and Bombay Stock Exchange (BSE).
Functions of Capital Markets:
Capital Formation: Enables businesses to raise funds for long-term growth.
Investment Opportunities: Provides a platform for individuals and institutions to invest their savings in productive assets.
Price Discovery: Helps determine the market value of securities through supply-demand dynamics.
Liquidity: Secondary markets allow investors to buy and sell securities easily, ensuring liquidity.
Participants in Capital Markets:
Retail investors
Institutional investors (mutual funds, pension funds)
Investment banks and brokers
Regulatory authorities (SEBI, SEC)
Capital markets are more volatile than money markets but offer higher potential returns due to the long-term nature of investments.
3. Derivative Markets
Derivative markets are financial markets where instruments derived from underlying assets are traded. The underlying assets can include stocks, bonds, currencies, commodities, or market indices. Common derivatives include futures, options, forwards, and swaps.
Purpose of Derivatives:
Hedging: Investors use derivatives to manage or mitigate risk associated with price fluctuations.
Speculation: Traders aim to profit from price movements in the underlying asset.
Arbitrage: Derivatives allow traders to exploit price differences across markets.
Types of Derivative Instruments:
Futures: Contracts obligating the purchase or sale of an asset at a predetermined price on a specific future date.
Options: Contracts that give the buyer the right, but not the obligation, to buy or sell an asset at a set price within a certain period.
Forwards: Customized contracts between two parties to buy or sell an asset at a specified future date and price.
Swaps: Agreements to exchange cash flows or other financial instruments between parties.
Derivative markets play a vital role in financial risk management but are complex and may involve significant leverage, making them riskier than money or capital markets.
4. Foreign Exchange Market (Forex)
The foreign exchange market, or Forex, is where currencies are bought and sold. It is the largest financial market globally, with trillions of dollars traded daily. Forex facilitates international trade, investment, and tourism by providing liquidity in different currencies.
Key Features:
Decentralized Market: Operates 24/7 without a central exchange.
Participants: Banks, corporations, central banks, hedge funds, and retail traders.
Major Instruments: Spot transactions, forwards, futures, and options in currencies.
Functions:
Currency Conversion: Enables businesses to transact internationally.
Hedging Exchange Rate Risk: Companies can hedge against fluctuations in currency values.
Speculation: Traders profit from currency movements.
Global Liquidity: Supports global trade and investment flows.
The Forex market is highly liquid and volatile, influenced by macroeconomic factors, geopolitical events, and central bank policies.
5. Commodity Markets
Commodity markets are where raw materials and primary products are traded. These markets include energy, metals, and agricultural commodities. Trading can occur through physical markets or financial instruments such as futures and options.
Types of Commodities:
Agricultural Products: Wheat, rice, coffee, sugar.
Metals: Gold, silver, copper, platinum.
Energy: Crude oil, natural gas, coal.
Functions of Commodity Markets:
Price Discovery: Determines the fair market value of commodities through supply and demand.
Risk Management: Producers and consumers hedge against price volatility.
Investment Opportunities: Investors diversify portfolios by including commodities.
Economic Indicator: Commodity prices reflect economic trends and inflation expectations.
Commodity markets can be highly volatile due to weather conditions, geopolitical events, and global demand-supply dynamics.
6. Other Financial Market Segments
In addition to the major market types, several specialized financial markets exist:
Insurance Market: Provides risk management solutions against unforeseen events.
Pension Funds Market: Manages retirement savings and invests in long-term securities.
Credit Market: Focuses on lending and borrowing of debt instruments.
Venture Capital and Private Equity Markets: Provides funding to startups and private companies.
These specialized markets complement traditional markets by addressing specific financial needs and enhancing overall market efficiency.
Conclusion
Financial markets are diverse, dynamic, and interconnected. They are crucial for economic growth, providing platforms for capital formation, liquidity, risk management, and investment. Each market type—money, capital, derivatives, forex, and commodities—serves unique functions and caters to different investor needs. Participants range from retail investors to multinational corporations and central banks, collectively shaping the global financial ecosystem. Understanding these markets enables investors, policymakers, and businesses to make informed decisions, manage risks effectively, and optimize returns. As the world becomes increasingly globalized and technologically driven, financial markets continue to evolve, creating new opportunities and challenges in the pursuit of economic growth and financial stability.
Modern Market Explosion: Understanding the Phenomenon1. Historical Context of Market Evolution
To understand the modern market explosion, it is essential to consider the historical evolution of markets. Traditional markets were largely localized. Traders and merchants operated within geographic constraints, and trade was limited by logistical, technological, and regulatory barriers. Economic activity was driven by physical commodities, and transactions were largely cash-based or involved simple barter systems.
The Industrial Revolution marked a turning point. Mass production, improved transportation networks, and the rise of factories enabled businesses to scale operations beyond local markets. Subsequently, the 20th century witnessed further market expansion with globalization, advancements in communication, and the liberalization of trade policies. Multinational corporations began operating across continents, and financial markets expanded in size and scope, laying the foundation for today’s explosive market growth.
2. Drivers of the Modern Market Explosion
The modern market explosion is driven by several interrelated factors:
2.1 Technological Advancements
Technology is the primary catalyst for market expansion. The digital revolution, characterized by the rise of the internet, mobile technology, and cloud computing, has created new markets and transformed existing ones. E-commerce platforms, fintech applications, and digital payment systems have made it possible for businesses to reach consumers globally with minimal cost. Artificial intelligence (AI), machine learning, and big data analytics have enhanced market efficiency by enabling predictive modeling, targeted marketing, and personalized consumer experiences.
Blockchain and cryptocurrency technologies have introduced decentralized finance (DeFi) and digital assets, adding entirely new dimensions to global markets. Technology also supports real-time communication and logistics management, reducing transaction friction and enabling just-in-time supply chains.
2.2 Globalization
Globalization has exponentially increased market reach. Trade liberalization, the reduction of tariffs, and the establishment of free trade agreements have integrated economies worldwide. Businesses can now source raw materials from one continent, manufacture in another, and sell products globally. This integration has expanded consumer bases, diversified product offerings, and intensified competition. Globalization has also facilitated cross-border investments, enabling capital to flow more freely and boosting market liquidity.
2.3 Financial Innovation
Modern financial markets have grown through innovation. Derivatives, exchange-traded funds (ETFs), and securitization have increased market complexity while providing investors with diverse opportunities for risk management and profit generation. The rise of retail investing, supported by digital trading platforms and mobile apps, has democratized access to markets, contributing to higher transaction volumes and market participation.
2.4 Consumer Behavior and Social Trends
Changing consumer behavior has further accelerated market growth. Modern consumers demand convenience, variety, and personalized experiences. The rise of social media and influencer culture has altered purchasing patterns, creating viral trends that can rapidly inflate demand for products and services. Millennials and Gen Z, in particular, prioritize experiences, sustainability, and digital engagement, shaping market offerings in unprecedented ways.
2.5 Policy and Regulatory Environment
Governments and regulatory authorities play a critical role in enabling market expansion. Policies that promote entrepreneurship, protect intellectual property, and ensure financial stability encourage business growth. Conversely, relaxed regulations in digital finance and cross-border commerce have facilitated innovative market models, including fintech startups, gig economy platforms, and decentralized marketplaces.
3. Characteristics of Modern Market Explosion
The modern market explosion exhibits several distinctive characteristics:
3.1 Scale and Speed
Modern markets operate on an unprecedented scale and at extraordinary speed. Global supply chains, e-commerce, and digital finance allow businesses to scale rapidly. Information spreads instantly, enabling consumers to respond to trends in real-time, which amplifies market volatility and opportunity.
3.2 Diversification
Markets are increasingly diversified. Beyond traditional goods and services, there are emerging sectors such as renewable energy, artificial intelligence, electric vehicles, digital entertainment, and virtual assets. This diversification reduces reliance on single industries while creating new economic opportunities and employment avenues.
3.3 Interconnectedness
Modern markets are highly interconnected. Economic events in one region can rapidly affect global markets, as witnessed during the 2008 financial crisis and the COVID-19 pandemic. Interconnectedness increases both the potential for growth and the susceptibility to shocks.
3.4 Consumer-Centricity
The explosion of modern markets is heavily driven by consumer-centric models. Businesses leverage data analytics and AI to anticipate consumer needs, personalize offerings, and optimize engagement. Direct-to-consumer (D2C) models, subscription services, and platform-based marketplaces exemplify this shift.
3.5 Financialization
Financialization of markets—where financial markets and instruments dominate economic activity—has accelerated growth. Companies can raise capital more efficiently, investors can access diverse asset classes, and speculative trading contributes to rapid market expansion. However, this also increases systemic risk, as market bubbles and crashes can propagate quickly.
4. Technological Catalysts in Depth
4.1 E-commerce and Digital Platforms
E-commerce platforms like Amazon, Alibaba, and Flipkart have revolutionized retail markets. Consumers can purchase products from anywhere, while businesses can reach global audiences without investing in physical stores. Digital marketplaces reduce barriers to entry for small and medium-sized enterprises (SMEs), fostering entrepreneurship and competition.
4.2 Artificial Intelligence and Automation
AI and automation enhance efficiency in supply chains, inventory management, customer service, and financial trading. AI-driven algorithms can predict market trends, optimize pricing strategies, and personalize consumer experiences, accelerating market activity and growth.
4.3 Cryptocurrency and Blockchain
Blockchain technology enables decentralized markets that operate independently of traditional financial systems. Cryptocurrencies, smart contracts, and NFTs (non-fungible tokens) have created entirely new investment avenues, attracting retail and institutional participation alike.
5. Economic and Social Implications
The explosion of modern markets has profound economic and social consequences:
5.1 Economic Growth
Market expansion drives economic growth by increasing production, employment, and consumer spending. Emerging sectors, particularly in technology and renewable energy, stimulate innovation and long-term economic resilience.
5.2 Inequality and Market Access
While markets have grown, access is not uniform. Digital divides, regulatory barriers, and capital concentration can exacerbate inequality. Wealth and market influence often cluster among large corporations and tech giants, raising concerns about monopoly power and market fairness.
5.3 Volatility and Risk
Rapid market expansion increases volatility. High-frequency trading, speculative investment, and global interconnectivity mean that shocks can propagate rapidly. Regulatory oversight and risk management are crucial to prevent systemic crises.
5.4 Consumer Empowerment
Consumers benefit from greater choice, convenience, and competitive pricing. The explosion of markets empowers individuals to make informed decisions, access global products, and influence market trends through social and digital platforms.
6. Case Studies of Market Explosion
6.1 Technology Sector
The rise of technology companies exemplifies market explosion. Firms like Apple, Google, Microsoft, and Amazon have scaled rapidly, creating new market categories while reshaping existing ones. Their influence spans multiple sectors, from cloud computing to entertainment, reflecting the interconnected nature of modern markets.
6.2 E-commerce and Retail
E-commerce has transformed retail markets globally. During events like Black Friday or festive seasons, platforms witness unprecedented transaction volumes. Social commerce, live-stream selling, and digital marketing have accelerated consumer engagement and market growth.
6.3 Renewable Energy
The renewable energy market has exploded due to global sustainability goals, policy incentives, and technological innovation. Solar, wind, and battery storage markets have expanded rapidly, attracting investment and creating new industries, illustrating how market growth aligns with social and environmental priorities.
7. Challenges and Risks
Despite opportunities, the modern market explosion presents challenges:
Market Volatility: Rapid growth and speculation can lead to sudden crashes.
Regulatory Lag: Regulations often struggle to keep pace with innovation, particularly in digital finance and cryptocurrencies.
Inequality: Concentration of wealth and market power can marginalize smaller players.
Sustainability: Unsustainable business practices may undermine long-term market stability.
8. Future Outlook
The future of market growth will likely be shaped by emerging technologies such as AI, quantum computing, and advanced robotics. Sustainability and ESG (Environmental, Social, Governance) considerations will increasingly influence investment and consumer decisions. Global markets will continue to integrate, but geopolitical tensions, trade conflicts, and technological competition will introduce uncertainties.
The democratization of markets through digital platforms, social media, and decentralized finance will continue to empower individuals and SMEs. However, balancing innovation with regulation, stability, and inclusivity will be critical to ensuring sustainable growth.
Conclusion
The modern market explosion is a defining characteristic of the 21st-century economy. It is driven by technological innovation, globalization, financial innovation, and changing consumer behavior. While it offers unprecedented opportunities for growth, entrepreneurship, and consumer empowerment, it also presents challenges related to volatility, inequality, and regulatory oversight. Understanding this phenomenon requires a holistic view of the interconnected social, technological, and economic forces shaping modern markets. As markets continue to evolve at a rapid pace, stakeholders—from policymakers to businesses and consumers—must navigate both the opportunities and risks to harness the full potential of this extraordinary expansion.

Intraday Scalping Tips1. Understanding Intraday Scalping
Definition
Scalping is the practice of profiting from small price changes in a stock, commodity, or currency. Scalpers often aim for gains of just a few points per trade but compensate for the small size with a high volume of trades.
Characteristics of Scalping
Very short holding periods, usually minutes or seconds.
Requires liquid markets where orders can be executed quickly.
Relies heavily on technical indicators, charts, and patterns.
Emphasizes risk management because losses can accumulate quickly.
Scalping is not suitable for everyone. It demands intense focus, fast decision-making, and a temperament capable of handling frequent small losses.
2. Choosing the Right Market and Stocks
Market Selection
Scalping works best in markets that are:
Highly liquid, like major indices (Nifty 50, S&P 500) or high-volume stocks.
Have tight spreads, ensuring minimal slippage between buy and sell orders.
Experience consistent intraday volatility, providing opportunities to profit from small movements.
Stock Selection
For intraday scalping, consider:
High liquidity: Stocks that trade in large volumes are easier to enter and exit.
Low bid-ask spreads: Narrow spreads reduce trading costs.
Volatility: Moderate volatility is ideal; too little movement limits opportunities, while too much increases risk.
3. Technical Tools for Scalping
Scalpers rely heavily on technical tools rather than fundamental analysis. The most commonly used indicators include:
a) Moving Averages
Short-term moving averages (SMA, EMA) like 5-period or 15-period help identify trends and reversals.
Crossovers can signal quick entry or exit points.
b) Bollinger Bands
Measures volatility and can help scalpers spot overbought or oversold conditions.
Price touching the upper band may signal a potential sell, while the lower band may indicate a buy.
c) Relative Strength Index (RSI)
RSI helps detect momentum and potential trend reversals.
A value above 70 indicates overbought conditions, while below 30 suggests oversold conditions.
d) Volume Indicators
Volume confirms strength of a price move.
A sudden spike in volume can indicate a strong intraday trend, ideal for scalping.
4. Scalping Strategies
a) Momentum Scalping
Focuses on stocks showing strong momentum in one direction.
Scalpers enter quickly when a breakout occurs and exit when momentum weakens.
Works well with high-volume news-driven stocks.
b) Range Trading
Used when a stock is trading within a range.
Buy at support levels, sell at resistance.
Requires quick execution and constant monitoring.
c) Trend Following
Scalpers ride a short-term trend, entering on pullbacks and exiting before reversal.
Tools like moving averages and trendlines are crucial.
d) News-Based Scalping
Scalping stocks around news events like earnings announcements or economic data releases.
Requires high-speed execution and understanding of market sentiment.
5. Risk Management
Scalping is high-frequency, and small losses can add up quickly. Effective risk management is essential:
a) Stop-Loss Orders
Always set tight stop-losses, usually 0.2–0.5% of the stock price.
Avoid emotional decisions; strictly adhere to stops.
b) Position Sizing
Only risk a small portion of capital per trade (1–2% of trading capital).
Prevents a single loss from wiping out profits.
c) Avoid Overtrading
Stick to high-probability trades only.
Trading every small movement leads to losses due to slippage and fees.
6. Timing and Market Hours
Scalping is most effective during high volatility periods:
Market open (first 30–60 minutes).
Just before market close.
Avoid the midday session when markets are often quiet and range-bound.
7. Tools and Technology
Scalping demands speed and precision:
Broker with low latency execution.
Real-time charts and Level II market data.
Hotkeys for quick order execution.
Algorithmic or automated tools can help manage multiple trades efficiently.
8. Psychology of a Scalper
Patience and discipline: Wait for setups, don’t force trades.
Detachment: Avoid emotional attachment to positions.
Focus under pressure: Quick decisions without hesitation.
Learning from mistakes: Analyze trades to identify patterns of success or failure.
9. Common Mistakes to Avoid
Ignoring risk management.
Trading illiquid stocks or large spreads.
Overtrading due to impatience or boredom.
Chasing losses instead of cutting them.
Relying solely on indicators without considering price action.
10. Developing a Scalping Plan
A clear plan is essential for long-term success:
Define entry and exit rules.
Set profit targets and stop-loss levels.
Decide on maximum number of trades per day.
Record trades in a journal to refine strategy over time.
11. Conclusion
Intraday scalping can be highly rewarding but is not for the faint-hearted. Success requires a mix of technical expertise, discipline, and psychological resilience. By focusing on high-liquidity stocks, using technical tools effectively, and strictly managing risk, traders can make consistent profits in the fast-paced intraday market.
Remember: Scalping is a skill developed over time, and even small, disciplined gains can accumulate into significant profits when executed correctly.