INFY Long OpportunityWe can see In INFY Long Build Up.
As per technically if price will comes @ entry level then go for long up to given target.
Trade ideas

INFY - Weekly AnalysisIn the Weekly Chart of INFY ,
we can see that; it looks very Bullish.
It might retest the 200 EMA level.
Possible Bullish momentum is shown in chart.
Go very long for INFY .

Swing Buy Opportunity : Infosys There is clear breakout in Infosys and stock has taken a support on 200EMA.
Please refer the chart for the Targets as per Risk Reward 1:1 and 1:4 respectively.
Post achieving the targets one can trail the stop loss as per the previous swing low
Note: This information is for Learning/entertainment purpose only and should not be treated as any trade recommendation. Please do research and consult your advisor prior to taking any actions.
If you like this Idea, Please do like my ideas and share it with your friends. To further connect check my bio.
Please boost my ideas and send cheers as it acts as a motivation to keep posting my analysis.
Thank you

INTRADAY TRADE SETUP #INFOSYSINFOSYS is now present at important support zone1265 ,( june 9th) also same place support has been take and good rally upside has been seen 1260 zone also has huge PE writing in option chain which may also act as support so combining all the factors it should be bullish untill price stays above 1265

INFY | Trying to capture a 10-15% moveINFY | Trying to capture a 10-15% move
CMP : 1294
SL : 1250
Target : 1440, 1600

INFY longThe chart pattern is suggesting that INFY is trending upside and today's closing is signaling that the stock has the strength to go up. As per the chart next stops should be 1333 and 1374.
Disclaimer - I am not a SEBI-registered technical analyst and advisor so contact your financial advisor and make a self-decision. I will not be responsible for any profit and loss

Infy looks weakInfy looks we ak
Infy break its support line in daily chart
H&S pattern completed on daily support line.

INFY - Weekly AnalysisIn the Weekly Chart of INFY ,
we can see that; it has retested the trendline.
we can achieve a Good Risk ration from here.
Expected momentum is shown in chart.

Infy - wedge popLong - cmp
sl - below 1290
large cap IT names have underperformed and consolidated for a while,
in a strong bull market, sector rotations occur often from extended sectors to underperforming ones

INFY Triangle Pattern INFY triangle pattern on daily time frame & as always INFY making range after breakdown everytime same trend seen in INFY Chart now let’s see what INFY do?? wait for pattern to give breakout or breakdown

BULLISH MOMENTUM STOCKThe stock has a daily RSI of 50.9, a weekly RSI of 50.5, and a monthly RSI of 50.1.
The MACD has crossed above the signal line, and the volume is rising.

Long Term swing idea "INFOSYS"available at a great discount, you can buy here and forget.
This bluechip giant can create wealth for you.
can start your accumulation here upto 1055.
Just buy and sit, this bull will make you good money

where is infy heading to ? be safe on IT stocksRemember i had advised to short infy when it was 1335 and now its close at 1265. where is it really heading to ? The fibo levels of the swing low says it may reach the recent swing low of 1186, unless it closes above 1279 on a daily basis. Given the weak outlook for the stock, better to avoid the stock for some time now.

Long infy Long Infy for Very short term can hold till 2 June to get good dividend. Can trade in options too


Rightly said about INFY falling from 1335 levels !How many cashed in on the rally of infy to 1335 levels for selling. i had publised on 27th may and 29th may about infy falling firstly to the level of 1285, today it fell to 1274 level . Go as per the fibo chart for further levels. book profits if you have shorted at 1335 levels.

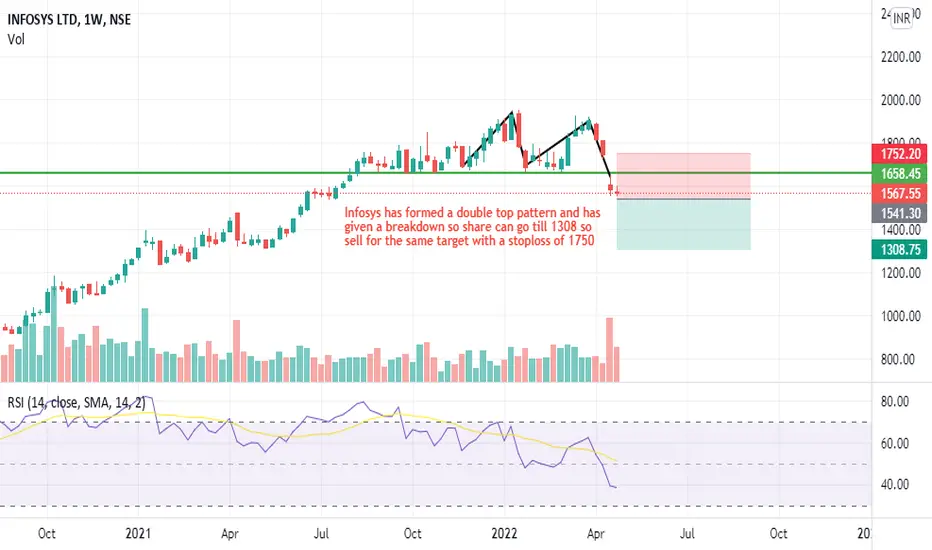
Infosys - Major BreakdownInfosys has given a major breakdown below 1750 and has formed a double top pattern before breakdown so can go shorting the same.
NOTE - PLEASE TRADE ON YOUR OWN RISK IN CONSULTATION OF YOUR FINANCIAL ADVISOR
IFY melting down.Infy as predicted on friday melt down excellently and i expect downside until atleast 1285 either today or days to come

INFY's current rally could be used to sellThe recovery of Infy could be potentially used to be sold, given the poor performance of the company and the future commentary of the company. The 1350 and 1366 could be strong resistance for the stock to march higher. shorts could be initiated with these strict SL. for target of 1288 and below.

INFY BreakoutINFY has given breakout of the consolidation zone hence it can rise upwards to fill the Gap.

trend reversal infosysafter a big gap down infy consolidated in certain price range
form here it given range breakout it may try to fill that gap
nifty it is turning back It stock will get movement from here

Infy bullishInfosys is in channel and there is indecisive candle today created
If closes above 1300 then next target 1365

INFY - AnalysisThe key levels for INFY are as follows.
The move is ready to take off.
Buy - 1247
Target - 1365
