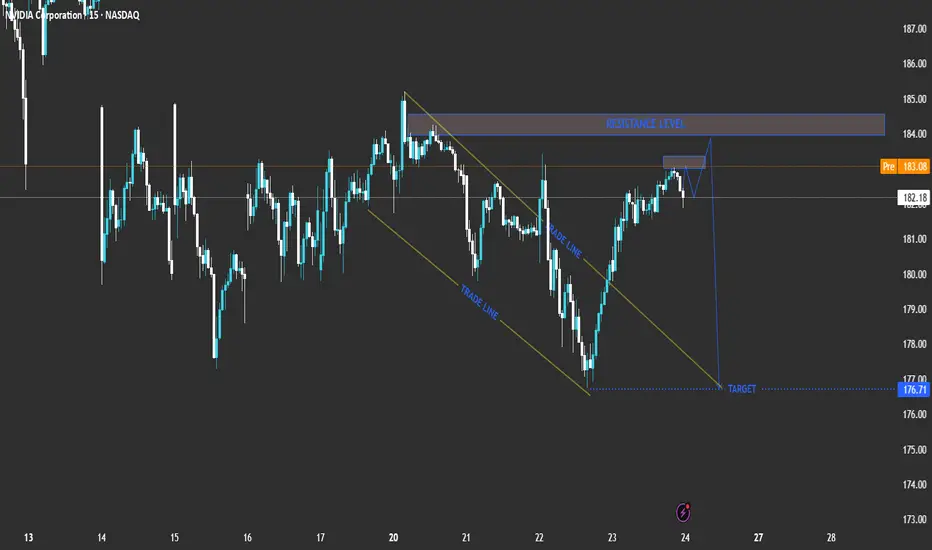
l analysis for NVIDIA Corporation (NVDA) based on your chart:Current Price: 182.18
Pre-Market Price: 183.21
Trend: Short-term bullish recovery inside a broader corrective phase.
Technical Breakdown
Descending Channel (Trade Line)
NVDA recently traded inside a downward-sloping channel, showing controlled selling pressure.
The breakout above the upper trade line suggests a short-term bullish correction phase.
Resistance Zone
A strong resistance level lies between 183.00 and 184.00.
This zone aligns with previous highs and may act as a reversal area if the price fails to break above it.
Expected Move
The chart projection shows a potential rejection near the resistance level, followed by a pullback towards the 176.71 target area.
This indicates that the current upward move might be corrective before another bearish swing.
Trade Scenarios
📉 Bearish Reversal Scenario (Primary Setup)
Entry Zone: 183.00 – 184.00 (resistance area)
Confirmation: Bearish rejection candlestick pattern or a failed breakout.
Target: 176.71
Stop Loss: Above 184.50
Comment: Ideal short setup if price rejects resistance.
📈 Bullish Breakout Scenario (Alternative)
Entry: Above 184.50 with strong bullish momentum.
Target: 186.50 – 187.00
Comment: A breakout and hold above resistance would invalidate the short setup and indicate further upside.
Summary Table
Bias Key Level Confirmation Target Notes
Bearish (Primary) 183 – 184 Rejection candle 176.71 Short setup
Bullish (Alternative) Above 184.50 Breakout candle 186.5 – 187 Upside continuation
Conclusion
NVIDIA (NVDA) is approaching a crucial resistance level. The most probable scenario is a bearish reversal from the 183–184 zone, targeting 176.71. However, a confirmed breakout above 184.50 would signal bullish continuation toward 187.00. EURONEXT:KBCA EURONEXT:UMI EURONEXT:AZE EURONEXT:KBC EURONEXT:ABI EURONEXT:GBLB EURONEXT:LOTB EURONEXT:NYXH EURONEXT:PROX EURONEXT:SIP EURONEXT:ABO EURONEXT:AGFB XETR:SAP GETTEX:NSE XETR:CON XETR:HCL FWB:BREA
Trade ideas

NVDA UP TO 214$Hello
According to my analysis on the NVDA daily chart, I can confirm a high-probability buy opportunity that could reach $214 within the next few days.
Ibrouri Abdessamad

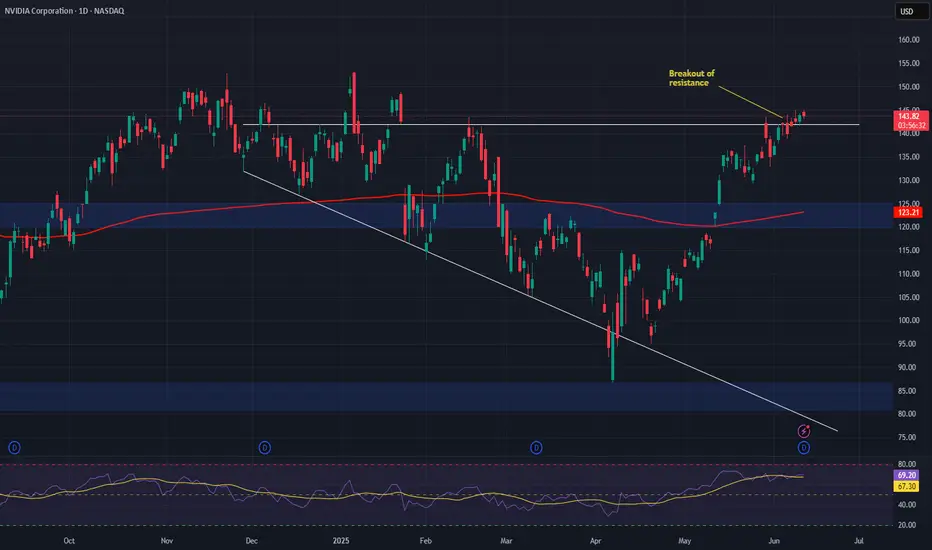
NVIDIA CORPORATION #NVDA #NASDAQ $NVDANvidia Corporation is breakout above 184.48
I'm initiating fresh long here with 181 as intraday stop loss.
I will be out completely if closing comes below 184.48.

NVDA Breaks Trendline, Eyes $155–150 SupportNVIDIA recently gave a trendline breakdown on the chart, indicating that bullish momentum has weakened. After the breakdown, the stock also retested the broken trendline from below, which is a common technical behavior — often referred to as a breakdown and retest pattern. This confirms that the broken trendline has now turned into a resistance level.
⚖️ Implications
Since the retest failed to reclaim the trendline, selling pressure is likely to continue.
The stock is now vulnerable to further downside and may gradually drift lower.
The immediate support zone lies at $155–150, which coincides with prior demand areas where buying interest previously emerged.
✅ Key Levels
Resistance (Invalidation): The broken trendline — if price reclaims and sustains above it, bearish momentum weakens.
Support: $155–150 zone (short-term target area).
Trend Bias: Bearish as long as the stock trades below the retested trendline.

NVDAPrice is consolidating in the form of a symmetrical triangle. 180 is an important zone. Sustaining above this is important to be bullish.
Buy above 180.5 with the stop loss of 179 for the targets 182, 183.5, 185, and 187.5
A symmetrical triangle can give a breakout in any direction. Price will become bearish below 177.
Always do your analysis before taking any trade.

NVDAgood parallel channel setup on daily chart. results are few days away. any closing above 132 may be very good for short term

Nvidia (NVDA) – Building the AI Wave, Not Just Riding ItCompany Overview:
Nvidia NASDAQ:NVDA remains the undisputed leader in AI, high-performance computing, and now increasingly software infrastructure. With growing exposure to agentic AI, healthcare AI, and autonomous systems, Nvidia is redefining its growth story beyond semiconductors.
Key Catalysts:
🧠 Software Ecosystem Expansion
AI Blueprints, Llama Nemotron, and NIM microservices fuel adoption of agentic AI
High-margin, recurring revenue from software complements GPU hardware growth
Moves Nvidia closer to a platform-as-a-service model
🏥 Healthcare AI Momentum
Siemens Healthineers adoption of MONAI Deploy accelerates Nvidia’s footprint in diagnostics & imaging
Opens the door to pharma, life sciences, and clinical AI markets—a multi-billion-dollar TAM
🔧 Physical & Agentic AI Enablement
Positioned at the frontier of robotics, autonomous machines, and next-gen interfaces
Nvidia's tech stack is becoming foundational to the next wave of machine intelligence
Investment Outlook:
✅ Bullish Above: $120.00–$125.00
🎯 Target Price: $220.00–$230.00
📈 Thesis Drivers: AI platform leadership, expanding software revenue mix, and key vertical growth in healthcare & robotics
🧩 Nvidia isn’t just enabling AI—it’s defining its future. NASDAQ:NVDA #AIStocks #AgenticAI #Semiconductors
NVDA:SELLThere is a resistance at 116.7, even with high volume price couldn't cross this level.
Risk:Reward looks good on daily chart.
1:2

NVIDIA Analysis for quick target.After the decision to allow gadget tariff free. It will fly like anything and reach the target 126. It is in uptrend now.
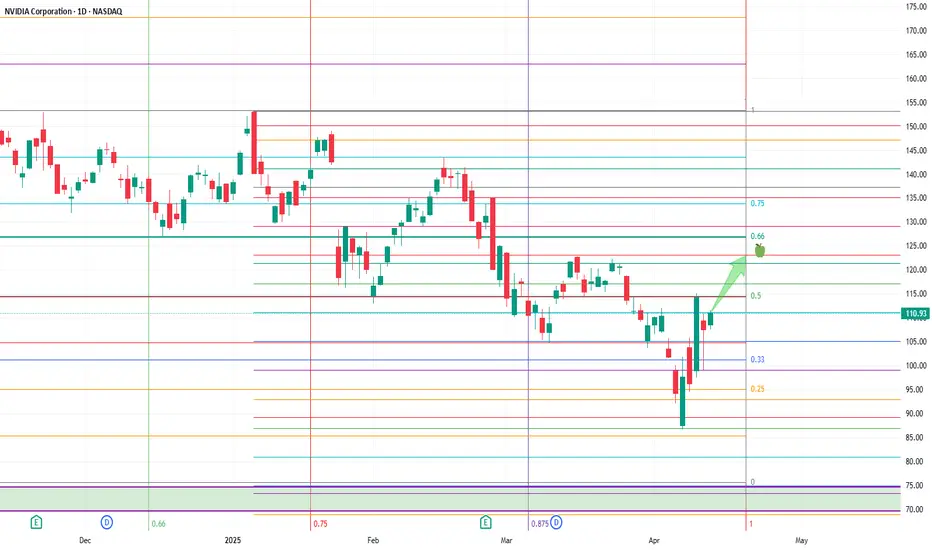
NVDA’s Final Act: A Breakout Waiting to HappenNVDA appears to be nearing the completion of its corrective phase, setting the stage for a potential move to new highs. The current pattern resembles a falling wedge, indicative of an ending diagonal formation, which often signals a reversal and the start of an upward trend.
The structure of the corrective channel, along with the termination of the diagonal pattern, suggests a high likelihood of a running flat formation. Buyers are likely to intensify demand pressure as the price approaches the lower boundary of the trendline. A trend reversal may occur if there is a decisive breakout above the Wave 4 level of the ending diagonal.
Buying opportunity with minimal stop is possible after the reversal from lower side of the channel. Targets can be 112 - 120 - 132 - 140.
I'll be sharing more details shortly.

NVIDIA on the way to 80-90$Based on the EW theory, it is on the way to USD 80-90. The inability to close the gap and change in market players sentiment toward this share will take care of this fall. Mostly the TOP is in place in the short/mid term.

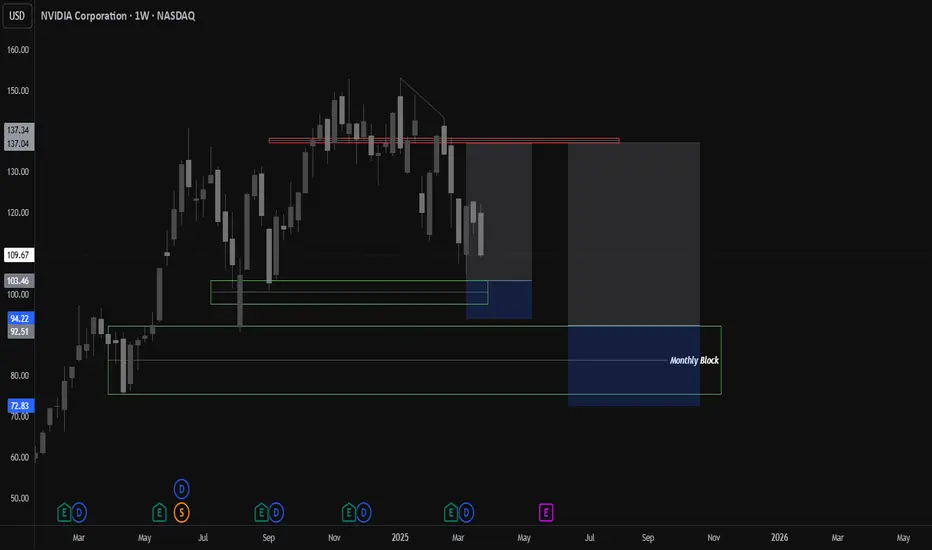
Nvidia looking to spice things up maybe ?Stock: Nvidia
Monthly orderblock retest is also possible if the current higher levels fail due to tariff talks in the US.
Weekly zones seem to holding very well.
Good market structure. Can look for some good potential swing moves here.
Be careful. US markets are wild.
NVIDIA If a weekly candle sustains on close below 113 then it could fall to 68 level within 30th June 2025
Disclaimer:
It's a personal view not a financial advice and I assume no responsibility and liability whatever outcome arises.

Expanding Flat on NVIDIA: Bearish or Final Leg?NVIDIA after a recent bullish trend has formed an Expanding Flat correction.
Wave (B) exceeded Wave (A)’s start, confirming this as an Expanding Flat (3-3-5) structure.
Wave (C) is in progress, unfolding in a five-wave sequence.
The 1.618 Fibonacci extension (~102 USD) is a key support zone, with 2.618 (~56 USD) as an extreme bearish target.
A reversal could follow after Wave C completes, so these levels are crucial to watch.
Key Levels to Watch:
102 USD (1.618 Fib extension - first support zone).
56 USD (2.618 Fib extension - extreme bearish case).
❓ Is this the final leg down before a bullish reversal, or more downside ahead?

Nvidia at Critical Support: Key Levels to Watch After EarningsNvidia (NVDA) recently delivered impressive earnings, exceeding expectations with robust revenue growth. However, despite the strong numbers, the stock has faced a pullback, shedding about 8.5% as broader AI-related stocks also experienced a downturn. While the long-term outlook remains positive, traders are closely watching key technical levels to assess potential movements.
Major Support Levels:
$115: This level coincides with the 50-day moving average and has historically acted as strong support. A breakdown below this zone could signal further downside pressure.
$102: If selling pressure intensifies, Nvidia could test this level, representing a deeper retracement to previous price action seen in early March.
Key Resistance Levels:
$136: A critical resistance point where the stock previously peaked. A break above this level could suggest renewed bullish momentum.
$150: The next major resistance zone, marking previous highs and serving as a key psychological barrier for investors.
Despite the recent pullback, Nvidia remains a dominant force in AI and semiconductor growth. Traders should monitor these levels closely, as a break below support could lead to further declines, while an upward move beyond resistance may indicate a resumption of the long-term uptrend. Given the current market volatility, applying risk management strategies such as stop-losses and position sizing is crucial for navigating the stock’s price action.

10 tricks for developing discipline or here was WarrenIf you asked me, what is the most valuable trait an investor should have, I would call it the ability to follow your own rules. In other words, it is discipline. A novice investor can learn quickly, know all the features of the chosen strategy from A to Z, but it is unlikely that he will succeed without this trait. So, Warren Buffett called persistence your engine, and discipline the guarantee of a successful future.
Imagine that you have sailed to an unusually beautiful island with the goal of finding a treasure chest. To achieve this, you have a map with a description of all the paths and turns that you need to take to reach your goal. However, after the first 100 meters of the path you understand that this island has a huge number of amazing plants, ripe fruits, and curious animals. All this is very interesting and attractive for you: firstly, you want to take a photo of a beautiful flower, secondly, try a tropical fruit, thirdly, play with a funny monkey. “Why not? This is a great chance!” you think. After a while, having enjoyed the life of the island, you realize that it is already evening, and it is easier to spend the night somewhere under a palm tree and continue the search for treasure tomorrow, during daylight hours. “That’s a smart idea!” you note and begin to prepare a place to sleep.
In the morning, you wake up in a good mood, you are greeted by familiar flowers, fruits and a cheerful parrot. Since you already know all this, you decide to continue following the map to find the treasure today and sail on. The path is easy for you: the entire route is marked in advance, you just follow these instructions. So, here you are. At the roots of the largest palm tree, under many branches, there should be a treasure chest hidden. You clear away the branches, and here your expectation collides with a shocking reality. Instead of a chest, you see a hole, where at the bottom, with a wooden stick, is written: “Warren was here”.
In this example, Warren had the same map as you. Moreover, he arrived on the island much later. The only difference is his model of achieving the goal. He understood that exploring the island was not a priority for him right now. Warren would be happy to return there, but this time with the goal of relaxing, perhaps on his brand-new ship. And while he came to the island to look for treasure, he is looking for it. Everything else, despite all its attractiveness, is for him a risk of not achieving the goal.
I also think of my stock investing strategy as a map that helps me understand where I should turn in any given situation. The only thing that makes me follow the route is discipline. Unfortunately, I can't put the stock market on pause or ignore corporate news - they all require my attention. If I choose this path, I follow it. In other words, if I am not going to follow the recommendations of my map, then why did I choose this path?
However, how difficult it is to look calmly at temptations. A man is not a robot. So we need some tricks that can help us with discipline. I think that in this regard, the most brilliant invention of mankind was and remains the alarm clock. No matter how much we sleep, when the alarm rings, we wake up. The most disciplined people even set several alarms to make sure they wake up! On the one hand, it irritates us like crazy, on the other hand, have you ever thought about how well it helps us relax? After all, there is no longer a need to wake up and determine the time by the brightness of the sun from the window - now we have an alarm clock! It turns out that discipline can be associated with pleasant things.
By the way, on TradingView, such a brilliant invention is “Alerts”. I wrote about this function in the article: “A pill for missed opportunities” . I will only add that the alert system can be applied not only to the stock price, but also to the indicators that you use on the chart, as well as to a whole watch list. So, make a list of companies you want to keep an eye on. Then set alerts when a certain condition related to price or indicator value is reached. And finally, wait calmly. Yes, this is what will take up all your time - waiting. And believe me, it takes a lot of discipline to just wait.
To develop this trait, I recommend creating habits that are organically linked to your strategy. For example, to decide about a deal, I constantly refer to news about the selected companies. It is significant for me to understand whether critical events have arisen that could influence my decision to open or close a position. However, regularly reading corporate news can hardly be called a fascinating activity for everyone. This is not looking at memes at all. Therefore, below I will give a few tricks that will help make this (and not only this) activity systemic:
1. Set your alarm for 1 hour before the stock market opens. Let this signal remind you that it is time to study the news on companies that have already been bought or are very close to being bought.
2. Make access to news as convenient as possible. Install the TradingView app on your phone, tablet, home computer or laptop. Don't have problems accessing information in any situation: if you are lying on the couch, sitting at the table or walking in the park.
3. Start with small steps. For example, start by reading only the headlines of news stories, rather than the entire story at once. Gradually increase the amount of incoming information. In one full hour, you can easily gather all the information you need to get a complete picture before the market opens.
4. Use modern technologies. For example, reading news from your voice assistant. This is convenient if you are on the move.
5. Combine your habit with another direction you are developing. For example, if you are learning a foreign language, practice reading the news in that language.
6. Organize public attention to your habit. For example, agree with your wife that for every time you skip a habit, you take her to a new restaurant (I think the most effective method for married men). Chat with like-minded people and/or post your thoughts on the news on social networks. The extra attention will motivate you to keep doing it.
7. Add a little joy to your news reading habit. If you like freshly squeezed juice, place a glass of it next to you. After the work you've done, be sure to thank yourself. For example, a delicious dessert or watching one episode of your favorite TV series.
8. Formulate your goal as follows: not to be someone who understands everything, but to be someone who never misses a single event.
9. Separately, I would like to draw attention to keeping a diary of your operations. This is an essential document that will help you track your progress - your Track Record. At the same time, it is one of the systemic habits. I recommend adding to Track Record information about cash transactions, trades, taxes, dividends, conditions that prompted you to open or close a position in shares. You can organize such a diary in any spreadsheet to calculate some of the metrics using formulas.
Below, I will present the metrics that I use in my Track Record. All data in it will be provided as an example only.
10. And finally, I think it is significant to visualize your achievements not only in electronic form, but also to have a physical embodiment of your results. For example, these can be empty glass flasks where you can put coins or balls corresponding to certain actions: opening a position, closing a position with a profit, closing a position with a loss, paying dividends. One flask - one year. Such an installation will look beautiful in your room or office and will remind you of what you have finally achieved. You might even have some interesting stories to tell to curious guests who notice this piece of furniture.

Option Trading Options are a type of contract that gives the buyer the right to buy or sell a security at a specified price at some point in the future. An option holder is essentially paying a premium for the right to buy or sell the security within a certain time frame.
When options are better. Options can be a better choice when you want to limit risk to a certain amount. Options can allow you to earn a stock-like return while investing less money, so they can be a way to limit your risk within certain bounds. Options can be a useful strategy when you're an advanced investor.

Nvidia $nvda Corporation Technical Analysis - Daily Time Frame➡️💘#Nvidia NASDAQ:NVDA Corporation is a leading 🇺🇸#American technology company known primarily for designing graphics processing units (GPUs) for the gaming and professional markets, as well as being a key player in the development of artificial intelligence #AI and machine learning technologies. Here's some detailed
📉chart information for your reference

$NVDA at key levelNASDAQ:NVDA needs to hold this long term trendline. I believe that the DeepSeek fear may be overblown for the moment. I would like to see this level hold going into earnings.

Nvidia Share Ready to take a Deep Bath Charts showing Nvidia share wants a deep bath in this bull rally for company share.

NVDA Bullish Breakout: Key Levels to Watch!NVIDIA Corporation (NASDAQ: NVDA) is showing strong bullish momentum after breaking the key resistance level at $146.88.
Support Levels: $128.04 acts as a strong support from the recent consolidation phase.
Resistance Levels: The stock recently broke past $146.88 and is heading towards the next target around $149.67.
Technical Indicators: The 20-day and 50-day moving averages indicate a bullish crossover, confirming upward momentum.
Volume Surge: Increased buying volume supports the breakout, suggesting strong investor interest.
If the price sustains above $146.88, it could move towards $149.67 and possibly beyond. However, if it fails to hold this level, a pullback towards $140 or $135 could occur.
Trade Idea:
Entry Point: On a retest of $146.88 or a strong close above $149.
Stop Loss: Below $144 for risk management.
Target: $150 and $155 levels in the short term.
What do you think about NVIDIA’s breakout? Let’s discuss in the comments!

NIFTY 50 - Jan 07 AnalysisToday, NVDA opened with a gap-up and reached its November 2024 high.
Important Key Levels to Watch:
Above $154.45: A breakout above this level could present potential buying opportunities.
Below $148.00: A breakdown below this level might signal selling opportunities.
