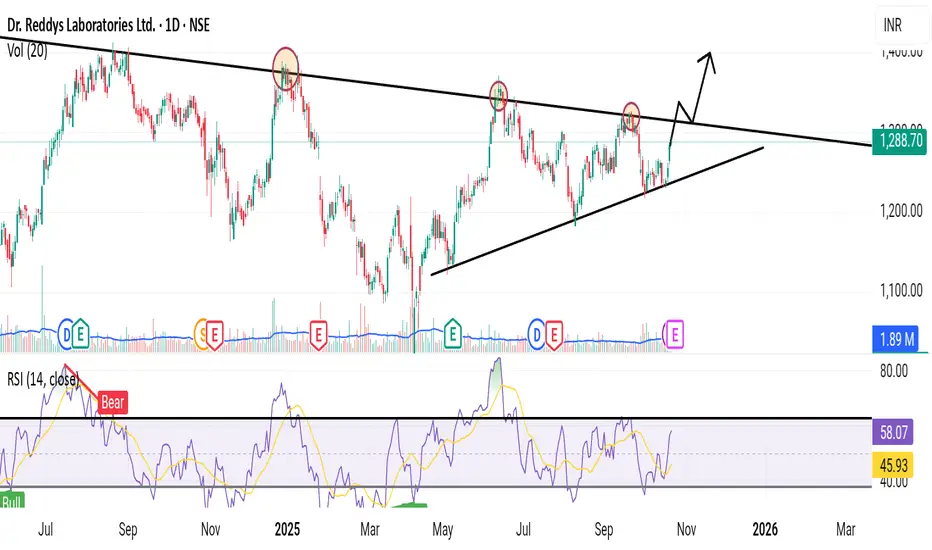
DRREDDY – Clean Channel Play Showing Buyers Defending SupportThis chart clearly shows price moving inside a well-defined descending channel.
Every time price reaches the upper trendline, sellers step in.
Every time price comes near the lower trendline, buyers defend the zone strongly.
Recently, price again touched the channel support and reacted sharply upw
Next report date
—
Report period
—
EPS estimate
—
Revenue estimate
—
0.664 EUR
618.19 M EUR
3.56 B EUR
832.36 M
About Dr. Reddy's Laboratories Ltd.
Sector
Industry
CEO
Erez Israeli
Website
Headquarters
Hyderabad
Founded
1984
IPO date
Jan 1, 1986
Identifiers
3
ISIN US2561352038
Dr. Reddy's Laboratories Ltd. engages in the manufacture and marketing of pharmaceutical products. It operates through the following segments: Global Generics, Pharmaceutical Services and Active Ingredients, and Others. The Global Generics segment consists of manufacturing and marketing of prescription and over-the-counter finished pharmaceutical products ready for consumption by the patient, marketed under a brand name or as generic finished dosages with therapeutic equivalence to branded formulations. The Pharmaceutical Services and Active Ingredients segment focuses on manufacturing and marketing of active pharmaceutical ingredients and intermediates, also known as API, which are the principal ingredients for finished pharmaceutical products. The Others segment includes the operations of the subsidiary of the company. The company was founded by Kallam Anji Reddy on February 24, 1984 and is headquartered in Hyderabad, India.
Related stocks

Dr Reddy’s Labs:Oversold Bounce Likely, But Structure Still WeakPrice has now reached a key demand / support zone , while RSI has slipped into oversold territory , a setup that often precedes a technical bounce . From a pure momentum perspective, a short-term relief rally looks likely .
However, the broader structure remains corrective . The stock continue

The difference between WD Gann cycle and Astro cycles(DRREDDY)Friends, when we were sharing the W.D. Gann time cycle charts with you, we observed several cycles, such as daily, weekly, monthly, and yearly cycles, and we saw good reversals and continuations in the patterns.
However, when we talk about Astro-Cycles, they are slightly different from normal cycle

Dr reddy short idea
Short Trade Setup Description
This setup is based on a clean break of the prior pivot low around the level ₹1,246.61, confirming bearish momentum. Defined short entry zone just below ₹1,241.09, aligning with a weekly supply zone from the higher timeframe.
The zone confluences with a weekly 50 EMA

Dr Reddy’s Labs – Perspective Beyond the NoiseDr Reddy’s Labs – Perspective Beyond the Noise
Recently, Dr Reddy’s Laboratories (DRL) was in focus after receiving a Notice of Non-Compliance from the Canadian regulator related to its filing for a generic version of Semaglutide (used in Type-2 diabetes and obesity treatment).
This development tr

Triangle pattern but wait for retest and sustained then some After break out wait co
After confirmation wait a good green candle and multi time frame analysis and multi confirmation point then volume r Si and pattern sustain b out then you can do it
Dr Reddy ,option buying(1260Ce)
Monthly price has crossed 20ema, currently price has entered one weekly tested supply zone.
Weekly all the supply zones are tested ,and currently price is moving from a point where previous upward rally was observed.
In daily time zone , one gap which was created by previous downfall i

DR REDDY - DIRT CHEAP - LONG LONG LONG Recently, DRL was in the news for receiving a “Notice of Non-Compliance” from the Canadian regulator concerning its filing for the generic version of Semaglutide (used for type-2 diabetes/obesity).
However, when one steps back and looks at the broader business picture, the fear looks over-blown:

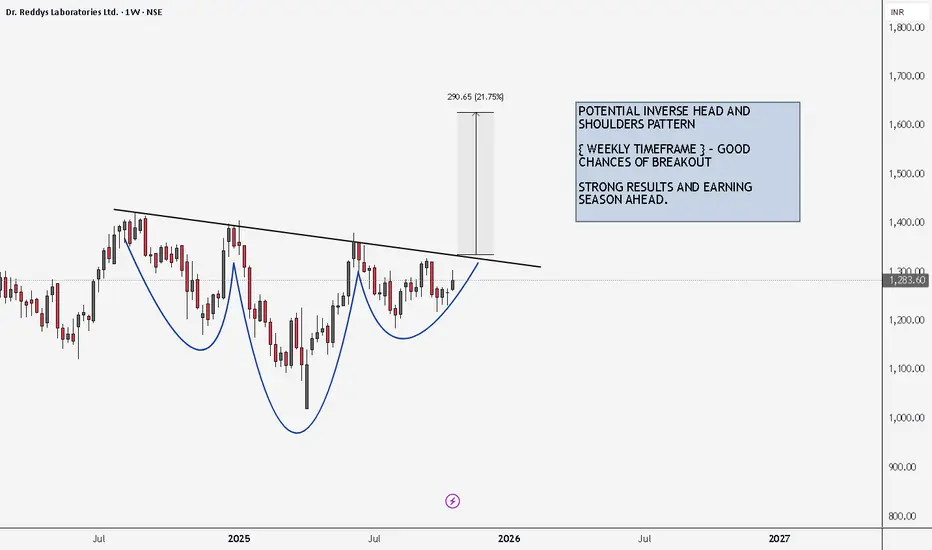
DRREDDY BREAKOUT CHART PATTERNPOTENTIAL INVERSE HEAD AND SHOULDERS PATTERN IN MAKING
{ WEEKLY TIMEFRAME } - GOOD CHANCES OF BREAKOUT
STRONG RESULTS AND EARNING SEASON AHEAD.
HOW TO TAKE POSITIONS IN THIS -
ENTRY LEVELS - 1 DAY CANDLE CLOSIGN ABOVE 1350
STOP LOSS LEVELS - AROUND 1150
TARGET 1 - 1500
TARGET 2 - 1650
TARGET
Traingle breakout in Dr. ReddyTriangle pattern breakout in Dr Reddy stock. A trade can be place for 1:1 target.
Note : For educational and paper trading purposes only.

See all ideas
An aggregate view of professional's ratings.
Neutral
SellBuy
Strong sellStrong buy
Strong sellSellNeutralBuyStrong buy
Neutral
SellBuy
Strong sellStrong buy
Strong sellSellNeutralBuyStrong buy
Neutral
SellBuy
Strong sellStrong buy
Strong sellSellNeutralBuyStrong buy
Displays a symbol's price movements over previous years to identify recurring trends.