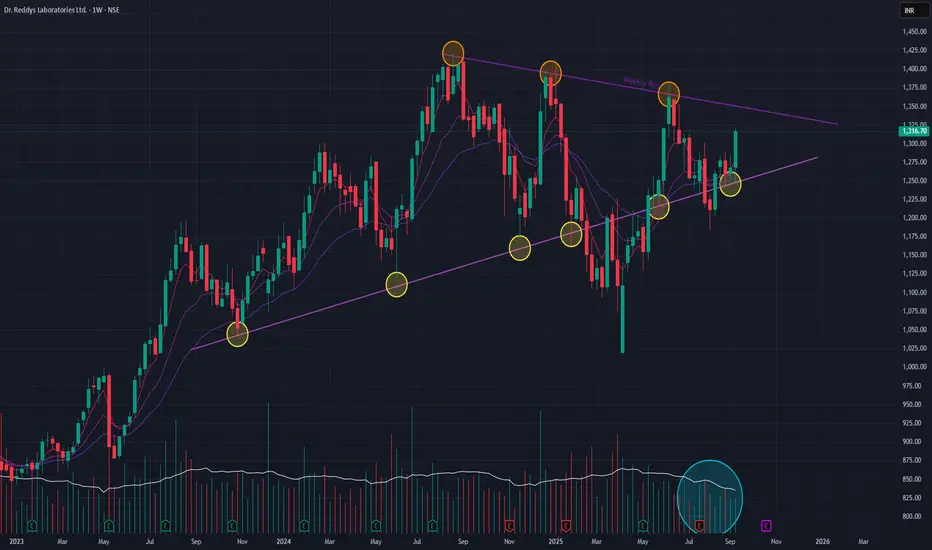
DRREDDY – Clean Channel Play Showing Buyers Defending SupportThis chart clearly shows price moving inside a well-defined descending channel.
Every time price reaches the upper trendline, sellers step in.
Every time price comes near the lower trendline, buyers defend the zone strongly.
Recently, price again touched the channel support and reacted sharply upward, showing demand is still active at this level.
This tells us two important things:
• The structure is still respected
• Buyers are not giving up the lower range
As long as price holds above this support area, the market is likely to continue oscillating inside the channel.
A real trend change will only come when price breaks and holds above the channel resistance.
Until then, this is pure range + structure behavior.
No indicators.
Just price reacting to levels.
Feel free to comment if you want a deeper breakdown.
What traders are saying

Dr Reddy’s Labs:Oversold Bounce Likely, But Structure Still WeakPrice has now reached a key demand / support zone , while RSI has slipped into oversold territory , a setup that often precedes a technical bounce . From a pure momentum perspective, a short-term relief rally looks likely .
However, the broader structure remains corrective . The stock continues to trade below two declining trendline resistances , and the 50-DMA is hovering near a bearish crossover with the 200-DMA , keeping the higher-timeframe bias under pressure.
The recent price action shows overlapping, choppy swings , best interpreted as multiple minor and higher-degree double corrections . Any bounce from current levels is therefore expected to be counter-trend and corrective in nature , not the start of a new uptrend.
Unless price can reclaim the falling resistance and sustain above key moving averages , the risk of a larger Wave Y decline toward the ~1,020 zone remains open. Rallies, if any, are likely to face supply and should be treated with caution.
In summary:
Oversold bounce likely from support
Bounce expected to be corrective
Trend still weak below resistances
Wave Y risk remains toward ~1,020
Disclaimer: This analysis is for educational purposes only and does not constitute investment advice. Please do your own research (DYOR) before making any trading decisions.

The difference between WD Gann cycle and Astro cycles(DRREDDY)Friends, when we were sharing the W.D. Gann time cycle charts with you, we observed several cycles, such as daily, weekly, monthly, and yearly cycles, and we saw good reversals and continuations in the patterns.
However, when we talk about Astro-Cycles, they are slightly different from normal cycles. They don't occur after a fixed period; they depend to some extent on when the astrological cycles change, and there can be a difference of a few days or months. For this, you need to use an astrological chart.
For example, I will use the chart from Dr Reddys Laboratories Ltd here.
Here you can see that every 5 years, the unfavorable Jupiter transits into a fire sign .But each fire sign has its own story.
We can also observe that when it starts moving from Sagittarius and reaches Aries (in 5 years), its speed increases, and therefore, when it moves from Aries towards Leo, it is in a very strong phase. After reaching a new peak in the next 5 years, it starts to decline again, and by the time it reaches Sagittarius (like points A/B/C), this 15-year cycle.
Now Jupiter has once again moved towards Aries and Leo. It remains to be seen what the next two years will be like for the pharmaceutical sector.

Dr reddy short idea
Short Trade Setup Description
This setup is based on a clean break of the prior pivot low around the level ₹1,246.61, confirming bearish momentum. Defined short entry zone just below ₹1,241.09, aligning with a weekly supply zone from the higher timeframe.
The zone confluences with a weekly 50 EMA also.
• 🔻 Entry: Short on retracement into the supply zone
• 🛡️ Stop Loss: Above the zone with a buffer of 15% DATR
• 🎯 Target: 1:3 Risk-Reward, aiming toward the ₹1,200 region
• ⚠️ Caution: Profit booking advised near the weekly demand zone and the orange-shaded caution area
This trade respects multi-timeframe confluence and risk management principles.

Dr Reddy’s Labs – Perspective Beyond the NoiseDr Reddy’s Labs – Perspective Beyond the Noise
Recently, Dr Reddy’s Laboratories (DRL) was in focus after receiving a Notice of Non-Compliance from the Canadian regulator related to its filing for a generic version of Semaglutide (used in Type-2 diabetes and obesity treatment).
This development triggered short-term selling pressure. However, stepping back and looking at the larger business picture, the market reaction appears overdone.
Here’s why:
The issue is geographically limited to Canada and linked to one specific product filing, not DRL’s overall regulatory standing.
Analysts indicate this could lead to a launch delay of ~8–12 months, rather than a rejection or long-term ban.
DRL’s core revenues are driven by US, India, Russia, and other global markets, supported by a diversified generics and API portfolio.
Pricing in a 10%+ global business impact due to this single regulatory event seems disproportionate to the actual risk.
From a business standpoint, DRL remains a top-tier pharma company with:
Strong global presence
Proven regulatory track record
Robust product pipeline
Integrated generics + API capabilities
Market Behavior Insight:
Recent price action suggests retail panic selling, while delivery volumes during consolidation remain elevated — a classic sign of quiet accumulation by long-term investors.
A similar regulatory-driven selloff in Sun Pharma a few months ago resulted in significant pain for short-term sellers, while patient capital was rewarded.
Outlook:
Consolidation is ongoing.
Prices may still see another 3–5% downside, which would improve risk-reward further.
For long-term investors, this phase looks more like disciplined accumulation rather than a reason for concern.
Conclusion:
Short-term regulatory noise has temporarily overshadowed a fundamentally strong business. For investors with a medium-to-long-term horizon, Dr Reddy’s appears well-positioned once sentiment normalizes.

Triangle pattern but wait for retest and sustained then some After break out wait co
After confirmation wait a good green candle and multi time frame analysis and multi confirmation point then volume r Si and pattern sustain b out then you can do it
Dr Reddy ,option buying(1260Ce)
Monthly price has crossed 20ema, currently price has entered one weekly tested supply zone.
Weekly all the supply zones are tested ,and currently price is moving from a point where previous upward rally was observed.
In daily time zone , one gap which was created by previous downfall is filled, a minor consolidation at current price is expected and then upmove is expected till 1300.
If price cross weekly 20ema , which give entry confirmation ,one can enter the trade
One can buy option and hold till 1300 price is touched and then can make an exit.

DR REDDY - DIRT CHEAP - LONG LONG LONG Recently, DRL was in the news for receiving a “Notice of Non-Compliance” from the Canadian regulator concerning its filing for the generic version of Semaglutide (used for type-2 diabetes/obesity).
However, when one steps back and looks at the broader business picture, the fear looks over-blown:
The setback is geographically narrow (Canada only) and tied to a specific product filing, not the entirety of DRL’s business.
As analysts note: the issue may delay the launch (8-12 months) in Canada, but it does not suggest a systemic failure across markets.
Given DRL’s diversified footprint (primarily US, India, Russia) and broad generics/active-pharma portfolio, the notion that this one regulatory hiccup could cost 10%+ of global market share appears highly unlikely.
In my view, this is a classic case of short-term regulatory noise being used to trigger retail panic selling — creating an opportunity for disciplined accumulation.
In short: DRL is a top-tier pharma company that checks all the boxes — strong global presence, robust pipeline, generics + API capabilities, and growth orientation. At current attractive price levels, this is a compelling time to build a position.
Similar situation happened in Sunpharma few months back and look what has happened there. retailers bled, smart money won!!

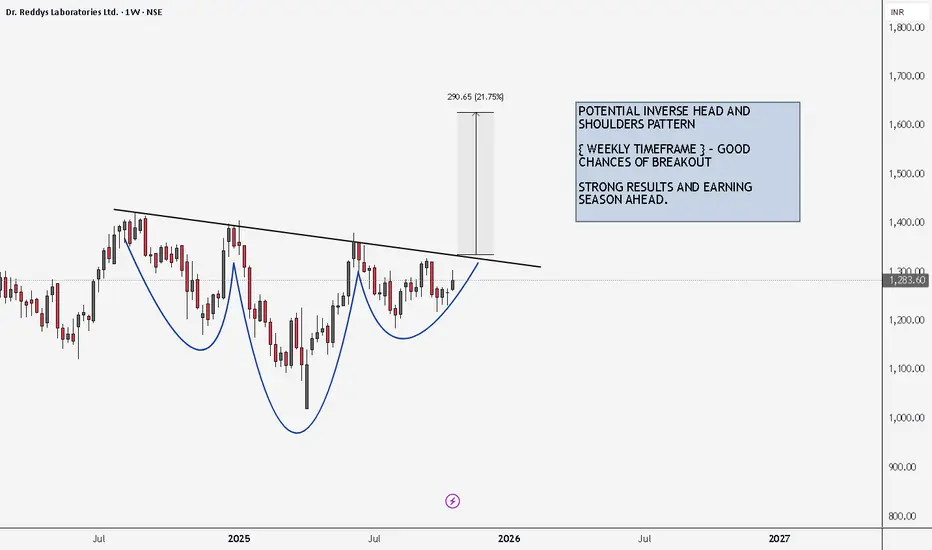
DRREDDY BREAKOUT CHART PATTERNPOTENTIAL INVERSE HEAD AND SHOULDERS PATTERN IN MAKING
{ WEEKLY TIMEFRAME } - GOOD CHANCES OF BREAKOUT
STRONG RESULTS AND EARNING SEASON AHEAD.
HOW TO TAKE POSITIONS IN THIS -
ENTRY LEVELS - 1 DAY CANDLE CLOSIGN ABOVE 1350
STOP LOSS LEVELS - AROUND 1150
TARGET 1 - 1500
TARGET 2 - 1650
TARGET 3 - 1750
Follow Levels Strictly and take positions at your own risk.
This is not an advice to buy or sell.
HAPPY TRADING
#MEDIUM TERM SWING TRADE
Traingle breakout in Dr. ReddyTriangle pattern breakout in Dr Reddy stock. A trade can be place for 1:1 target.
Note : For educational and paper trading purposes only.

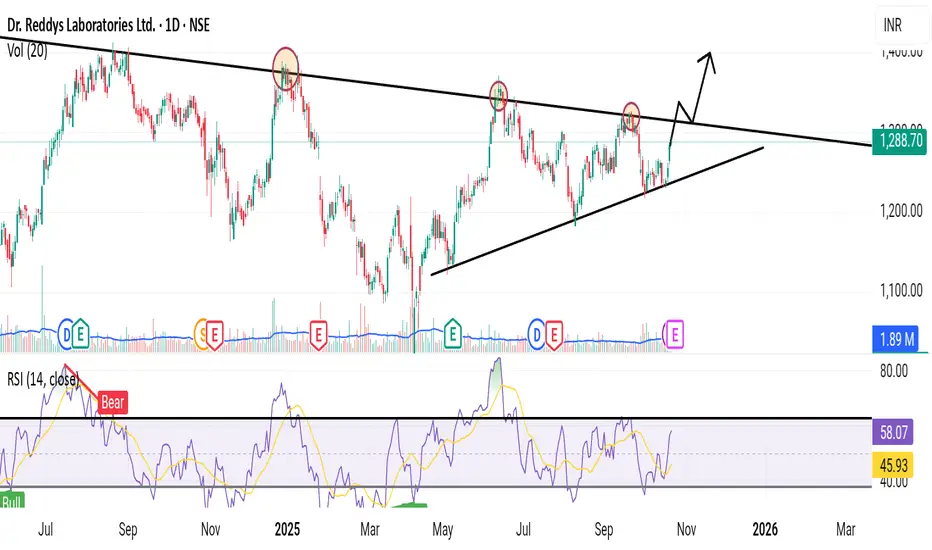
DRREDDY–Weekly Chart AnalysisThe stock is currently trading near ₹1,322 and is once again testing the long-term descending trendline resistance that has capped every rally since 2023. This resistance lies in the ₹1,345–₹1,348 zone and represents the key decision point for the next move.
Bullish Scenario (if breakout holds)
First method of calculation: ₹1,379.70, 1398.25, 1415-1421 → derived from prior swing highs.
Second method : ₹1,705→ based on a range of neckline to head of inverted head & shoulder. This is not a valid setup.
Third method : ₹1,472, 1,530, 1585→ calculated as fib extension levels.
Bearish Scenario (if rejection occurs)
Support: ₹1284, 1245, 1200 as immediate downside levels.
Momentum
RSI is around 58, showing a bullish curve without overbought conditions, suggesting momentum supports an upside breakout.

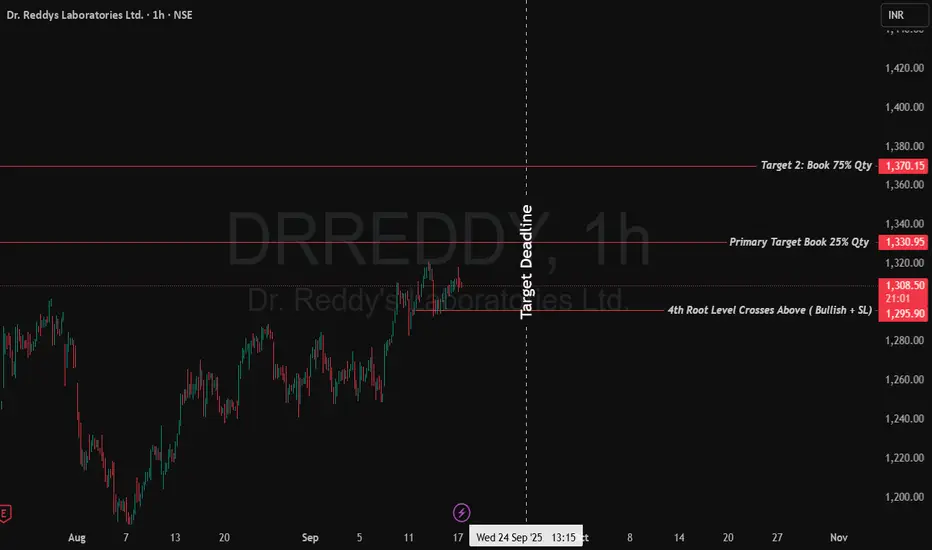
DRREDDY Bullish ProjectionMETHODOLOGY SUMMARY
Mathematical Transformation: Uses square root, cube root, and 4th root of price to identify natural support/resistance levels
Perfect Level Calculation: Round roots to nearest integer, then power back to create "perfect" mathematical anchors
Multi-Timeframe Analysis:
Square Root: Short-term cycle (days-weeks 3-5%)
Cube Root: Medium-term cycle (weeks-months 5-12%)
4th Root: Long-term structural cycle (months-quarters 12-18%)
Current DRREDDY Analysis:
Price: ₹1,305.70
4th Root Level: ₹1,296 ✅ CROSSED ABOVE
Cube Level: ₹1,331 (Next resistance)
Square Level: ₹1,296 (Confluence support)
TRADE SETUP
Entry Strategy:
Primary Entry: ₹1,305-1,310 (Current levels)
Add-on Entry: ₹1,296-1,300 (4th root support retest)
Targets:
Target 1: ₹1,331 (Cube level) - Book 25% quantity
Target 2: ₹1,370 (Next mathematical resistance) - Book 75% quantity
Extended Target: ₹2,401 (Next 4th power level)
Stop Loss:
Conservative: ₹1,285 (Below 4th root with buffer)
Aggressive: ₹1,276 (2% below 4th root level)
Risk-Reward:
R:R Ratio: 1:3.2 (to Target 2)
Position Size: 1-2% of portfolio risk
Why This Setup Works:
Mathematical Precision: 4th root levels act as major structural pivots derived from natural number theory
Cross Confirmation: Price breaking above ₹1,296 (4th root) suggests longer-term cycle shift
Volume Confluence: Breakout supported by institutional accumulation
Sector Strength: Pharma sector showing resilience
Key Levels Explanation:
₹1,296: 11^4 = 14,641 → ∜14,641 ≈ 11 → 11^4 = 1,296 (4th root anchor)
₹1,331: 11^3 = 1,331 (Cube resistance)
₹2,401: 7^4 = 2,401 (Next 4th power level up)
Market Psychology:
Below 4th Root: Institutional distribution phase
Above 4th Root: Institutional accumulation begins
Above Cube: Momentum acceleration phase
Invalidation Scenarios:
Break below ₹1,285 with volume
Failure to hold above ₹1,296 for 2+ sessions
Broader market correction below key supports
Time Frame: 2-4 weeks for Target 1, 6-8 weeks for Target 2
Disclaimer: lnkd.in
Dr. Reddy's (Weekly Timeframe) - Potential BreakOut?Dr. Reddy's Laboratories is currently in a phase of strategic consolidation. After a remarkable 93.63% uptrend that began in March 2022, the stock has settled into a well-defined triangle formation since August 2024. This pattern suggests a temporary equilibrium between buyers and sellers as the market digests previous gains.
The technical underpinnings remain constructive. The Positive Crossover (PCO) in the short-term EMAs provides a bullish undercurrent, and the resilience of key support levels indicates a solid foundation. The primary scenario we are monitoring is for a bullish continuation.
The key catalyst for the next leg up will be a volume-supported breakout above the triangle's resistance. Such a move would signal the end of the consolidation phase and could propel the stock towards retesting its All-Time High (ATH) . Investors should, however, remain watchful of the trading volume, as it will be the ultimate arbiter of the breakout's validity.
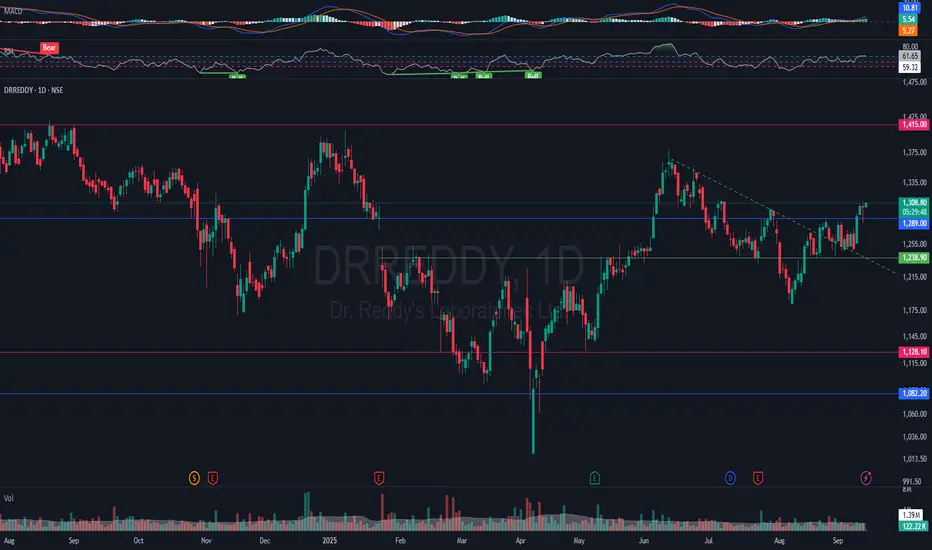
NSE:DRREDDY - Medium Term Swing Trade Opprotunity💹 Weekly Charts::
Price is consolidating around ₹1,300 after a bounce from the ₹1,150–1,180 zone (strong support zone).
Major resistance levels:
₹1,350–1,360 (R1 zone & trendline resistance)
₹1,415 (swing high and R2 zone)
Weekly RSI ~60, showing improving momentum but not yet overbought.
MACD histogram turning positive → suggests early signs of bullish momentum.
📊 Daily Charts::
Price recently broke above ₹1,244–1,250 zone, now retesting near ₹1,300–1,307 (R1 pivot resistance).
Next resistance: ₹1,350–1,360, followed by ₹1,410–1,415.
RSI ~65, bullish but near overbought → breakout confirmation is key.
ADX improving, +DI > -DI → trend strengthening.
Volume is moderate but picking up on green candles.
📈 Upside Potential::
If price sustains above ₹1,310, it can rally towards:
₹1,350–1,360 (short-term target)
₹1,415 (swing high)
Breakout above ₹1,415 on strong volume → opens potential towards ₹1,505–1,520 (weekly R2 & psychological round level).
📉 Downside / Risk Levels::
Strong support: ₹1,245–1,250 (previous breakout zone).
Deeper support: ₹1,180–1,200 (weekly support + P pivot).
If price breaks below ₹1,180, bearish momentum may resume towards ₹1,100.
✅ Conclusion
Worth initiating a long only if it sustains above ₹1,310 with good volume.
Upside potential: ~8–15% (₹1,360 to ₹1,415, and possibly ₹1,500).
Stop-loss: Below ₹1,245 on a closing basis (or tighter at ₹1,275 if risk needs to be managed).
This is a medium-term swing trade opportunity.
🛄 Disclaimer: This idea is posted solely for educational and learning purposes only and must not be construed as advice to buy or sell. Please consult your investment advisor before making any financial decision. Investments are subject to market risks.
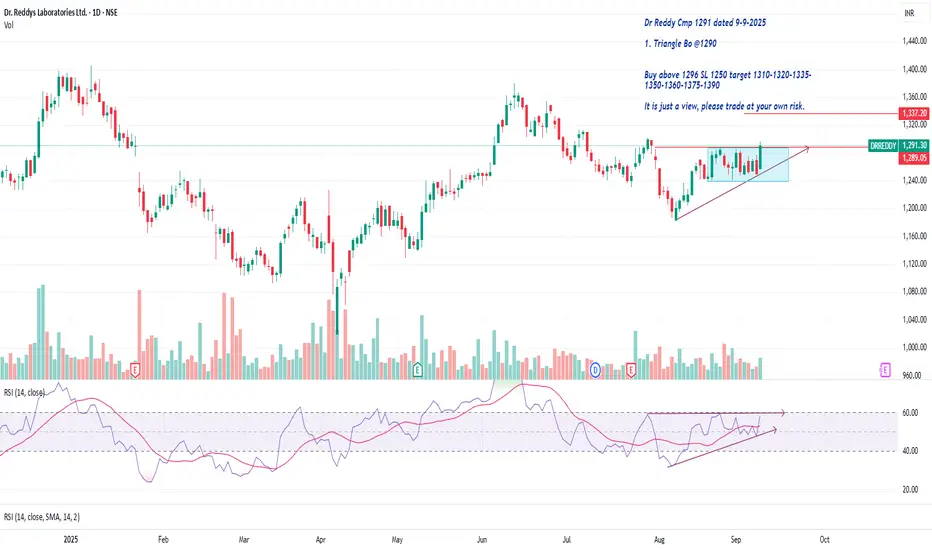
Dr Reddy Cmp 1291 Triangle BoDr Reddy Cmp 1291 dated 9-9-2025
1. Triangle Bo @1290
Buy above 1296 SL 1250 target 1310-1320-1335-
1350-1360-1375-1390
It is just a view, please trade at your own risk.
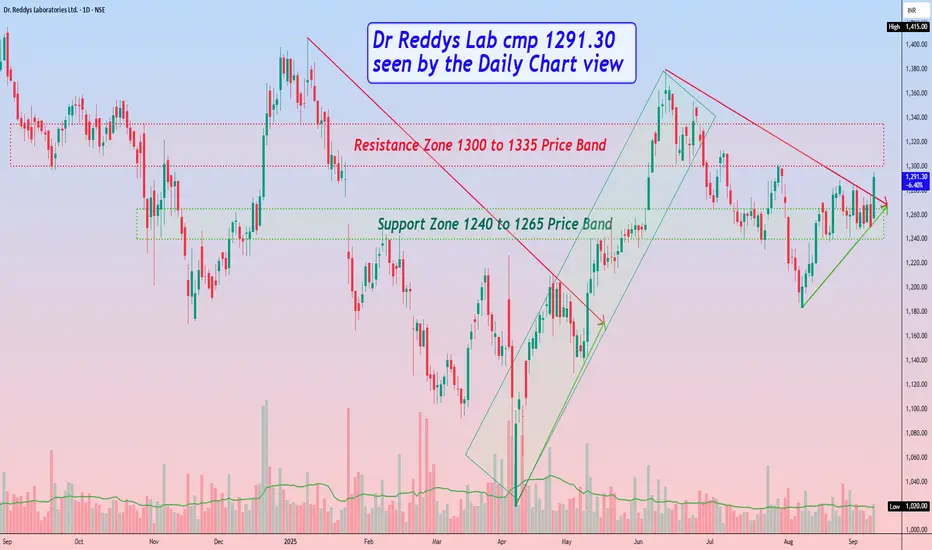
Dr Reddys Lab cmp 1291.30 by Daily Chart viewDr Reddys Lab cmp 1291.30 by Daily Chart view
- Support Zone 1240 to 1265 Price Band
- Resistance Zone 1300 to 1335 Price Band
- Breakout from Falling Resistance Trendline
- Bullish Rising Price Channel with intermittent highs and lows
- Recent history repeating by Breakout from Falling Resistance Trendline
- *Will we see a repeat Bullish Rising Price Channel with intermittent highs and lows*
DR REDDY VCPStock is forming a classic Volatility Contraction Pattern (VCP) on the daily chart. Each consolidation is getting tighter, showing supply absorption. Volume is drying up on pullbacks, while demand is visible on upswings.
✅ Strong pharma sector tailwinds (export + domestic)
✅ Macro catalysts: global drug shortages, and India’s role as a low-cost supplier
✅ Technicals: Breakout level around ₹1280/-, with stop below the last contraction low
If the breakout sustains with volume, could lead to a strong momentum move 🚀.

Dr. Reddy’s at Critical Zone – Double Top + Wedge Breakdown Dr. Reddy’s Laboratories Ltd. (1H Timeframe) –
Price Action & Structure
The stock is currently trading around ₹1,256, facing strong supply pressure from the ₹1,280–₹1,300 OrderBlock zone.
A Rising Wedge pattern was formed during the recent uptrend, which usually indicates trend exhaustion and potential reversal.
The wedge breakdown has already happened, and price failed to reclaim the upper boundary, confirming bearish intent.
A Double Top formation (Top1 & Top2) inside the OrderBlock further validates the sellers’ dominance.
Bearish Signals :-
Multiple Rejections at Order-Block: Sellers are strongly defending the ₹1,300 level.
Pattern Confirmation: Rising Wedge + Double Top = High probability bearish setup.
Momentum Shift: Lower highs and breakdown of trendline support show loss of bullish strength.
Volume Behavior: Increased volume on red candles signals institutional selling.
Trade Setup :-
Entry Zone: Breakdown confirmation below ₹1,260.
Stop Loss: Above ₹1,310 (order block invalidation).
Target 1: ₹1,210 (minor support).
Target 2: ₹1,152 (major support, projected move completion).
Risk–Reward Ratio: Around 1:2.5 to 1:3, favorable for swing positioning.
Key Insights for Traders:-
As long as the price stays below ₹1,290–1,300, short positions remain valid.
If buyers push price back above ₹1,310, bearish setup will get invalidated

DRREDDYDRREDDY - The stock is showing strength as it trades above all the key EMAs, indicating bullish momentum. A clear volume pickup is visible, adding confirmation to the move.
After a healthy retracement, price has broken above the immediate resistance zone. If it sustains this breakout, there’s a strong probability of an extended upside move.
The last hammer candle took solid support at the 200 EMA, which often acts as a major trend indicator, this bounce further validates the underlying strength.
Defining stop-loss and position sizing is crucial to manage downside risk, even in strong setups.
✅ If you like my analysis, please follow me as a token of appreciation :)
in.tradingview.com/u/SatpalS/
📌 For learning and educational purposes only, not a recommendation. Please consult your financial advisor before investing.

Dr Reddy : LongDR. Reddy’s Laboratories is showing a falling wedge pattern, which is typically considered a bullish reversal signal.
EMA Analysis: The price is trading above the 10, 20, and 200 EMAs, confirming the short-, medium-, and long-term bullish trend. A successful breakout above the descending trendline increases confidence in a sustained upward move. The recent crossover of 10 EMA above the 20 EMA further strengthens bullish momentum.
Volume Analysis: Bullish candles during the breakout phase are supported by rising volumes, indicating robust buying interest and solidifying the validity of the breakout. Volumes have reached above 430K, notably higher than previous averages, suggesting institutional participation.
RSI Analysis: The RSI is at 59.78, positioned securely above the midline (50) but still below any overbought condition (70). This level demonstrates enough momentum for further upside, leaving room for the rally to extend before any corrective move.
Trade Setup Recommendation
Parameter Value/Action
Entry: Above ₹1,285 after confirmation
Stop Loss: Below ₹1,265 (below breakout low/EMAs)
Target 1: ₹1,295–₹1,310 (near-term resistance)
Target 2: ₹1,340 (extension, if momentum holds)
RSI Condition: Hold as long as RSI remains < 70
Buy on confirmation above ₹1,285 with the given stop loss and targets; volumes and RSI both support entry at current levels.
If price closes below the 200 EMA or RSI falls below 50, reconsider the bullish trade. This setup leverages strong technical signals and is suitable for short- to medium-term trading.
The analysis and trade setup provided above are for educational purposes only and do not constitute investment advice. Always conduct independent research, consider personal financial circumstances, and consult with a qualified financial advisor before making trading or investment decisions. Trading stocks and financial instruments involve risks, including the possibility of losing capital, and past performance does not guarantee future results

Drreddy is forming a diamond pattern Dr. Reddy’s
⚖️ Diamond/symmetrical triangle pattern visible.
✅ EMAs rising on daily, RSI ~60.
🚩 Weekly chart still consolidating → needs close above ₹1280.
🎯 Target zones: ~₹1317
, ₹1359, ₹1400.
🛑 Stop-loss: ₹1255.
Macro tailwinds: weak dollar, lower inflation, stable growth → supportive for emerging markets and defensive/healthcare plays.

Can Be A good buy , Head and shoulder formedCan Be A good buy , Head and shoulder formed then Resistance Broken Then retested now Volume is spiked Do your Own analysis Then Buy

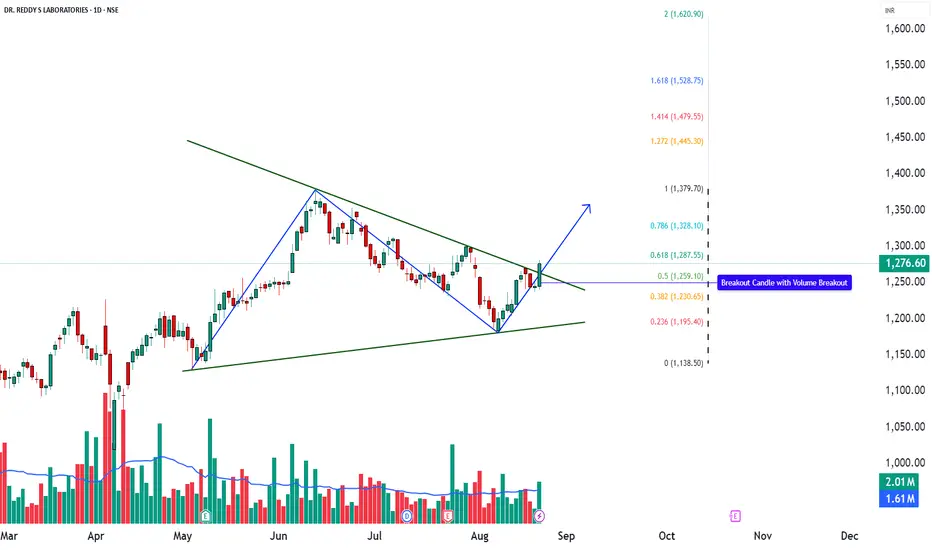
DRREDDY – Triangle Breakout in Play📊 DRREDDY – Technical & Educational Snapshot
Ticker: NSE: DRREDDY | Sector: 💊 Pharma
CMP: ₹1,276.60 ▲ (+2.51% | 22 Aug 2025)
Rating (for learning purpose): ⭐⭐⭐⭐ (Moderately Bullish)
Pattern Observed: 📈 Triangle Breakout with Volume Confirmation
📰 Sentiment Analysis
👉 Overall Sentiment: Positive ✅
• Bullish Drivers: Breakout from triangle formation, Morning Star on daily, bullish PinBar on monthly, strong Q1 results with revenue & profit growth, and renewed interest in pharma sector due to healthcare demand.
• Risks (Bearish Case): Any failure to sustain above ₹1,250 or renewed pressure from regulatory issues/patent challenges could trigger pullbacks.
• Short-term Outlook: Strong breakout with momentum, but some cooling-off likely due to Stochastic overbought levels.
• Long-term Outlook: Positive — consistent financial performance, strong pharma pipeline, and robust technical structure suggest higher upside potential.
📊 Technical Snapshot
DRREDDY has broken out from a triangle formation, supported by a Morning Star candlestick on the daily timeframe and a Bullish PinBar on the monthly chart — both strong reversal cues. A bullish Supertrend, RSI breakout, and Bollinger Band expansion signal renewed buying interest. Volume above the 20-SMA average further validates the breakout, suggesting institutional participation. While momentum is strong, Stochastic is near overbought, which means short-term pullbacks cannot be ruled out. However, as long as price sustains above key support zones, the broader trend bias remains upward.
📊 Volume Check
🔹 Current Volume: 2.01M
🔹 20 SMA Volume: 1.61M ✅
💥 Above-average participation → confirms breakout reliability with demand expansion.
💡 Interpretation: Higher-than-average volumes in breakout zones indicate broader market participation and improve the chances of trend continuation.
💡 Learnings
Breakouts from consolidation patterns like triangles tend to extend into trending moves when supported by momentum indicators (RSI + MACD). Elevated CCI levels indicate consistent buying pressure, but traders should remain alert to possible short pullbacks, especially when Stochastic enters the overbought zone. Defining a stop-loss and invalidation level is key for disciplined trade management.
📌 Key Levels
Resistance: 1292 | 1308 | 1334
Support: 1251 | 1225 | 1209
Fibonacci Levels: 1138.50 | 1195.40 | 1230.65 | 1259.10 | 1287.55 | 1328.10 | 1379.70
🎯 STWP Learning Reference
• Observed breakout zone: ~1281.8
• Key support level: ~1236
• Upside reference zones (if momentum continues): 1327 | 1372
• Pullback watch zone: 1224–1230 (where demand has earlier emerged)
• Invalidation reference: Below 1195 (trend may weaken)
⚠️ Disclaimer – Please Read Carefully
The information shared here is meant purely for learning and awareness. It is not a buy or sell recommendation and should not be taken as investment advice. I am not a SEBI-registered investment advisor, and all views expressed are based on personal study, chart patterns, and publicly available market data.
Trading — whether in stocks or options — carries risk. Markets can move unexpectedly, and losses can sometimes exceed the money you have invested. Past performance or past setups do not guarantee future results.
If you are a beginner, treat this as a guide to understand how the market works — practice on paper trades before risking real money. If you are experienced, always assess your own risk, position sizing, and strategy suitability before entering trades.
Consult a SEBI-registered financial advisor before making any real trading decision. By engaging with this content, you acknowledge full responsibility for your trades and investments.
💬 Found this useful?
🔼 Give this post a Boost to help more traders discover clean, structured learning.
✍️ Drop your thoughts, questions, or setups in the comments — let’s grow together!
🔁 Share with fellow traders and beginners to spread awareness.
✅ Follow simpletradewithpatience for beginner-friendly setups, price action insights & disciplined trading content.
🚀 Stay Calm. Stay Clean. Trade With Patience.
Trade Smart | Learn Zones | Be Self-Reliant 📊