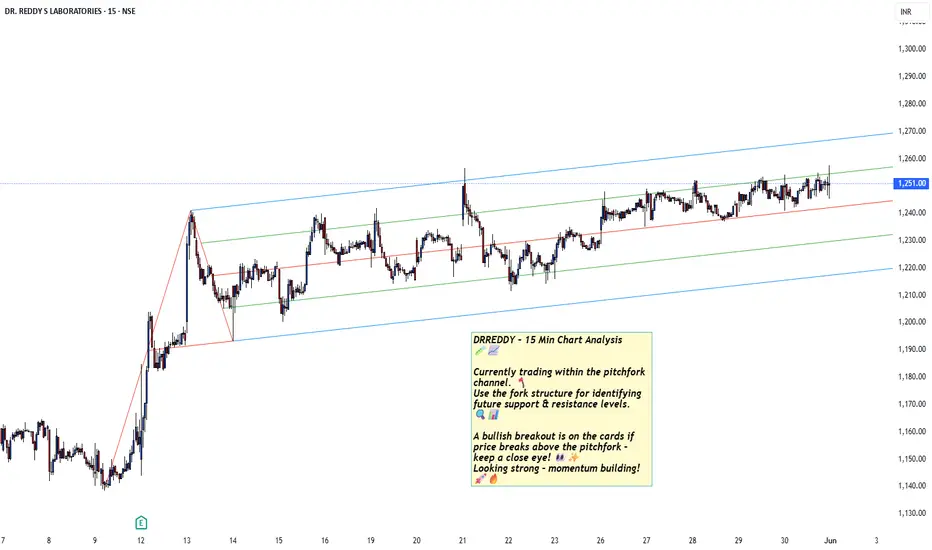
DRREDDY – 15 Min Chart AnalysisDRREDDY – 15 Min Chart Analysis 🧪📈
Currently trading within the pitchfork channel. 🪓
Use the fork structure for identifying future support & resistance levels. 🔍📊
A bullish breakout is on the cards if price breaks above the pitchfork – keep a close eye! 👀✨
Looking strong – momentum building! 🚀🔥
Trade ideas
DRREDDY crossed below the crescent moon channelDRREDDY has broken down the crescent moon channel that I was following since Aug 2015.
Market is also hyper bearish. Look for short opportunities.
Target 1: 1170
Add more short positions on close below 1170.

Dr Reddy's Trade idea Dr Reddy's
View bullish
Technical breakout of supply zone
Expecting good upside move in coming days

DR REDDY - Cup & Handle bullish pattern- DR REDDY - Cup & Handle bullish pattern
- Medium risk-reward ratio
- Stock has retraced in current market selling spree

DR REDDY GAP DOWN IN 3rd WAVEwe clearly see GAP DOWN in 3rd wave of the 5 waves of the C wave. What does this indicates? A fall to complete the 3rd wave was quick. we are done with 3rd wave and in the process to complete the 4th wave.
Possibilities:
*) Downward it can go to 1148-1160 to complete the 5th wave.
*) It may close the 3rd wave Gap before resuming its downward Journey to complete the 4th wave. (Less Probability)
In Either case I would prefer not to enter any new position and wait for the right opportunity.
Disclaimer: I am not SEBI registered Member. This is Strictly for educational purpose only.

Breakdown on DR.Reddys Sell idea on Dr Reddy Lab. as an bearing Flag and Pole Pattern is in making and if the support breaks its a sell as can be seen in CHART

Dr. Reddy's: Cypher Pattern and Support Level AnalysisDr. Reddy's Laboratories has formed a cypher pattern and is finding support around the ₹1200 level, after a recent 15% fall. Dr. Reddy's shares are trading at ₹1250.20, reflecting a 1.85% change for the day1. The company exhibits low volatility compared to the market, with a six-month beta of 0.2055

#drreddy, Make or Break levelMake or break level. Given respect to resistance after bad results. All eye on budget. One more bad news Investors will be in hurry to drop from this

DR Reddy's - Two Possible ScenarioCurrently Stock in mild down trend to sideways
Area 1310 - 1330 become crucial
Any close above 1330 will take the stock back to 1400 & higher
Any close below 1310 will make it bearish for quite some time
Then it will give an opportunity to sell on pull back
Downside targets of 1270 & 1250 may follow
Will wait for close in both the scenario

VIEW ON DRREDDYBreakout on the monthly chart
Stock has outperformed pharma sector this month
Stock has formed strong green candle after 3 months consecutive red candles
Target 1650/1850
Stop loss 1220
I am just representing my views
For educational purpose only.

Resilient Sector Stock and breakout of important resistance Rational:
1. Pharma sector is one of the resilient sector in current market fall.
2. Returning to this price level after 2 months. For the third time at this level and trying to breach the level for last 3 days.
3. Entry at the breakout of this level with SL of around 4.4%. Entry : 1370; SL: 1310; Target: Trail as per 9 EMA.

Dr. Reddy's Laboratories LtdThe daily chart of Dr. Reddy's Laboratories Ltd (DRREDDY) on the NSE indicates a bullish setup, with the price trading above the 50-day SMA (1268.29), 200-day SMA (1275.84), and 21-day EMA (1261.02). A downward trendline highlights resistance near 1368, while an upward trendline indicates accumulation with higher lows. The RSI at 69.74 suggests strong momentum, and the MACD shows a bullish crossover, confirming upward momentum. Aggressive traders can consider entering on a breakout above 1368, targeting 1450–1500, with a stop-loss below 1330. Conservative traders may wait for a pullback to the 1275–1285 support zone (near the 200-day SMA) or the upward trendline around 1300–1310, targeting 1380–1420, with a stop-loss below 1270. Volume is rising, supporting the recent price action.

VIEW ON DRREDDYBreakout on the stock
After a fall from high, stock has taken a support near 1150 levels
Target 1400/1500
Stop loss 1280
I am just representing my views
For educational purpose only.

DR. REDDY Strong Candle FormationNSE:DRREDDY made a strong candle today Crossing Key Levels with volumes and closing above 100 DEMA.
MACD Still Showing a BUY Signal, I have drawn support and resistance levels. If it breaks the resistance level it Will Cross ATM. Small Quantity can be added at the current Level for a Swing.
📌Thank you for exploring my idea! I hope you found it valuable.
🙏FLLOW for more
👍BOOST if useful
✍️COMMENT Below your views.
Meanwhile, check out my other stock ideas below until this trade is activated. I would love your feedback.
Disclaimer: This analysis is intended solely for informational and educational purposes and should not be interpreted as financial advice. It is advisable to consult a qualified financial advisor or conduct thorough research before making investment decisions.

19th decemeber dr reddy for intradaydr reddy has shown a breakout on daily charts
going by that , it has also received brokerages thumbsup
today buy in zone 1270-1275 with stoploss at 1254
target for intraday will be 1300-1320 ++
today market is gapdown but i am convinced it will g up

Dr Reddys Laboratories Ltd view for Intraday 17th Dec #DRREDDY
Dr Reddys Laboratories Ltd view for Intraday 17th Dec #DRREDDY
Resistance 1280 Watching above 1283 for upside movement..
. Support area 1250 Below 1265 ignoring upside momentum for intraday
Support 1250 Watching below 1247 or downside movement...
Resistance area 1280
Above 1265 ignoring downside move for intraday
Charts for Educational purposes only.
Please follow strict stop loss and risk reward if you follow the level.
Thanks,

16th december intra cum swing dr reddydr reddy is showing breakout on daily chart.
as per trendline , it can move towards second trendline which is at 1280
above 1280 big breakout , as of now for intr tgt woould be 1264 1274 1280
for swing tgt 1280
sl would be 1242 small sl

The directional V shaped signal Dr Reddy CMP 1246
Fib Analysis- I have done fib analysis on the three major swings in this counter. The first swing correction halted at 61.8%. this was an indication that the bull trend was weakening.
The second swing correction halted at 50% taken from top and bottom. this was an indication that the stock was not expanding.
The 3rd swing correction halted at 38.2% the grid forming from top and bottom of the swing.
This swing has something more it is a directional signal which is an inverted V.
Hence to me the uptrend is over. Since the stock has halted at support we will witness a rally, but this rally will the last opportunity to exit this counter.

Drreddys bullish VIEW
Drreddys bullish VIEW
Dr reddy is on Trendline ,Target will be in coming days
Targets: Greenline
T1: 1240
T2: 1250
T3: 1260
Imp. Note: This analysis is provided for informational purposes only and does not constitute a direct recommendation to buy or sell stocks. Investors should conduct their own research and consult with financial advisors before making any investment decisions, as market conditions and individual circumstances may vary.
Market Risk: However, it's important to acknowledge the inherent risks

We can plan for longs in DRREDDY for the target of 6%As I have explained in the video there is a demand zone from where DRREDDY can take support and make a move of 6% towards the upside

Dr Reddy parallel channel view- ascending parallel channel
- touched the bottom line
- may consider when the reversal candle is form
- during market correction this stock reached the fib retracement 61.8 at the level of 1235 from its all-time heigh.
This analysis is my own idea.
I don't recommend taking trade based on this idea.
consult your SEBI registered adviser to Know the market risk before trade.
in.tradingview.com

Dr Reddy is Ready to fly in blue sky, Short term Trading Idea .I hope you all will be doing good in your life and your trading as well. I have brought a stock which has formed a pull back pattern and taken support at previous breakout zone. Stock name is Dr. Reddy's Laboratories Ltd and it is a leading India-based pharmaceutical company which offers a portfolio of products and services, including Active Pharmaceutical Ingredients (APIs), Custom Pharmaceutical services (CPS), generics, biosimilars and differentiated formulations.
Stock is good for short term trading idea as it has taken support in the previous breakout zone. Stock is good for long term investing as well. This can be best SIP stock to invest and get handsome returns in future.
Market Cap
₹ 1,09,439 Cr.
Current Price
₹ 1,312
High / Low
₹ 1,421 / 1,041
Stock P/E
19.7
Book Value
₹ 339
Dividend Yield
0.61 %
ROCE
26.5 %
ROE
21.4 %
Face Value
₹ 1.00
Industry PE
34.5
Debt
₹ 2,002 Cr.
EPS
₹ 66.7
Promoter holding
26.6 %
Intrinsic Value
₹ 1,033
Pledged percentage
0.00 %
EVEBITDA
12.3
Change in Prom Hold
-0.01 %
Profit Var 5Yrs
24.4 %
Sales growth 5Years
12.6 %
Return over 5years
18.9 %
Debt to equity
0.07
Net profit
₹ 5,565 Cr.
ROE 5Yr
16.7 %
Profit growth
17.8 %
Earnings yield
6.77 %
PEG Ratio
0.81
Disclaimer:- Please always do your own analysis or consult with your financial advisor before taking any kind of trades.
Dear traders, If you like my work then do not forget to hit like and follow me, and guy's let me know what do you think about this idea in comment box, i would be love to reply all of you guy's.
Thankyou.

DRREDDY gearing up for 7000DRREDDY CMP 6754
Harmonic Pattern and the wave counts pointing towards 7K
