Trade ideas

DR reddy look promising to go LONGDr reddy having strong support around 4650 and showing sign of swing reversal and try to sustain above this level and having hurdle around 5000 breakout of 5000 will definitely lift the stock to 5600.
Initiate buy in Dr reddy for target of 5200 and 5600 with stoploss of 4657.

#DRREDDY FOR 5200A CLASSIC BULLISH FALLING WEDGE PATTERN WITH PREVIOUS SWING TOP ACTING AS A GOOD SUPPORT DEFINING CHANGE OF POLARITY. REDDY IS STANDING AT A VERY GOOD RR FOR TGTS OF FALLING WEDGE THAT COMES AROUND ALL TIME HIGH.
LONG DRREDDY WITH CLOSING BASIS SL 4760 FOR TGTS 5000/5200/5500


DrReddy - Last chance to buy before another runDrReddy is getting support at 0.618 fib level and the traded volume is also decreasing. In 1-2 days we may see a spike in volume and which will start another bull run. It is also forming a Flag and Pole pattern. If Flag and Pole breakout happens than Target is 5900++ in coming weeks.


heading 6200 ++I am looking for levels of 6200 + in DRL. 4000 on daily closing basis is my SL . 4500-4550 is the level to enter in stock.
Disc : It's not an investment advise to buy or sell

Dr Reddys - Sputnik V breakoutWith testing having started for the Sputnik V and high expectations from the already sucessful testing in Russia, Dr Reddy could become a global supplier for the product post its trails. This is a company with very good USFDA compliance and a future pipeline of excellent products.
Long above 4990. SL at 4800. (A little deeper than usual but its a positional play)

Long for 15-20% gain in short timeRepetitive step and ladder pattern.
Will history repeat itself !!!
don't miss
For educational purpose.


DRREDDY, Long for 20% gaincorrective wave is over, bouncinf off 0.618 fib level
first target is All time high, followed by 6000+ (next targets are marked on chart)
SL: close below recent low

Dr Reddy positional buy opportunityBull Flag pattern formation and breakout
Buy at CMP 4900-4930
Sell Target 5830
Stop loss 4650
Profit potential of 18% approximately
Trend continuation
Nice risk to reward on offer


Channel Pattern broken DRREDDYBuy only above 3850 with a 60 pt stop loss.
Kindly like and follow for more trading ideas.

DrReddy - Trendline trade1. The Previous uptrend happened with Incremental Volume
2. The correction happened in low volume
3. Now it's in a support area 4650.
4. It should break the downward slanting trendline with high volume.
Current Close - 4670
Buy above 4950
Stop Loss - 4540
Target - 5502/6000
This idea is invalid once it breaks the support zone and closes below i.e. 4500


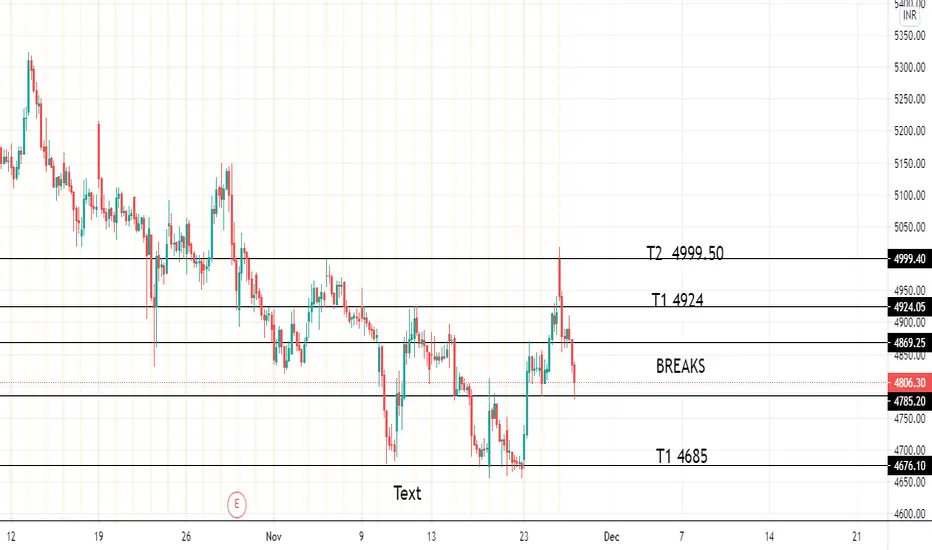
Breakout from falling Wedge Pattern in Dr ReddyThere is a breakout from falling wedge pattern in Dr Reddy on hourly chart today. Volumes of 3X (Compared to 10 day EMA) were seen on the breakout candle.
After the breakout, Dr Reddy is now coming back to test the trend line.
If we observe the daily chart bulls ahas made an attempt on 19/11/2020 for breakout but was unsuccessful. Today bulls were successful in taking the prices higher.
We can initiate buy between 4810-4830 and targets would be 4999/5080/5200.
SL would be very small i.e. below the low of breakout candle i.e. 4770.
Risk/Reward will be pretty good around 2.7 if trade works out.

Dr Reddy - Flag it for profitDr. Reddy's is trending up in Higher Time Frames. After recent explosive move, stock is consolidating. Thereby forming a Flag formation in Daily Charts. CMP is coinciding with .618 Fib Retracement.
Trade Set Up. Enter @ CMP(4670) SL : 2% from Entry. Target 1 : 4900 Target 2: 5025.
Its offering 3:1 RR

once agains after failing twiceDrreddy give decent bounce from support and forming bullish wedge. good to get in here again

DRREDDY Levels for 23-NOV-20(Intraday) Buy above 4690 for 15,40,70++
Sell below 4655 for 15,40,70++
Can comment or ping me for any query
All views for Educational purpose, Trade at your own risk
