$TIA dropped ~86% from our short entry zone!LSE:TIA Massive Profit Update – Short Call Hit Perfectly 🔥
LSE:TIA dropped ~86% from our short entry zone!
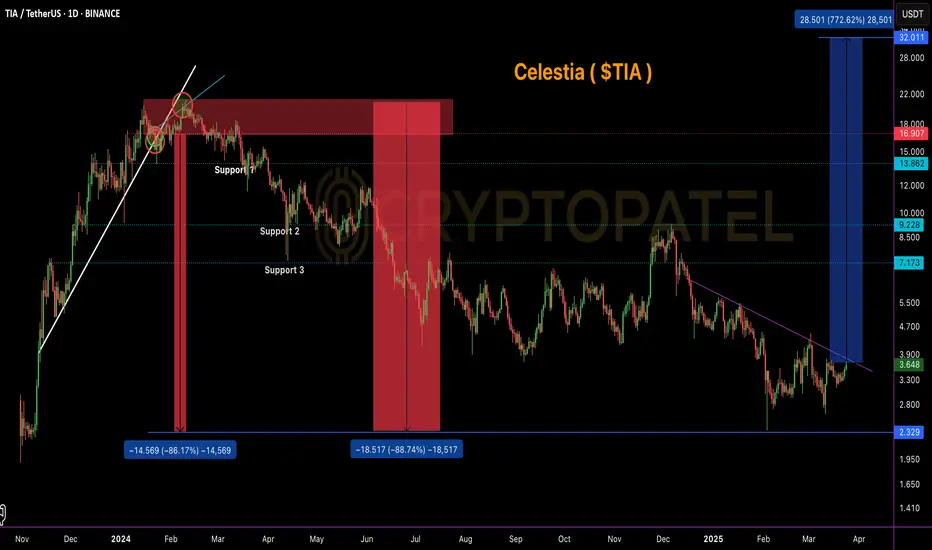
We shared a short setup for LSE:TIA at the $17–$20 range. After a textbook retest rejection, price began its downward move and has now dumped all the way to $2.36, hitting a massive -86%
Related pairs
TIAUSDT: A Bullish Breakout or False Hope? Key Levels to WatchYello, Paradisers! Are we about to witness a massive bullish move in TIAUSDT, or will it break down and catch traders off guard? 😱 Let's break it down.
💎TIAUSDT has broken out of its descending channel and is in the process of forming a W pattern, which is increasing the probability of a bullish mo

TIA/USDT 80% down from My Analysis#Celestia (TIA/USDT) Profit Update:
I alerted you when LSE:TIA was trading at its peak/ATH and advised selling at $16.50+. It went up to $20 for a bearish retest and then experienced a hard dump, now down 80% from my levels. Hope you earned or saved money!
Profit Targets:
TP1: $13.86 ✅
TP2: $9.

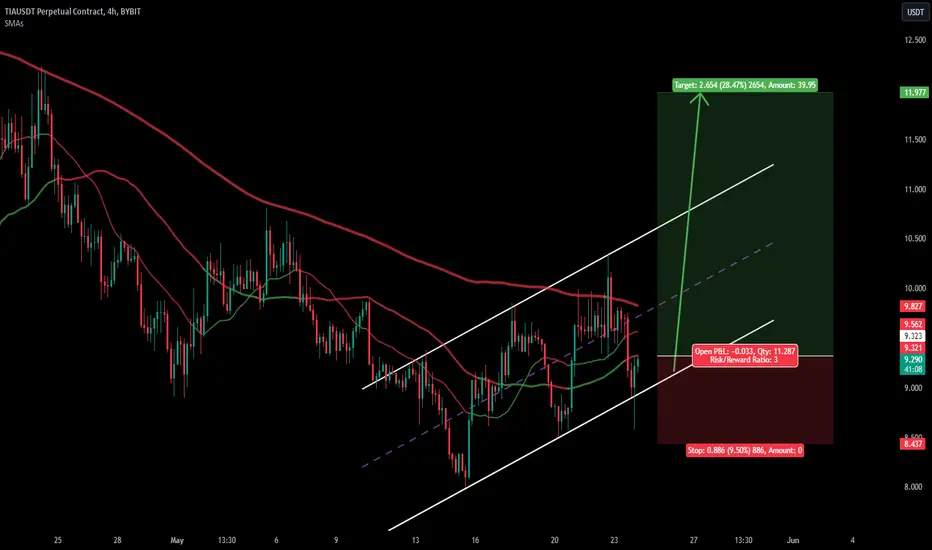
TIAUSDT bullish on 4H chart for 1:3 ratioBased on the provided data, the current support and resistance levels for TIA against USDT are as follows:
Support Level: $8.429 (SL)
Resistance Level: $11.98 (Target)
These levels are derived from the latest trendlines, parallel channel support and resistance prices. The support level indicates a
TIAUSDT: Gears up to break free from its descending channel! 🌊💎 Paradisers, #TIA could initiate a bullish move if the price bounces and breaks out of the descending channel.
💎If #TIAUSDT bounces and breaks through the descending channel, display a Change of Character (CHoCH) towards a bullish market structure, this would enhance the likelihood of a bullish tr

TIAUSDT Long: Eyeing Steady Gains to Resistance LevelsI'm initiating a long position on TIAUSDT as the setup shows potential for an upward move. Currently, the price is hovering above the entry point I've identified at 18.1200 USDT, with the
RSI indicating bullish divergence points that support my decision to go long.
I've set my first target (TP1)

TIA/USDT Ready for -50% Dump ?#Celestia Dump Alert
➡️ LSE:TIA bullish trend has been broken, and it's now testing the $16.50 support level.
➡️ I am Expecting -50% Dump From This Level.
If you're looking to enter the market, $7 could be a good entry point.
Support: $13.86, $9.82, $7.10
Resistance: $17
Note: #TIA/USDT Pumpe

Pullback is the chance to join | Long BiasOn 1h TF
TIA is pulling back to support zone around $17.2
This level is supported by Ascending Trend Line and Previous High
Wait for rejection around this level


CELESTIA (TIA) ATH AT $8 COULD LEAD TO DOUBLE-DIGIT CORRECTIONS
Celestia (TIA) price shows no signs of stopping
Although I might look like it has breached the rising wedge, there will be one last upswing that collects the liquidity and form a local top.
This move will be a great opportunity to short TIA, provided BTC also shows signs of top formation.

See all ideas
Summarizing what the indicators are suggesting.
Oscillators
Neutral
SellBuy
Strong sellStrong buy
Strong sellSellNeutralBuyStrong buy
Oscillators
Neutral
SellBuy
Strong sellStrong buy
Strong sellSellNeutralBuyStrong buy
Summary
Neutral
SellBuy
Strong sellStrong buy
Strong sellSellNeutralBuyStrong buy
Summary
Neutral
SellBuy
Strong sellStrong buy
Strong sellSellNeutralBuyStrong buy
Summary
Neutral
SellBuy
Strong sellStrong buy
Strong sellSellNeutralBuyStrong buy
Moving Averages
Neutral
SellBuy
Strong sellStrong buy
Strong sellSellNeutralBuyStrong buy
Moving Averages
Neutral
SellBuy
Strong sellStrong buy
Strong sellSellNeutralBuyStrong buy
Displays a symbol's price movements over previous years to identify recurring trends.
Frequently Asked Questions
The current price of TIA / UST (TIA) is 1.07080000 USDT — it has fallen −7.28% in the past 24 hours. Try placing this info into the context by checking out what coins are also gaining and losing at the moment and seeing TIA price chart.
TIA / UST price has fallen by −26.06% over the last week, its month performance shows a −38.70% decrease, and as for the last year, TIA / UST has decreased by −82.80%. See more dynamics on TIA price chart.
Keep track of coins' changes with our Crypto Coins Heatmap.
Keep track of coins' changes with our Crypto Coins Heatmap.
TIA / UST (TIA) reached its highest price on Aug 11, 2024 — it amounted to 7,777.00000000 USDT. Find more insights on the TIA price chart.
See the list of crypto gainers and choose what best fits your strategy.
See the list of crypto gainers and choose what best fits your strategy.
TIA / UST (TIA) reached the lowest price of 0.10000000 USDT on Nov 26, 2024. View more TIA / UST dynamics on the price chart.
See the list of crypto losers to find unexpected opportunities.
See the list of crypto losers to find unexpected opportunities.
The safest choice when buying TIA is to go to a well-known crypto exchange. Some of the popular names are Binance, Coinbase, Kraken. But you'll have to find a reliable broker and create an account first. You can trade TIA right from TradingView charts — just choose a broker and connect to your account.
Crypto markets are famous for their volatility, so one should study all the available stats before adding crypto assets to their portfolio. Very often it's technical analysis that comes in handy. We prepared technical ratings for TIA / UST (TIA): today its technical analysis shows the strong sell signal, and according to the 1 week rating TIA shows the sell signal. And you'd better dig deeper and study 1 month rating too — it's sell. Find inspiration in TIA / UST trading ideas and keep track of what's moving crypto markets with our crypto news feed.
TIA / UST (TIA) is just as reliable as any other crypto asset — this corner of the world market is highly volatile. Today, for instance, TIA / UST is estimated as 9.91% volatile. The only thing it means is that you must prepare and examine all available information before making a decision. And if you're not sure about TIA / UST, you can find more inspiration in our curated watchlists.
You can discuss TIA / UST (TIA) with other users in our public chats, Minds or in the comments to Ideas.