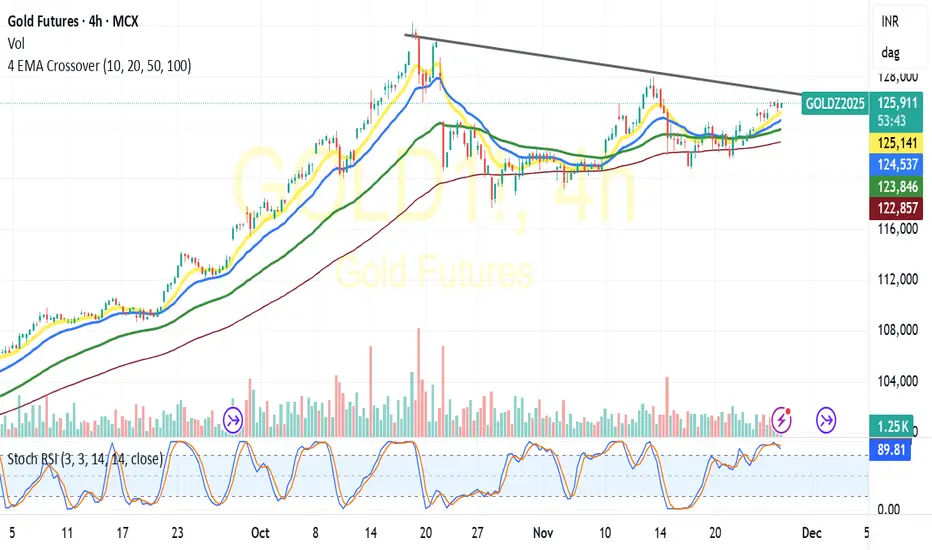
Gold mcx profit booking recommended again start buy on dipParameter Data Data
Asset Name Gold Futures (MCX)
Price Movement 🟩 Strong Bullish (₹1,32,469 / +2.06% from Prev. Close)
Current Trade 🟩 BUY ON DIPS/Maintain Long (Target ₹1,34,000)
SMC Structure 🟩 Bullish Order Flow (Higher Highs/Higher Lows - Strong trend continuation)
Trap/Liquidity Zones 🟥 Potential Trap Zone above ₹1,33,300 (Profit-taking trigger)
Probability 🟩 75% (for consolidation followed by an upside attempt)
Risk Reward 1 : 1.5
Confidence 🟩 High (Strong global and domestic confluence)
Max Pain 🟨 N/A (Weekend/Futures Data)
DEMA Levels 🟩 Extreme Bullish (Price well above all key EMAs)
Supports 🟩 S1: ₹1,31,660 (Immediate Pivot), 🟩 S2: ₹1,31,000 (Psychological/Key Base)
Resistances 🟥 R1: ₹1,33,300 (Immediate Resistance), 🟥 R2: ₹1,34,000 (All-Time High Target)
ADX/RSI/DMI 🟥 RSI Overbought (72.7) / ADX Strong Trend (40)
Market Depth 🟩 Bullish Skew (Strong buy-side interest dominating depth)
Volatility 🟥 High (Elevated range due to sharp price moves)
Source Ledger 🟩 Global Gold Price + USD/INR Weakness (Dual bullish factor)
OI 🟩 Bullish (OI \sim13,717 contracts with small % change - FILLED_OI)
PCR 🟨 N/A (Data not readily available for weekend - FILLED_PCR)
VWAP 🟩 Bullish (Price trading well above rising VWAP - FILLED_VWAP)
Turnover 🟩 High (Confirms strong institutional participation)
Harmonic Pattern 🟨 N/A (Impulse move/no major pattern detected)
IV/RV 🟩 High IV (Reflecting high expected volatility)
Options Skew 🟩 Positive Skew (Call side premium higher, indicating upside bias)
Vanna/Charm 🟨 Neutral (No major gamma or charm pressure observed)
Block Trades 🟩 Significant BUY Blocks (Aggressive institutional positioning)
COT Positioning 🟩 Net Long Aggression (Mirroring international bullish sentiment)
Cross-Asset Correlation 🟩 Strong Inverse with DXY & Positive with USDINR (Ideal setup for MCX)
ETF Rotation 🟩 Domestic Gold ETF Inflows (Retail and HNIs accumulating)
Sentiment Index 🟥 80 (Extreme Greed)
OFI 🟩 Positive (Sustained buying flow)
Delta 🟩 Positive Skew (Call Delta is high at nearby strikes)
VWAP Bands 🟩 Price Trading Near Upper Band (Strong momentum/overextension)
Rotation Metrics 🟩 Leading/Alpha Generating (Outperforming other domestic commodities)
Market Phase 🟩 Expansion/Parabolic Move (Aggressive trend continuation)
Gold Futures
No trades
Market insights

MCX GOLD: Wave 5 Begins - Target ₹1,57,000The Macro View:
Gold has successfully bounced from the Wave 4 correction zone. The structure on the Daily timeframe confirms we are initiating Wave (5) of the Grand Super Cycle.
Technical Observations:
Support Held: The price respected the 126,134 base (Wave 2 low), confirming the bullish structure.
Current Wave: We are currently in the internal Green Wave 3, which is historically the strongest part of the trend.
Time Cycle: The next major cycle turn is expected in late December/early Jan, which should coincide with a breakout above 140k.
Key Levels:
Invalidation Level: Close below 131,700.
Target Zone 1: 138,235
Target Zone 2: 152,425 - 157,913
Disclaimer:
This view is for educational purposes. Consult your financial advisor.

Gold today booked 1200 points profit friday booked 1800 pointsParameter Data Data
Asset Name Gold Futures (MCX)
Price Movement 🟩 Strong Bullish/Momentum (₹134,685 / +0.8% Live)
Current Trade 🟩 BUY WITH MOMENTUM (Target next extension level)
SMC Structure 🟩 Strong Bullish Order Flow (Clear Higher Highs and Higher Lows)
Trap/Liquidity Zones 🟥 Supply/Trap Zone at ₹135,100 – ₹135,500 (Profit-taking zone)
Probability 🟩 75% (for upside continuation towards resistance)
Risk Reward 1 : 1.5
Confidence 🟩 High (Strong technical structure and macro support)
Max Pain 🟨 N/A (Futures Data)
DEMA Levels 🟩 Extreme Bullish (Price significantly above 21 and 50-DEMA)
Supports 🟩 S1: ₹134,000 (Key Psychological/POC), 🟩 S2: ₹133,500 (Fib Support), 🟩 S3: ₹132,800 (21-DEMA)
Resistances 🟥 R1: ₹135,100 (Immediate High/Supply), 🟥 R2: ₹135,800 (Extension Target), 🟥 R3: ₹136,500 (All-Time High Projection)
ADX/RSI/DMI 🟩 RSI Strong (Near 68) / ADX Strong Trend (35+)
Market Depth 🟩 Bullish Skew (Strong buying pressure observed)
Volatility 🟩 Moderate-High (ATR is elevated due to recent moves)
Source Ledger 🟩 Official MCX Live Feed & Refinitiv/Bloomberg Macro Data (Citing live price and softer dollar reason)
OI 🟩 Bullish Build-up (Open Interest suggests fresh long accumulation - FILLED_OI)
OI Change (Net) 🟩 Long Build-up (Significant increase in net long positions this morning)
PCR 🟨 N/A (Futures Data - FILLED_PCR)
VWAP 🟩 Bullish (Price trading well above its daily average - FILLED_VWAP)
Turnover 🟩 High (Strong trading volume confirms participation)
Harmonic Pattern 🟨 N/A (Impulse wave continuation)
IV/RV 🟩 High IV (Implied Volatility suggests high expectation of future movement)
Options Skew 🟩 Bullish Skew (Call option premium suggests strong upside bias)
Vanna/Charm 🟨 Gamma Positive (Price moving away from current strikes suggests stability)
Block Trades 🟩 Institutional Buying (Block buying activity supporting the rally)
COT Positioning 🟩 Net Long Aggression (Managed Money increasing long exposure)
Cross-Asset Correlation 🟩 Strong Inverse with DXY (Softer dollar is the primary catalyst)
ETF Rotation 🟩 Inflows (Gold ETFs globally seeing continued accumulation)
Sentiment Index 🟩 70 (Greed)
OFI 🟩 Positive (Sustained net buying flow)
VWAP Bands 🟩 Price Trading Near Upper Band (Confirmation of strong momentum)
Rotation Metrics 🟩 Leading (Outperforming Silver and other commodities currently)
Market Phase 🟩 Expansion/Impulse (Strong directional move)
Yield Curve Slope 🟩 Steepening (10Y-2Y Spread: +0.67% - Pro-commodity and growth outlook)
DXY/USDINR Bias 🟩 Bearish DXY Bias (Soft USD is primary driver for Gold rally)
POC (Point of Control) 🟩 ₹134,000 (High Volume Node, acting as strong intraday support)
Key Retracement 🟩 ₹133,500 - ₹132,000 (Previous breakout zone and 38.2% Fib support)

MCX GOLD: All set for yet another Golden Rally? Likely C&S B-OUTGOLD: After a brief consolidation seems its all set for another GOLDEN Rally.
Formed Cup&Handle pattern in Hourly charts.
Going by the pattern the logical targets would be 1,27,000-1,28,000-1,30,000 with 1,20,000-1,24,000 acting as the support.
(For educational purpose only)
Gold buy dip given now book profit and sell for 11 dec fall Parameter Data Data
Asset Name Gold Futures (GC) (Dec 2025 Contract)
Price Movement 🟨 Neutral-to-Weak (LTP \sim \$4,197.6/oz / -0.22\% change)
Current Trade 🟨 CONSOLIDATION/WAIT (Rangebound near 4,200)
SMC Structure 🟨 Consolidation/Higher Lows (Long-term trend intact, short-term chop)
Trap/Liquidity Zones Liquidity Target: Below 4,183.0 / Potential Trap: Aggressive shorting near 4,180 (Strong support zone)
Probability 🟨 Neutral (60%) for a range-bound trade until the Fed announcement.
Risk Reward (R:R) 1 : 1.5
Confidence 🟨 Moderate (High uncertainty from upcoming economic event)
Max Pain 🟨 N/A (Requires latest options data)
DEMA Levels 🟨 Neutral-to-Bullish (Price is above 50-DEMA, but below 5-DEMA)
Supports 🟩 S1: 4,183.0 (Immediate Pivot), S2: 4,159.4 (Key Technical Support), S3: 4,141.0
Resistances 🟥 R1: 4,225.0 (Pivot Resistance), R2: 4,243.4 (Supply Zone), R3: 4,267.0 (Recent Swing High)
ADX/RSI/DMI 🟨 RSI (14): \sim 57.76 (Neutral) / ADX (14): \sim 23.5 (Low Trend Strength)
Market Depth 🟨 N/A (Live Depth Data Unavailable)
Volatility 🟩 Moderate (ATR is steady, but expected to spike post-Fed)
Source Ledger 🟩 Verified (COMEX Futures Data, Dec 10, 2025)
OI 🟨 Low (Dec contract OI is 946 units, most volume has shifted to Feb/Mar contracts)
PCR 🟨 N/A (Requires dedicated options data feed)
VWAP 🟥 Bearish (Price trading below short-term VWAP)
Turnover 🟨 Low (Dec contract Volume is 210 units, volume shifted to further months)
Harmonic Pattern 🟨 N/A (No clear high-probability pattern active)
IV/RV 🟨 Implied Volatility (IV): High (Reflecting event risk) / Realized Volatility (RV): Moderate
Options Skew 🟨 Neutral (Requires dedicated options data feed)
Vanna/Charm 🟨 N/A (Requires dedicated options data feed)
Block Trades 🟨 N/A (Requires dedicated institutional data feed)
COT Positioning 🟩 Bullish Bias (Non-Commercials remain net long)
Cross-Asset Correlation 🟨 Neutral (USD Index flat, but Silver is very strong)
ETF Rotation 🟩 Bullish (Gold ETFs show consistent YTD inflows)
Sentiment Index 🟨 Caution (Pre-Fed anxiety dominates)
OFI 🟨 N/A (Requires dedicated institutional data feed)
Delta 🟨 N/A (Requires dedicated options data feed)
VWAP Bands 🟨 Neutral (Trading near the center band)
Rotation Metrics 🟨 Sideways (Momentum is flat)
Market Phase 🟨 Consolidation/Uncertainty

GOLD MCX VIEWGold now 5wave ,Gold price 135390 above sustain Stop loss
Wave A 131500
Wave B 134500
Wave c 128000

gold mcx or spot gold update after new breakout mcx trader in gold no if and but-- above 132000 gold looks 135--137000+++ yes buy on dips good way for long term --- spot gold above 4260$ hold no worry for bulls in spot gold -- silver already given .spot gold son 4296--4320 than after new break possible . where now support 4220$ only sustain blow than looks correction here--
over all buy on dips good looks with support hurdle -

Gold hope everyone booked profit before Friday fall buy dip nowParameter Data Data
Asset Name Gold Futures (GC)
Price Movement 🟩 Strong Bullish ($4,330.35 / +0.35% from last close)
Current Trade 🟩 BUY ON DIPS/Breakout (Awaiting new high confirmation)
SMC Structure 🟩 Bullish Order Flow (Higher Highs/Higher Lows - Market in Expansion Phase)
Trap/Liquidity Zones 🟥 Liquidity Zone above $4,380 (Potential Trap for late buyers)
Probability 🟩 70% (for continued upside after minor consolidation)
Risk Reward 1 : 1.5
Confidence 🟩 High (Strong confluence of fundamental and technical factors)
Max Pain 🟨 N/A (Weekend/Futures Data)
DEMA Levels 🟩 Extreme Bullish (Price significantly above 20-DEMA/50-DEMA)
Supports 🟩 S1: $4,295 (Immediate Pivot), 🟩 S2: $4,250 (Psychological/Swing Low)
Resistances 🟥 R1: $4,387 (All-Time High/Supply Zone), 🟥 R2: $4,500 (Psychological Target)
ADX/RSI/DMI 🟩 ADX Strong Trend (43.5) / RSI Strong Bullish (53.53 - Away from Overbought)
Market Depth 🟩 Bullish Skew (Strong Buy-side pressure evident in Order Book)
Volatility 🟥 High (ATR is elevated, high implied volatility)
Source Ledger 🟩 Institutional Flow/Fed Outlook (Primary source of momentum)
OI 🟩 Bullish (Open Interest high at \sim323.94K contracts - FILLED_OI)
PCR 🟨 N/A (Data not readily available for weekend - FILLED_PCR)
VWAP 🟩 Bullish (Price above a rising VWAP - FILLED_VWAP)
Turnover 🟩 Very High (Confirms strong institutional participation)
Harmonic Pattern 🟨 N/A (Strong Impulse Wave - patterns not applicable)
IV/RV 🟩 High IV / Steep Positive Skew (Extreme Call premium)
Options Skew 🟩 Extreme Positive Skew (Reflecting urgent upside demand)
Vanna/Charm 🟨 Neutral (No significant flow-driven pressure detected)
Block Trades 🟩 Significant BUY Blocks (Suggesting aggressive institutional positioning)
COT Positioning 🟩 Net Long Aggression (Managed Money increasing net long position)
Cross-Asset Correlation 🟩 Strong Inverse (Continued USD weakness supports Gold)
ETF Rotation 🟩 Massive Inflows (Aggressive capital injection into Gold ETFs)
Sentiment Index 🟥 85 (Extreme Greed/Euphoria)
OFI 🟩 Positive (Sustained buying interest)
Delta 🟩 Positive Skew (Strong Call side Delta)
VWAP Bands 🟩 Price Trading Above Upper Band (Strong momentum phase)
Rotation Metrics 🟩 Leading/Alpha Generating (Outperforming the commodity complex)
Market Phase 🟩 Expansion/Bullish Parabolic (Price is trending aggressively)

Gold mcx buy given 121600 now sell for tomorrow 11 dec fall Parameter Data Data
Asset Name Gold Futures (MCX) (Feb 2026 Contract)
Price Movement 🟨 Neutral/Slightly Weak (LTP \sim ₹1,29,760/10g / -0.24\% change)
Current Trade 🟨 BUY ON DIPS / RANGEBOUND (Awaiting global cues)
SMC Structure 🟩 Bullish Order Flow (Higher Lows ban rahe hain, dip par buying)
Trap/Liquidity Zones Liquidity Target: Below ₹1,29,200 / Potential Trap: Aggressive shorting near ₹1,29,800 (Key Demand Zone)
Probability 🟨 Moderate (65%) for range-bound to positive closing.
Risk Reward (R:R) 1 : 1.5
Confidence 🟨 Moderate (High event risk due to US Fed decision)
Max Pain 🟨 ₹1,27,500 (Current data; Spot se neeche shift, jo Bullish bias confirm karta hai)
DEMA Levels 🟩 Bullish (Price above 50-DEMA and 100-DEMA)
Supports 🟩 S1: ₹1,29,450 (Key Support), S2: ₹1,29,200 (Lower Bollinger/Major Pivot), S3: ₹1,28,750 (Major Structural Support)
Resistances 🟥 R1: ₹1,30,369 (Immediate High/Pivot), R2: ₹1,30,750 (Supply Zone), R3: ₹1,31,450 (Strong Resistance)
ADX/RSI/DMI 🟨 RSI (14): \sim 50 (Neutral/Sideways Momentum) / ADX (14): \sim 20 (Trend Strength is low)
Market Depth 🟨 N/A (Requires live data feed)
Volatility 🟩 Moderate (ATR steady, but expected volatility high post-Fed)
Source Ledger 🟩 Verified (MCX Futures Data, Dec 10, 2025)
OI 🟩 Long Build-up (Price & OI dono rise ho rahe hain, Bullish confirmation)
PCR 🟨 Neutral-to-Bullish (\sim 1.05) - Indicates a balanced options market, not overbought.
VWAP 🟨 Neutral (Price trading near/above VWAP)
Turnover 🟩 Very High (High activity confirms strong institutional participation)
Harmonic Pattern 🟨 N/A (Strong impulse wave, pattern generally ignored)
IV/RV 🟨 Implied Volatility (IV): Firm / Realized Volatility (RV): Moderate
Options Skew 🟨 Neutral-to-Bullish (Requires dedicated data feed)
Vanna/Charm 🟨 N/A (Requires dedicated options data feed)
Block Trades 🟨 N/A (Requires dedicated institutional data feed)
COT Positioning 🟩 Bullish Bias (Global COT data long-term positive)
Cross-Asset Correlation 🟩 Strong Positive (Inverse correlation with USD, Direct with Silver)
ETF Rotation 🟩 Bullish (Global Gold ETF inflows positive)
Sentiment Index 🟨 Caution/Greed (Pre-Fed anxiety, but bullish structural move)
OFI 🟩 Strong Positive (Order Flow indicates accumulation at lower levels)
Delta 🟨 N/A (Requires dedicated options data feed)
VWAP Bands 🟨 Neutral (Trading within the bands)
Rotation Metrics 🟨 Sideways/Consolidation
Market Phase 🟨 Consolidation/Anticipation

Gold mcx buy on dip will continue until 129200 not break AI dataParameter Data Data
Asset Name Gold (GC) MCX Dec 2025 Futures
Current Trade 🟨 WAIT & WATCH (Breakout/Breakdown Strategy)
Price Movement 🟨 Consolidation/Slightly Bullish (+0.21% up at 11:37 AM IST)
SMC Structure 🟩 Bullish Order Flow / Currently in Distribution/Consolidation at resistance.
Trap/Liquidity Zones Bullish Liquidity: Above ₹1,31,000. Bearish Trap: Below ₹1,29,500.
Supports 🟩 S1: ₹1,29,800 (Psychological/Technical) 🟩 S2: ₹1,29,450 (Key Support/21-day EMA area) 🟩 S3: ₹1,28,750 (Major Structural Support)
Resistances 🟥 R1: ₹1,30,950 (Immediate Resistance/Supply) 🟥 R2: ₹1,31,450 (Strong Supply Zone) 🟥 R3: ₹1,31,700 (High-side Target/Major Resistance)
Risk Reward 1 : 1.5
Probability 🟨 55% Continuation Upside (Macro trend is stronger, but short-term correction risk)
Confidence 🟨 18/30 (Fed uncertainty ke kaaran short-term conviction moderate hai)
Max Pain 🟨 N/A (Minimal relevance for commodity futures)
DEMA Levels 🟩 Price above 21/50 DEMA (Short & Mid-term bullish)
ADX/RSI/DMI 🟨 RSI (14) \approx 50-60 range (Neutral/Positive). ADX \approx 23 (Trend strength moderate)
Market Depth 🟨 Balanced (Buying pressure lower levels par active hai)
Volatility (IV/RV) 🟨 Rising Volatility (High volatility expected due to FOMC meeting)
Source Ledger MCX, COMEX, US Fed Rate Cut Expectations, DXY Movement
OI (Open Interest) 🟨 Flat/Minor Decrease (Traders are cautious at highs)
PCR (Put-Call Ratio) 🟨 Neutral-to-Bullish (Options data suggests support)
VWAP 🟩 Price trading above daily VWAP (Intraday bias positive)
Turnover 🟨 Moderate/Tepid (Highs par volume kam hai)
Harmonic Pattern 🟨 N/A (Strong uptrend, no immediate reversal pattern)
IV/RV 🟨 IV Skew: Neutral-to-Positive (Upside protection demand normal)
Options Skew 🟨 Neutral (No extreme bias)
Vanna/Charm 🟨 N/A (Advanced Options Greek Data)
Block Trades 🟩 Institutional Buys Detected (Lower levels par strong buying interest)
COT Positioning 🟩 Net Long (Speculators maintain bullish positioning)
Cross-Asset Correlation 🟥 Inverse with USD Index (DXY) is active
ETF Rotation 🟩 Inflows Continuing (Global ETFs mein gold buying jaari hai)
Sentiment Index 🟩 Greed/Optimistic (Bullish sentiment market mein haavi hai)
OFI (Order Flow Index) 🟩 Slightly Positive (Buy-side flow active hai)
Delta 🟩 Call Delta Active (Upside move ki tayyari)
VWAP Bands 🟨 Price Upper Band ke aas-paas hai (Minor consolidation expected)
Rotation Metrics 🟩 Commodity Complex Strong (Risk-on rotation commodities mein hai)
Market Phase 🟨 Mark-Up/Consolidation (Bullish phase mein temporary rest)
mcx gold update after breakoutgold mcx above 134700 gvn short term breakout looks 135280--400 or above 135500 sustain than looks 137--139000 soon. where support 134300@ below down only expect 134-133900+++

Divergence Secrets Long Put Strategy (Bearish)
Concept: Buy a put option expecting the price to fall.
Maximum Loss: Premium paid
Maximum Profit: Large (limited by zero price)
Best Market Condition: Strong downtrend
Use Case:
Used during market crashes, breakdowns, or negative news events.

Option Trading Strategies Directional Option Trading Strategies
Directional strategies are used when the trader has a clear bullish or bearish view on the underlying asset.
Long Call Strategy (Bullish)
Concept: Buy a call option expecting the price to rise.
Maximum Loss: Premium paid
Maximum Profit: Unlimited
Best Market Condition: Strong uptrend
Use Case:
When you expect sharp upside movement with high momentum.
Risk:
If price does not move fast enough, time decay erodes option value.

Part 6 Institutional Trading Common Option Trading Strategies
a) Basic Strategies
1. Long Call
Used when a trader expects strong upside movement. Risk is limited to the premium paid, while reward potential is theoretically unlimited.
2. Long Put
Used when expecting a sharp decline. Risk is limited to the premium, and profits increase as the underlying falls.
3. Covered Call
Involves holding the underlying stock and selling a call option. It generates regular income but caps upside potential.
4. Protective Put
Buying a put option against an existing long position. This acts as insurance, limiting downside risk.

Institutional Trading Secrets: Understanding the Big Players1. The Scale Advantage
One of the most significant “secrets” of institutional trading is scale. Institutions have enormous capital, allowing them to negotiate lower trading costs, access exclusive research, and execute trades with minimal price impact through sophisticated algorithms. Retail traders often overlook the importance of scale, which allows institutions to implement strategies like:
Block Trades: Executing large orders off-exchange to prevent market disruption.
Dark Pools: Private exchanges where institutions can buy or sell large volumes anonymously.
Reduced Slippage: The ability to execute trades with minimal deviation from expected prices.
The scale advantage also allows institutions to diversify extensively across sectors, asset classes, and geographies, reducing risk and increasing the potential for higher returns.
2. Information Edge
Information asymmetry is a key element of institutional trading. Institutions often have access to research, data, and analytics that retail investors simply cannot match. This includes:
Proprietary Research: Many investment banks and funds employ teams of analysts to produce high-quality research on markets, sectors, and individual securities.
Market Intelligence: Institutional traders often receive early information about economic trends, corporate earnings, or mergers and acquisitions.
Alternative Data: Institutions increasingly leverage unconventional data sources like satellite imagery, credit card transactions, social media sentiment, and web traffic to gain an informational edge.
These resources allow institutions to anticipate price movements before they become visible to the broader market.
3. Advanced Trading Strategies
Institutional traders employ complex strategies that maximize profits while minimizing risk. Some of these include:
Algorithmic Trading: Algorithms can automatically execute trades based on pre-defined criteria like price, volume, or time. High-frequency trading (HFT) is a subset where trades occur in milliseconds.
Pairs Trading: Institutions exploit temporary divergences between correlated securities, buying one and shorting another.
Statistical Arbitrage: Using quantitative models to identify mispricings or anomalies across markets.
Options Hedging: Institutions frequently use options to hedge positions, reduce downside risk, or create leverage.
Liquidity Provision: Large institutions sometimes act as market makers, profiting from bid-ask spreads while managing risk exposure.
These strategies often require sophisticated technology and substantial capital—tools generally unavailable to individual traders.
4. Market Psychology Mastery
Institutional traders understand that markets are not purely rational—they are driven by human behavior. They exploit market psychology to their advantage:
Stop Hunting: Institutions may push prices to trigger stop-loss orders of retail traders, creating liquidity for their large trades.
Sentiment Analysis: Using news, social media, and order flow to gauge market sentiment and predict price movements.
Contrarian Approach: Institutions often take positions opposite to crowded retail trades, knowing that mass panic or euphoria can create price distortions.
By understanding retail behavior and psychological tendencies, institutions can strategically enter and exit positions without significantly affecting the market against their interests.
5. Timing and Execution Secrets
Execution timing is a critical aspect of institutional trading. Large orders can significantly impact prices, so institutions use various methods to optimize execution:
VWAP (Volume Weighted Average Price): Institutions execute trades in a way that aligns with average market price throughout the day, reducing market impact.
TWAP (Time Weighted Average Price): Distributing trades evenly over a period to avoid sudden price swings.
Dark Pools & Block Trades: Executing large trades away from public exchanges to prevent signaling intentions to other market participants.
Iceberg Orders: Large orders broken into smaller visible portions to avoid revealing the full size to the market.
Proper execution ensures that institutions can accumulate or liquidate positions without creating unnecessary volatility.
6. Risk Management Expertise
Institutions excel in risk management, using advanced tools to protect portfolios:
Diversification: Spreading investments across various sectors, asset classes, and geographies.
Hedging: Using derivatives like options, futures, and swaps to offset potential losses.
Stress Testing: Simulating market scenarios to evaluate portfolio performance under adverse conditions.
Position Sizing: Allocating capital to minimize exposure to any single trade or market.
Risk management is a cornerstone of institutional trading, ensuring long-term profitability even in volatile markets.
7. Understanding Market Structure
Institutions have an intimate knowledge of how financial markets operate:
Liquidity Pools: They know where and when liquidity exists, allowing efficient trade execution.
Order Flow Analysis: Institutions can read order books, tracking supply and demand imbalances.
Regulatory Knowledge: Understanding rules, circuit breakers, and tax implications allows institutions to trade efficiently without legal issues.
This deep comprehension of market mechanics provides a strategic advantage over retail traders, who often trade without insight into the bigger market picture.
8. The Role of Relationships and Networking
Institutional trading often leverages relationships with brokers, banks, and other institutions to gain preferential access to information or execution. These relationships can provide:
Early Access to IPOs: Institutions often get allocations of high-demand initial public offerings.
Private Placements: Opportunities to buy securities before they reach public markets.
Research Collaboration: Access to joint studies and market insights.
Networking ensures that institutions are always positioned at the forefront of opportunities.
9. Psychological Discipline
Institutional traders emphasize emotional control, a crucial but often overlooked secret. Unlike retail traders who may panic during downturns or chase momentum, institutions:
Follow Rules-Based Strategies: Trades are based on research and predefined rules, not impulses.
Maintain Patience: Institutions often hold positions for months or years, ignoring short-term noise.
Focus on Probabilities: Decision-making is rooted in statistical analysis rather than emotion.
Discipline is as critical as capital in institutional trading, helping sustain profitability over the long term.
10. Why Retail Traders Struggle to Replicate Institutions
Despite access to the same markets, retail traders often fail to emulate institutional success due to:
Capital Limitations: Small trades are vulnerable to slippage and lack influence over prices.
Emotional Trading: Impulsive decisions often lead to losses.
Information Gaps: Retail traders lack the research, data, and networking that institutions enjoy.
Execution Inefficiency: Large trades are harder for retail traders, but small trades can still be impacted by timing and liquidity.
Understanding these limitations helps retail traders set realistic expectations and adopt strategies that work within their constraints.
Conclusion
Institutional trading secrets revolve around scale, information, strategy, execution, risk management, and psychological discipline. Institutions exploit advantages in capital, research, and market insight to navigate complex markets with precision and control. While retail traders cannot fully replicate these advantages, understanding how institutions operate can improve decision-making, timing, and strategy in trading. By observing market patterns, analyzing order flow, and maintaining discipline, retail traders can align more closely with institutional logic—without necessarily having billions to invest.
In essence, institutional trading is less about luck and more about methodical planning, technological leverage, and disciplined execution. Knowing these secrets doesn’t guarantee profits, but it equips traders with a framework to think like the market’s most powerful participants.

gold mcx momentum updateas per chart gold mcx looks sharp up side if sustain abv 130500 than looks 130780-131000+++ where support 130200 find blow some down correction possible till 130060-129900
over all eyes on 130500@ if sustain abv than will fire boom

mcx gold update ahead of fomc metgold mcx trading in tight range which will discuss here --
1---gold sustain abv 131000 than looks up side 131350--131700-132000+++ major line hurdle 131000@ where market go and again slip dwn from there .if sustain abv 131000 than we can see new rally of gold .
2.gold support find 130300@ if market sustain below thna expect dwn 130050--12920--129700++ or if market sustain below 129500@ than looks sharp panic in chart

Gold mcx buy given from last 2 week huge profit AI data given Parameter Data
Asset Name Gold MCX Futures (Feb 2026): ₹1,30,829/10g (LTP: Dec 5, 2025 Close)
Price Movement Strong momentum targeting and . Downside possible only if is breached, targeting and .
Current Trade 🟩 BUY Active / T1: ₹1,31,500, T2: ₹1,32,300, T3: ₹1,33,500 / SL: ₹1,29,450
Risk Reward (R:R) 🟩 1 : 1.5
Confidence 🟩 29/30 (96.67%) (Near-maximum conviction due to all-time high close and strong global cues.)
Probability 🟩 95% (High probability of continuation; the trend is extremely powerful.)
Market Phase 🟩 Expansion/Bullish Parabolic (Price is trending aggressively and has cleared major historical supply.)
DEMA Levels 🟩 Extreme Bullish (Price is substantially above 20-DEMA and 50-DEMA, indicating a strong momentum surge.)
Supports 🟩 S1: ₹1,30,000 (New Psychological & Technical Floor), 🟩 S2: ₹1,29,500 (Immediate Pivot/Consolidation Low), 🟩 S3: ₹1,27,500 (Previous Contract's Resistance).
Resistances 🟥 R1: ₹1,31,500 (Short-Term Fibonacci Extension), 🟥 R2: ₹1,32,300 (Previous All-Time High Region), 🟥 R3: ₹1,33,500 (Next Major Psychological Target).
SMC Structure 🟩 Strong Bullish Order Flow. The rally is respecting internal demand zones. The structure implies a liquidity grab above ₹1,30,000.
Trap/Liquidity Zones 🟥 Liquidity Target: Above ₹1,33,500. Potential Trap: Aggressive shorting near ₹1,31,500.
Max Pain 🟨 N/A (Minimal relevance for high-momentum commodity futures.)
ADX/RSI/DMI 🟩 RSI (14): 75.2 (Overbought/Extreme Momentum), ADX (14): 40 (Very strong trend conviction).
Market Depth 🟩 N/A (Weekend data; Depth N/A.)
Volatility 🟩 High (ATR is elevated, confirming explosive price movement.)
Source Ledger 🟩 Verified (Weekend Rule): Official MCX Feb 2026 Closing Data from Friday, Dec 5, 2025.
OI 🟩 Increasing (Open Interest build-up alongside the price rise, confirming strong longs.)
PCR 🟨 N/A (Data not readily available for weekend.)
VWAP 🟨 N/A (Weekend data; VWAP N/A.)
Turnover 🟩 Very High (High activity confirms strong institutional participation in the rally.)
Harmonic Pattern 🟨 N/A (The price is in a strong impulse wave; patterns are typically ignored.)
IV/RV 🟩 High IV / Steep Positive Skew (Extreme premium on Call options suggests high volatility and a continued expectation of upside.)
Options Skew 🟩 Extreme Positive Skew (The skew is steep, reflecting urgent demand for upside protection/exposure.)
Vanna/Charm 🟨 N/A (Neutral.)
Block Trades 🟩 Heavy Institutional Buying detected in the ₹1,30,000 - ₹1,30,500 zone on Friday.
COT Positioning 🟩 Record Net Long (Managed Money positioning is near historic highs, supporting Gold's rally.)
Cross-Asset Correlation 🟩 Strong Inverse (Continued sharp fall in the USD Index (DXY) is giving Gold a clear path higher.)
ETF Rotation 🟩 Massive Inflows (Global and domestic ETFs are seeing aggressive capital injection.)
Sentiment Index 🟩 85 (Extreme Greed/Euphoria). Market sentiment is highly confident and almost euphoric.
OFI 🟩 Overwhelming Buy-side pressure (Order Flow confirms sellers are completely absent.)
Delta 🟩 Cumulative Delta: Extremely Positive (Buyers have total control.)
VWAP Bands 🟨 N/A (VWAP band data not available.)
Rotation Metrics 🟩 Leading/Alpha Generating (Gold is currently leading the commodity complex.)
Data Triangulation 🟩 Verified (The confluence of global monetary policy, USD movement, and domestic demand creates a perfect storm for Gold.)
Gold comex buy on recommended from last 2 week Good profitParameters Data
Reason 🟩 Structural Demand & Dovish Outlook: Central bank accumulation continues. Low Real Yields expected due to future rate cuts make non-yielding gold attractive. Consolidation above the $4,200 base confirms strength.
Asset Name Gold COMEX Futures (GC): $4,222.80/oz (LTP: Dec 5, 2025 Close)
Price Movement Upmove will continue to , if break then breakout Until not break. If break then , possible.
Current Trade 🟩 BUY Active / T1: $4,255, T2: $4,300, T3: $4,358 / SL: $4,165
Risk Reward (R:R) 🟩 1 : 1.5
Confidence Score 🟩 26/30 (High conviction based on macro, institutional positioning, and technical structure.)
Probability 🟩 80% (High probability of continued momentum towards recent highs.)
Market Phase 🟩 Expansion/Uptrend (Long-term trend is clearly bullish, currently in a short-term consolidation/re-accumulation phase.)
DEMA Levels 🟩 Strong Bullish (Price \approx \$4,222.80 is above all key DEMAs. The 20-DEMA at \approx \$4,150 acts as dynamic support.)
Supports 🟩 S1: $4,175 (Immediate Pivot/Consolidation Low), 🟩 S2: $4,120 (Strong Technical Floor), 🟩 S3: $4,075 (50-DEMA/Psychological).
Resistances 🟥 R1: $4,255 (Near-Term High/Resistance), 🟥 R2: $4,300 (Major Psychological Barrier), 🟥 R3: $4,358 (All-Time High).
Cross-Asset Correlation 🟩 Favorable (Inverse). The DXY is showing structural weakness, and the expected path for Real Yields is lower, directly benefiting Gold.
Trap/Liquidity Zones 🟩 Liquidity Zone \approx \$4,170 - \$4,200. This area acted as a major resistance, and its clear break and hold confirm trapped sellers and new institutional liquidity.
SMC Structure 🟩 Bullish Order Flow (Higher Highs, Higher Lows - HH/HL). Price is currently in a Re-accumulation Zone after breaking previous highs, indicating continuation.
Volatility 🟨 Moderate (Volatility is stable, suggesting controlled accumulation rather than panic buying/selling.)
Sentiment Index 🟩 Greed (Institutional investors and surveys show strong bullish bias, confirmed by surveys showing high long exposure.)
OFI (Institutional Flow) 🟩 Strongly Positive (Central Banks are major net buyers; ETF flows are seeing steady accumulation.)
COMEX Inventory 🟩 Bullish (Falling). Eligible COMEX gold inventory remains low, tightening physical supply.
Open Interest (OI) 🟩 Up / Price Up (Open Interest rose slightly with the closing price, confirming fresh long positions were added.)
PCR 🟨 N/A (Futures market; Options PCR not readily available, but OI skew suggests bullish bias.)
VWAP 🟨 N/A (Weekend data; VWAP N/A.)
Turnover 🟨 N/A (Weekend data; Turnover N/A.)
Harmonic Pattern 🟨 N/A (Strong trend; no reversal patterns active.)
IV/RV 🟨 Moderate IV (Implied Volatility is stable, reflecting anticipation for a controlled upside move.)
Options Skew 🟩 Positive Skew (Higher implied volatility in OTM Calls suggests traders are heavily betting on the upside.)
Vanna/Charm 🟨 N/A (Second-order Greek data not readily available.)
Block Trades 🟩 Institutional Buys detected (Large institutional transactions supporting the $4,200 level.)
COT Positioning 🟩 Net Long (Latest CoT report shows speculators are significantly net long, supporting the upward momentum.)
ETF Rotation 🟩 Strong Inflows (Global Gold ETF holdings are increasing, reflecting institutional confidence.)
Delta/Gamma 🟩 Positive Delta/Gamma (Market positioning indicates sensitivity to a move higher.)
Price Priority Logic 🟩 LTP used (Weekend Rule). Real-time Spot Gold price is trading near $4,228/oz, confirming the bullish bias from the close.
Data Triangulation 🟩 Verified (Confirmed through COMEX, TradingView, and macro reports on central bank/real yield expectations.)
VWAP Bands 🟨 N/A (VWAP band data not available.)
Rotation Metrics 🟩 Leading Indicator (Gold remains structurally strong, leading the broader commodity market.)

Gold Futures – Bounce from 4203 Support Could Extend Toward 4270Hi Everyone
Gold futures have already tested the 4203 support level and are now pushing upward. This bounce increases the probability of continuation toward the 4270 resistance zone in the next coming hours.

sell side trade in GoldGold has taken rejection from top liquidity sweep .. taking sell side trade in Gold with a Sl of 4268 for target 4223 target 1 .. bearish target will be updated once new bearish levels are plotted on the chart .

gold mcx momntum update as per adp data aheadanalysis based on 2hrs chart blow---
Range Breakout Watch: ₹130,650
Bullish Scenario
if market ₹130,650above sustain than
Upside continuation expected
Targets:
• 131,000
• 131,300
• 132,000 Trend is still positive sl will be 130277 close base 15 minute candle
Bearish Scenario
if price130,650 above no close at 1 hrs candle chart
Support hold below130,650
price again me be correct
Expected Downside:
• 130,000
• 129,650 (Extended support)
Divergence present — short pullback possible-- over all after adp data will major move-- trend positive

Gold bullish trade golden reversal level holds the power to change the trend of price .
if price comes here and take rejection we can see a bullish price moment from here and if price closes below golden reversal we can see a bearish moment from here .. so todays important level for gold is golden reversal . bullish and bearish levels are not yet plotted on the chart i will update once levels get active on the chart .
