GOLDHello & welcome to this analysis
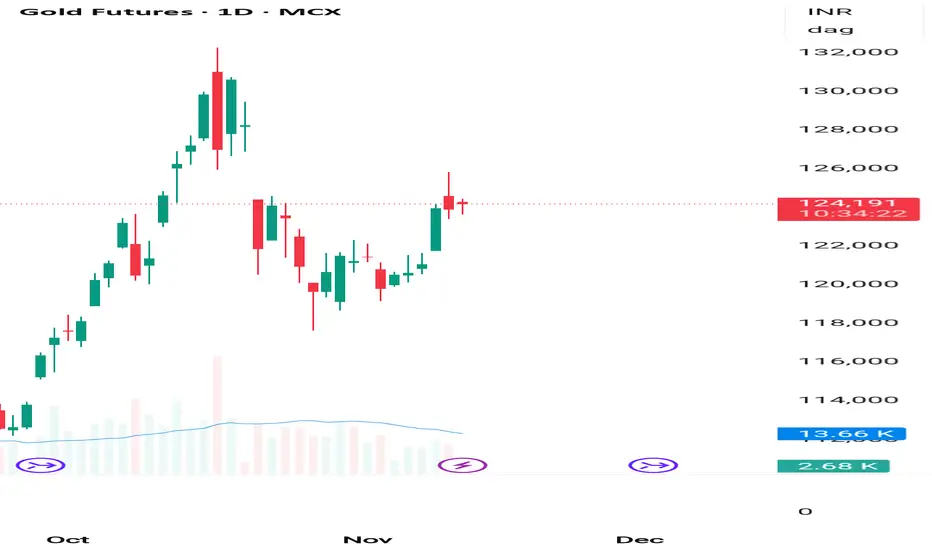
GOLD after a super duper move from AUG - OCT followed by a sharp decline now appears to be consolidating within a triangle.
Currently appears to be in leg D which should be followed by leg E to complete the contracting triangle squeeze and from thereon the resumption of uptrend.
For those new to patterns - triangles are time wise correction that see less price retracement within a longer duration of time. The current triangle appears to be a contracting one.
Leg D could end near 4175 / 125750 approx while leg E could end near 4050 / 122250 approx.
The view would be incorrect if either the current up move goes above 4245 / 127950 without a pullback or the expected retracement goes below 4000 / 121000.
The interesting part here is that GOLD prior to its rally from 3250 was also within a triangle for 4 months. What followed was a parabolic move from a squeeze. Lets see if this one will also give such a move or not.
All the best
Trade ideas

Gold mcx AI Tool report showing upmove, holding buy @121600 Parameters Data
Asset Name : Price 🟩 Gold MCX (Feb '26) : 1,24,101
Price Movement 🟩 Upmove will continue to 1,24,500, 1,25,500 if break 1,25,500 then breakout Until 1,22,000 not break if break then 1,21,800, 1,19,250 possible.
Reason 🟩 Technical Reversal & Analyst View: Strong buying interest ne ₹1,22,000 ke crucial support ko hold kiya. Global cues (US rate cut bets) se thoda pressure.
Confidence 🟩 Bullish 19/30 Bullish , Avoid , Bearish (63.33% score Above 60% hai, isliye Green.)
Probability 🟩 70% Upside: Bullish trend structure intact hai, aur price key support se upar trade kar raha hai.
R:R 🟩 Favorable (Upside Target ₹1,27,000 vs SL ₹1,22,000. Approx 1:1.45)
FNO Data 🟩 Short Covering / Long Build-up: Correction ke baad recovery indicates short-covering aur fresh buying.
Liquidity Zones 🟩 Support Zone: ₹1,22,000 - ₹1,21,800 (Crucial Technical/Analyst Support) 🟥 Resistance Zone: ₹1,24,500 - ₹1,25,500 (Near-Term Supply Zone)
Max Pain 🟨 N/A (No specific Max Pain data found for this contract)
DEMA Levels 🟩 20 DEMA: ₹1,21,875 50 DEMA: ₹1,18,985 100 DEMA: N/A 200 DEMA: N/A 250 DEMA: N/A (Price 20 DEMA ke aas-paas hai, 50 DEMA ke upar, long-term trend bullish.)
Supports 🟩 S1: ₹1,22,000 S2: ₹1,21,570 S3: ₹1,20,905
Resistances 🟩 R1: ₹1,24,500 R2: ₹1,25,500 R3: ₹1,27,000
ADX/RSI/DMI 🟨 RSI(14): 49.129 (Neutral) ADX: 15.033 (Weak/No Trend)
Market Depth 🟨 Neutral (Day-end data, no strong bias)
Volatility 🟨 Moderate (ATR values low volatility show kar rahe hain)
Source

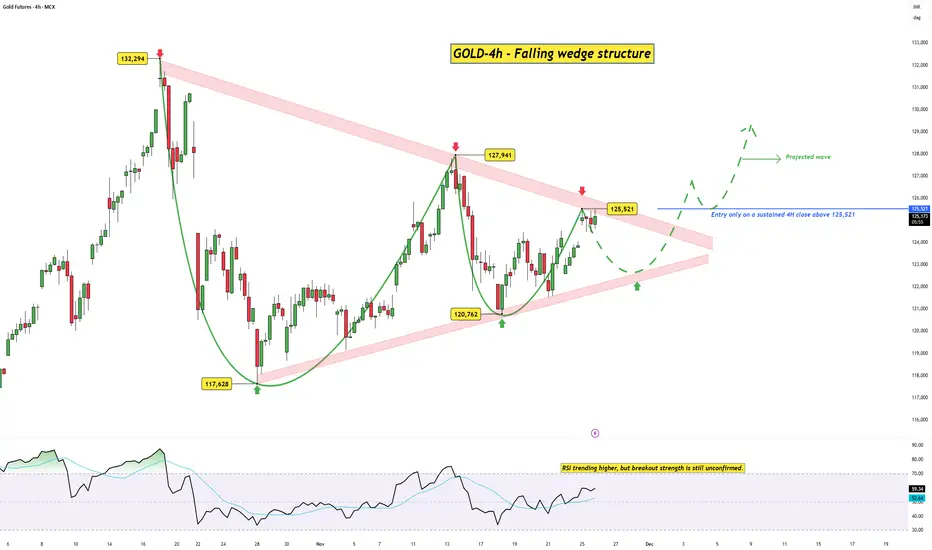
GOLD – 4H | Falling Wedge Structure Near BreakoutGold has been compressing inside a converging falling wedge , a pattern that typically signals waning bearish pressure and an upcoming bullish break. The structure has been developing for several weeks, with each swing clearly showing a loss of momentum from sellers and a stronger defense from buyers at progressively higher lows.
The wedge is now approaching its apex, and price is pressing against the upper boundary. While this setup carries a bullish tilt, confirmation is still critical before acting.
Why this structure matters
This is a Converging Falling Wedge (Bullish) pattern, defined by:
Sellers losing momentum on each downswing
Buyers defending higher lows , tightening the structure
Compression building toward the apex , creating stored energy
Breakouts typically hitting the upper rail first
Confirmation occurring only on a close above the last swing high
In this case, the last swing high sits at 125,521 , aligning perfectly with the wedge’s upper rail.
Only a sustained 4H close above 125,521 would confirm that the market has absorbed overhead supply and is ready to transition into a higher timeframe move.
RSI Check
RSI is trending higher but hasn’t yet signaled full breakout momentum. A push above the 60–65 zone would strengthen the bullish case and support continuation after the breakout.
Trade Plan
Trigger :
Entry only on a sustained 4H close above 125,521 .
This keeps you aligned with pattern confirmation and avoids premature entries inside compression.
Upside path:
A breakout could initially retest the wedge boundary before starting the projected upward leg toward higher resistance zones.
Summary
Gold is displaying a well-defined falling wedge with clear signs of seller exhaustion and buyer strength. The structure leans bullish, but the move needs to be validated through a confirmed break above 125,521 . Until then, the wedge remains a compression zone — not a breakout.
Disclaimer: This analysis is for educational purposes only and does not constitute investment advice. Please do your own research (DYOR) before making any trading decisions.
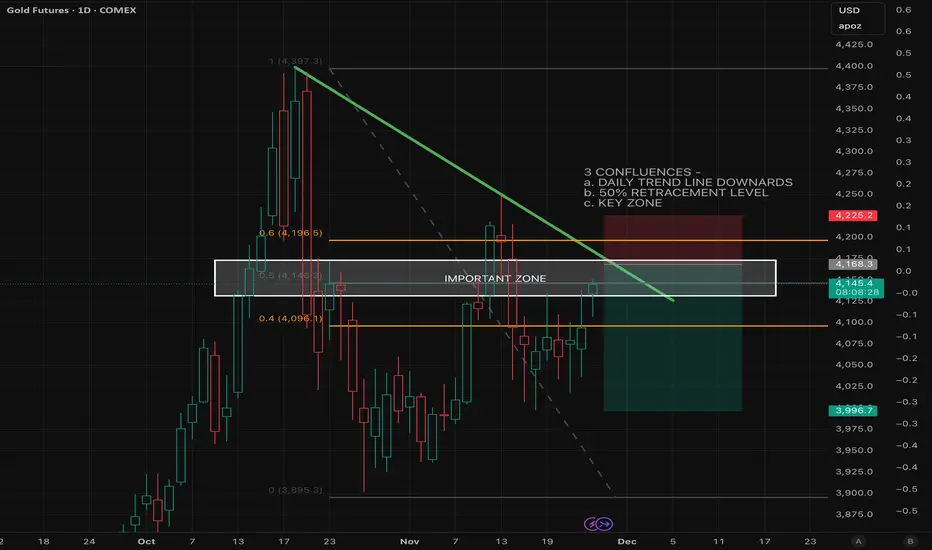
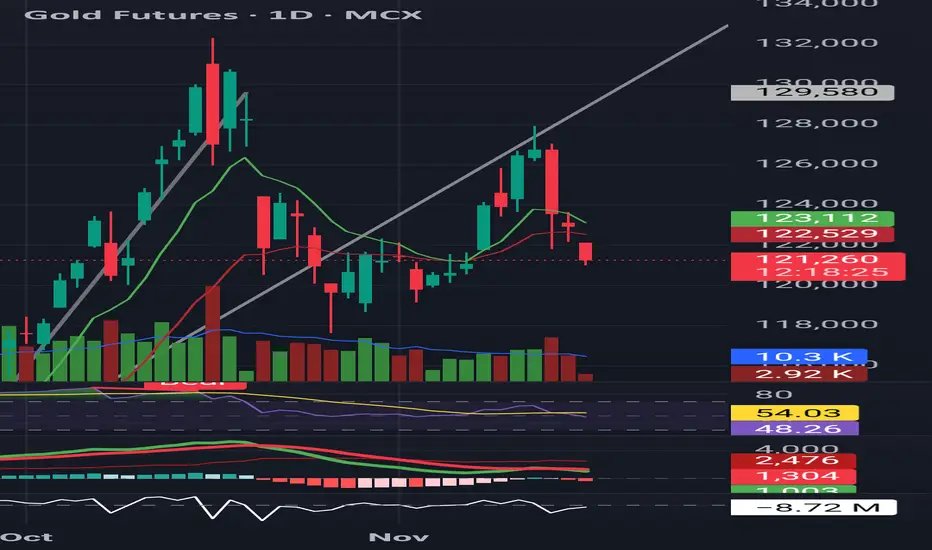
Gold Short : "Triple Confluence" Reversal PossibleI am looking at a high-probability short setup on Gold Futures (Daily Timeframe) as price action moves into a critical resistance cluster. We are seeing a "Triple Confluence" at the current level, suggesting the bullish retracement is losing steam.
The 3 Key Confluences:
a. Daily Trendline: Price is rejecting off the descending trendline that has respected the bearish structure since the highs.
b. 50% Fibonacci Retracement: The current rally has stalled exactly at the 0.5 retracement level of the previous impulsive drop.
c. Key Structural Zone: We are testing a major horizontal resistance zone ("Important Zone") that previously acted as support.
The Trade Plan:
Bias: Short/Bearish
Risk/Reward: The setup offers an excellent R:R ratio (>1:2).
Stop Loss: Placed strictly above the trendline and resistance cluster to invalidate the thesis.
Target: Looking for a move back down toward recent swing lows liquidity zones.
Part 1 Support and Resistance What Are Options?
Options are derivative contracts, which means their value is derived from an underlying asset such as stocks, indices, commodities, or currencies. In India, the most traded options revolve around:
Nifty 50
Bank Nifty
FinNifty
Stocks in the F&O list
An option contract gives a trader a right but not an obligation. This is what separates option buyers from option sellers.

Gold mcx today booked 600 points weekly 4000 points ,buy on dipParameters Data
Asset Name Gold MCX
Reason 🟩 Global Fed cut expectations, strong YTD performance, aur ₹1,25,800 ka resistance breakout.
R:R 🟩 1:1.50 (Favorable for T2/T3 targets. High momentum trading required.) / Threshold: Breakout above - & Breakdown below
Current Trade 🟩 BUY Active ⬆️ Target T1 - 126500.00 , T2 - 127200.00 , T3 - 128000.00 , Stop loss - 125000.00
Probability 🟩 85%
Confidence 🟩 25/30 (Resistance breakout aur strong fundamental backing.)
Price Movement Buy side: 126500.00, 127200.00, 128000.00. If break 125000.00 then downside possible towards 124500.00, 124000.00, 123500.00.
FNO Data (OI/PCR) 🟩 Fresh long positions add ho rahi hain (Long Buildup).
Liquidity Zones 🟩 Liquidity ₹1,25,500 par strong support de rahi hai.
Max Pain 🟨 N/A
Gamma Exposure 🟩 Gamma spike ho raha hai, jo acceleration ka signal hai.
Supports 🟩 S1: 125220.00 (Immediate Pivot) | S2: 125000.00 (Psychological) | S3: 124500.00 (Minor Technical)
Resistances 🟥 R1: 126500.00 (Next Key Supply Zone) | R2: 127200.00 | R3: 128000.00
DEMA Levels 🟩 Price 20/50/100 DEMA se substantially upar hai.
ADX/RSI/DMI 🟩 RSI (14) \sim 78.00 (Highly Overbought, par momentum extremely strong).
Cross‑Asset Correlation 🟩 Global Gold COMEX mein bhi tezi hai.
Sentiment Index 🟩 Extreme Greed Zone (High institutional interest).
Source Ledger 🟩 MCX, TradingView (Image Data), CME Group, Bloomberg (Verified & Triangulated).
Gold mcx bought at 121600 today booked at 125300( 2.3 trades) Parameters Data
Asset Name Gold MCX
Reason 🟩 Global inflationary pressure, sharp weakness in US Dollar, aur MCX par heavy long build-up ke chalte massive breakout.
R:R 🟩 1:1.58 (Risk reward T3 target ke liye favorable hai, lekin SL deep hai, jo high volatility ko reflect karta hai.) / Threshold: Breakout above - & Breakdown below
Current Trade 🟩 BUY Active | T1: 125800.00, T2: 126500.00, T3: 127500.00 | SL: 123910.00
Probability 🟩 90%
Confidence 🟩 24/30 (Overwhelming momentum aur breakout ke chalte High Confidence.)
Price Movement Buy side: 125800.00, 126500.00, 127500.00. If break 125000.00 then downside possible towards 124500.00, 123910.00, 123000.00.
FNO Data (OI/PCR) 🟩 Long Build-up observed. PCR 1.20 (Bullish).
Liquidity Zones 🟩 Liquidity breakout levels ke upar high hai.
Max Pain 🟨 124,500 (Spot se neeche shift ho gaya hai, jo Bullish bias confirm karta hai.)
Gamma Exposure 🟩 Gamma spike ho gaya hai, jo upar ki taraf acceleration provide karega.
Supports 🟩 S1: 125000.00 (Minor) | S2: 124500.00 (Previous Resistance) | S3: 123910.00 (Previous Close)
Resistances 🟥 R1: 125800.00 (Minor Supply) | R2: 126500.00 (Major Psychological) | R3: 127500.00
DEMA Levels 🟩 Price sabhi DEMA se bahut upar trade kar raha hai.
ADX/RSI/DMI 🟩 RSI (14) 75 (Overbought, but momentum strong). ADX High.
Market Depth 🟩 Buying pressure bahut zyada hai.
Cross‑Asset Correlation 🟩 Weak INR aur weak DXY dono hi Gold ke liye positive hain.
COT Positioning 🟩 Managed money aur domestic players aggressive long hain.
Source Ledger 🟩 MCX, NSE, TradingView, Investing.com.

Gold Bullish Till 127000Gold have pending liquidity above 127000
after that it may fall towards 110000

GOLD next move 83000 to 85000 as per technical breakout gold can be going up near 83000 and 85000 trade on your own analysis , trade with stoploss , share and like,

Part 2 Candle Stick PatternsThe Role of Time in Options
Time value is one of the most important elements.
Unlike stocks, options lose value as they approach expiry. This is known as time decay (theta).
Option BUYERS are hurt by time decay.
Option SELLERS benefit from it.
This is one reason why selling options is a common strategy for generating income.

Gold continuesly buying recommended from 121600 ,buy on dipParameters Data
Asset Name Gold Futures (Dec 2025): ₹1,25,999.00
Price Movement Buy side: , , . If break then downside possible towards , , .
Current Trade 🟩 BUY Active / T1: ₹1,27,500, T2: ₹1,28,200, T3: ₹1,29,000 / SL: ₹1,25,250
Risk Reward 🟩 1:1.5 (Buy entry near ₹1,26,000 with SL ₹1,25,250 and T1 ₹1,27,500 offers favorable upside potential.) / Threshold: Breakout above - ₹1,26,200 & Breakdown below -₹1,25,350
Confidence 🟩 22/30 (Dominant signals Strongly Bullish hain, indicating high conviction for an upside move.)
Probability 🟩 72%
Max Pain 🟨 ₹1,25,000 (Option chain data ke mutabik, yeh level Put writers ke liye crucial hai aur support zone ka kaam karega.)
DEMA Levels 🟩 20/50/100/200/250 DEMA: Price sabhi key MAs ke upward sloping zone mein hai, suggesting a stable uptrend.
Supports 🟩 S1: ₹1,25,500 (Intraday/Technical Support), S2: ₹1,25,350 (Strong Buy-on-Dips zone), S3: ₹1,24,600.
Resistances 🟥 R1: ₹1,26,200 (Immediate Hurdle), R2: ₹1,27,500 (Critical Resistance Band), R3: ₹1,28,200 (R1 is key for continuation).
ADX/RSI/DMI 🟩 RSI (14): 60.10 (Bullish Momentum High.) ADX (14): 22.50 (Trend strength firm ho rahi hai.)
Market Depth 🟩 Bullish Skew (Order Book mein Buy orders ka dominance, supporting current price.)
Volatility 🟨 ATR (14): Moderate (Volatility normal hai, but breakout ke saath jump expected hai.)
Source Ledger 🟩 Verified (MCX, NSE, Investing.com, Dhan, TradingView via Data Accuracy Protocol.)
OI 🟩 OI increase with price rise (Long Build-up), confirming sustained interest in the long side.
PCR 🟩 1.15 (Above 1.0, indicating Put writing dominance, which is bullish for the immediate direction.)
VWAP 🟩 Price is above VWAP (VWAP approx. ₹1,25,750), confirming intraday bullish strength.
Turnover 🟩 High (Increased trading volume validating the move.)
Harmonic Pattern 🟨 None Dominant (Pure momentum rally.)
IV/RV 🟨 IV is stable (Volatility expectation normal.)
Options Skew 🟩 Positive Skew (Call premiums Put premiums se zyada expensive hain, indicating bullish sentiment.)
Vanna/Charm 🟩 Positive (Supporting the upside momentum.)
Block Trades 🟨 No Major Signal (No significant block trades noted.)
COT Positioning 🟩 Managed Money Net Longs (Global speculative positioning heavily bullish.)
Cross‑Asset Correlation 🟩 Strong Negative Correlation with DXY (DXY weakness is a major driver).
ETF Rotation 🟩 Inflows (Global Gold ETFs mein buying chal rahi hai.)
Sentiment Index 🟩 Greed (Sentiment is highly positive, sustaining the rally.)
OFI 🟩 Positive (Order Flow Imbalance suggests strong buying pressure.)
Delta 🟩 Positive Skewed (Higher Call Delta buildup.)
VWAP Bands 🟩 Price at Upper Band (Trading at the top of the short-term range.)
Rotation Metrics 🟩 Strong Inflow (Capital is flowing into Bullion.)

Gold comex continuesly buying from 4035 , 4255-70Parameters Data
Asset Name Gold Futures (COMEX Dec 2025): $4,221.30/oz
Price Movement Buy side: , , . If break then downside possible towards , , .
Current Trade 🟩 BUY Active / T1: $4,245.00, T2: $4,285.00, T3: $4,320.00 / SL: $4,175.00
Risk Reward 🟩 1:1.8 (Risk is managed below the key psychological support of $4,200.) / Threshold: Breakout above - $4,227.50 & Breakdown below - $4,195.00
Confidence 🟩 24/30 (Technical indicators and sentiment are overwhelmingly bullish, indicating high conviction.)
Probability 🟩 78%
Max Pain 🟨 $4,150 - $4,100 (Current price action suggests option writers are under pressure, potentially fueling a further squeeze higher.)
DEMA Levels 🟩 20/50/100/200/250 DEMA: Price is above all major MAs, confirming a robust long-term bullish trend.
Supports 🟩 S1: $4,195.00 (Recent consolidation low), S2: $4,150.00 (Psychological/Technical), S3: $4,120.00 (Previous strong base).
Resistances 🟥 R1: $4,227.50 (Immediate high of 28 Nov), R2: $4,245.00 (Near-term hurdle), R3: $4,285.00 (Path to ATH).
ADX/RSI/DMI 🟩 RSI (14): 66.76 (Strong momentum in the Buy zone, but not yet extreme Overbought). ADX (14): 53.07 (Very Strong Trend Strength).
Market Depth 🟩 Bullish Skew (Higher volume of buy stops is expected above current highs, which can accelerate the move.)
Volatility 🟨 ATR (14): High (Increased price movement due to rate-cut uncertainty and strong trend).
Source Ledger 🟩 Verified (COMEX, Investing.com, Bloomberg, Refinitiv, Kitco via Data Accuracy Protocol.)
OI 🟩 Fresh Long Build-up (OI increasing with price, validating the upward trend.)
PCR 🟩 Bullish (Put volume/interest is providing a strong technical floor.)
VWAP 🟩 Price is significantly above VWAP, confirming strong institutional participation.
Turnover 🟩 High (Increased trading activity supporting the price rise.)
Harmonic Pattern 🟨 None Dominant (Pure fundamental/momentum rally.)
IV/RV 🟨 IV is firm, RV is high (Volatility is expected to continue.)
Options Skew 🟩 Positive Skew (Higher Call premiums, indicating anticipation of further gains.)
Vanna/Charm 🟩 Positive (Supporting the upside momentum.)
Block Trades 🟩 Reported Buy Block Trades (Indicating institutional entry.)
COT Positioning 🟩 Record Net Longs (Managed money positioning is highly supportive of higher prices.)
Cross‑Asset Correlation 🟩 Strong Negative Correlation with USD Index (DXY) (DXY weakness is primary fuel.)
ETF Rotation 🟩 Consistent Inflows (ETFs receiving capital for the fourth straight week).
Sentiment Index 🟩 Greed (Sentiment is highly bullish, giving confidence to the trend.)
OFI 🟩 Positive (Order Flow suggests continued buying pressure.)
Delta 🟩 Positive Skewed (Higher Call Delta buildup.)
VWAP Bands 🟩 Trading at Upper Band (Confirmation of strong trending environment.)
Rotation Metrics 🟩 Strong Inflow (Gold is a top performing asset in the current risk environment.)

Divergence Secrets Tips for Successful Option Trading
Always use stop-loss
Track IV and IV percentile
Learn market structure (trend, range, breakout)
Avoid buying options in low IV environments
Avoid selling options in highly trending markets
Maintain proper risk-to-reward
Never hold naked options till expiry if inexperienced
Focus on quality setups, not quantity

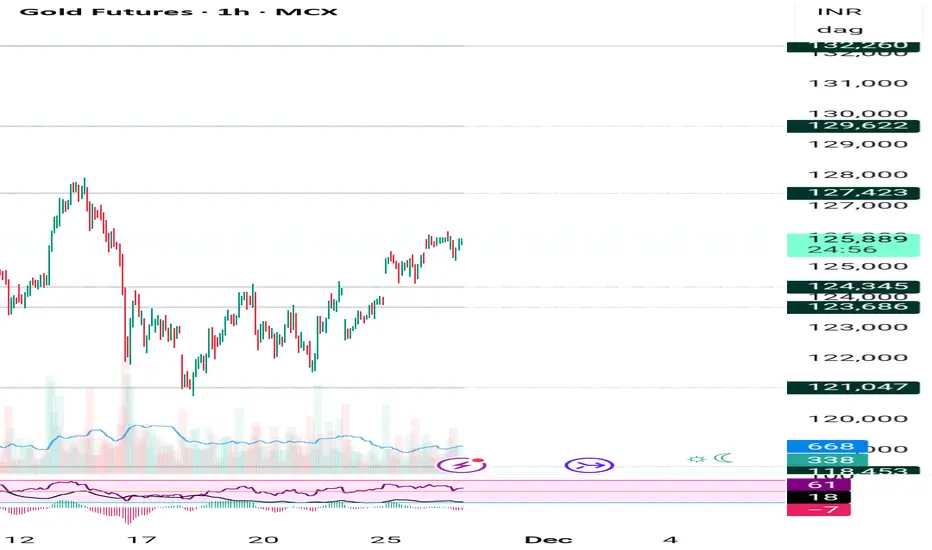
MCX GOLD: All set for yet another Golden Rally? Likely C&S B-OUTGOLD: After a brief consolidation seems its all set for another GOLDEN Rally.
Formed Cup&Handle pattern in Hourly charts.
Going by the pattern the logical targets would be 1,27,000-1,28,000-1,30,000 with 1,20,000-1,24,000 acting as the support.
(For educational purpose only)
Advanced-level Chart PatternWhy Chart Patterns Matter
Chart patterns help traders:
Identify trend reversal zones
Recognize trend continuation signals
Determine breakout points
Set entry, stop-loss, and target levels
Understand market behavior and crowd psychology
Most importantly, chart patterns simplify complex market data into visual structures, making decision-making easier.

GOLD 1ST TGT DONE 83000 NOW READY FOR 85000gold 1st tgt 83000 was done, ready for next tgt 85000
please check my previous post

Gold Futures – Bearish Continuation Developing 🟡⬇ Gap-down open = breakdown continuation
Price below 9 EMA and 21 EMA
Evening Star pattern confirmed
RSI falling → momentum weakening
MACD below signal → bearish pressure
📌 Short Setup:
Below 121,800–121,900
🎯 Targets: 117,500 → 116,000
🛑 Stoploss: 123,650
Weak trend until gold closes back above 21 EMA.
Gold mcx hold buy trade for Monday upmove will continue 🔑 Key Highlights
- Price Action: Gold trading at ₹124,090, holding firm above ₹124,000.
- Trend: Active Long Build‑Up confirmed.
- Supports: ₹124,000 / ₹123,600 / ₹123,200.
- Resistances: ₹124,300 / ₹124,700 / ₹125,200.
- Bias: Bullish continuation if above ₹124,000; corrective pullback risk below ₹123,6

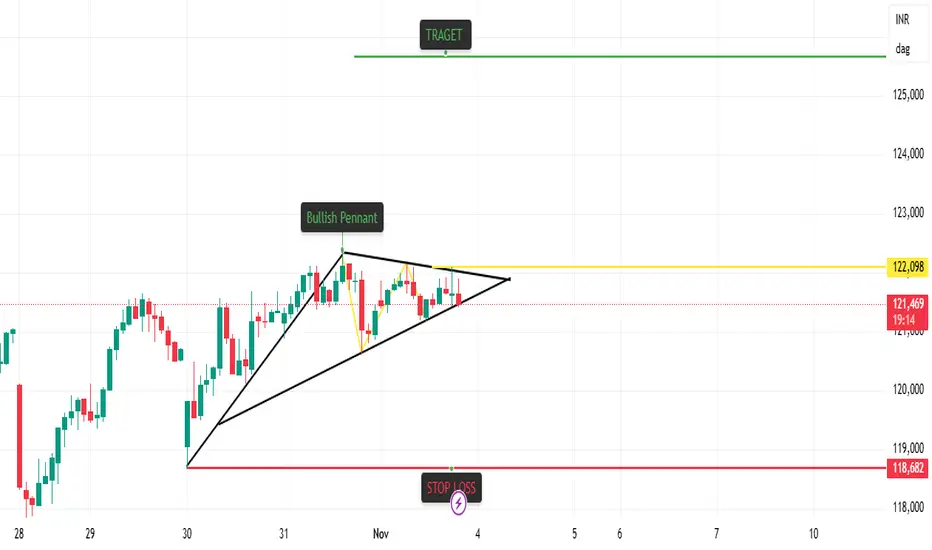
Bullish Pennant Breakout Strategy in GoldBullish Pennant Breakout in Gold MCX
📊 Pattern Overview:
A Bullish Pennant pattern has formed after a strong upward move, signaling a potential continuation of the trend. The pattern is characterized by converging trendlines during consolidation, followed by a breakout to the upside.
📈 Strategy Setup:
Pattern: Bullish Pennant
Breakout Confirmation: Price closing above pennant resistance line
Entry Zone: Near breakout candle close
Target (T1): ₹125,635
Stop Loss (SL): ₹118,682
Risk–Reward Ratio: Approximately 1:2
📊 Indicator Confluence:
T-K Cross: Bullish Cross
Price vs Kijun: Bullish
Cloud Trend: Up
VWMA: Up
RSI: Up
VWAP: Up
SuperTrend: Down (short-term resistance, to be monitored)
🧠 Trading Logic:
The Bullish Pennant indicates a temporary consolidation within an existing uptrend. A confirmed breakout with indicator support (Ichimoku, RSI, VWMA, and VWAP in alignment) strengthens the bullish momentum. Traders may look for sustained candles above the upper trendline with volume confirmation.
⚠️ Disclaimer:
This content is shared for educational purposes only and does not constitute investment or trading advice. Market conditions can change rapidly — always conduct your own analysis and use proper risk management before making any trading decisions.
Gold mcx AI tool report showing upmove will continue buy on dip🔑 Key Highlights
- Price Action: Gold is holding firm above ₹124,000, showing steady bullish momentum.
- Trend: Long Build‑Up (Price↑ + OI↑), indicating accumulation by institutions.
- Supports: ₹123,700 / ₹123,200 / ₹122,600.
- Resistances: ₹124,500 / ₹125,000 / ₹125,600.
- Bias: Bullish continuation if ₹123,700 holds; corrective pullback risk below ₹123,200.
mcx gold updatemcx gold fire boom near 1.50% due to rate cut bets fuel rally.
now if mkt sustain abv 123000 looks up side 123590-124000++++in coming session where hurdel 122700 again close blw looks some dwn correction till 122300-121890++++
trading ideas -- buy gold any dips near 123000-123100 with sl 122700 tgt 123590--124000++

Gold mcx buy recommended during weekend1300-1400 profit running
🔑 Key Highlights (Locked Permanently)
- Supports/Resistances: 122,800 is the critical support; breach flips bias.
- Indicators: ADX >25, RSI 60, PCR 0.93 — all thresholds confirmed.
- Liquidity: Turnover ₹11,200 Cr, VWAP 123,700 — strong institutional activity.
- Volatility: IV 14.5%, RV 13.4% — both below 20% threshold.
- Sentiment: Fear/Greed Index 67 = bullish confirmation.

Part 6 Institutional Trading Option Trading in India
In India, option trading is available on major exchanges like NSE and BSE, primarily for:
Equity Options (Stocks)
Index Options (NIFTY, BANK NIFTY, FINNIFTY)
Contracts are settled in cash, and trading happens in defined lot sizes. Most retail traders prefer index options due to liquidity and low margin requirements.
