#Silver Alert: Double Top Breakdown Incoming?🚨 Double Top on XAGUSD daily chart:
1️⃣ First Top: Bearish Engulfing
2️⃣ Second Top: Dark Cloud Cover
Pattern confirms DCB 🔻 below $45.55 , 🎯 targeting $36.71 .
🚧 Resistance: $52.32 - $54.49
🛡 Support: $50.62, $49.38 - $48.91, $47.17 - $46.90
⚠️ Major sell-off potential. Longs only

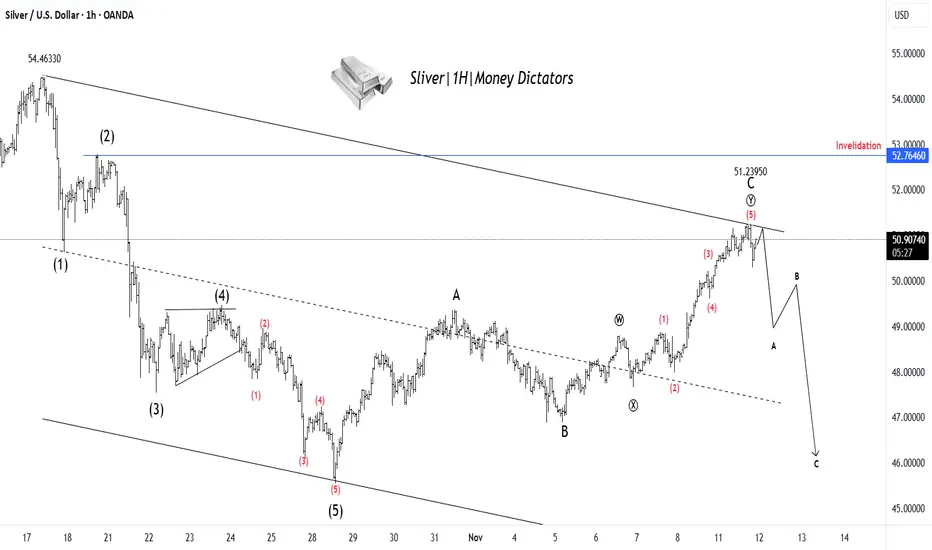
XAG/USD Set for Decline After Finishing Wave YSilver has completed a clear 5-wave upward move, ending near the 51.23 zone, which likely marks the completion of Wave C of the corrective structure. Price action shows rejection from the upper trendline, signaling that buying momentum is fading. This suggests the start of a new A–B–C corrective dec
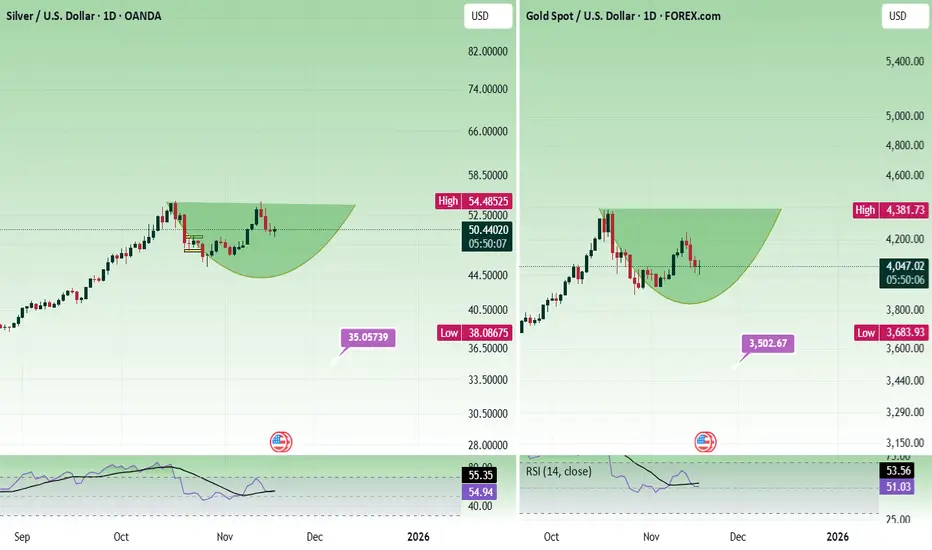
Trader's Queries - Gold & Silver - A reviewI rarely publish ideas about gold, and this is the first time I am writing about silver. This is not about where to buy or sell. Idea is about the structure of the price action.
Both gold and silver is forming a rounding bottom pattern. If it gives a breakout right away, then sustaining above these
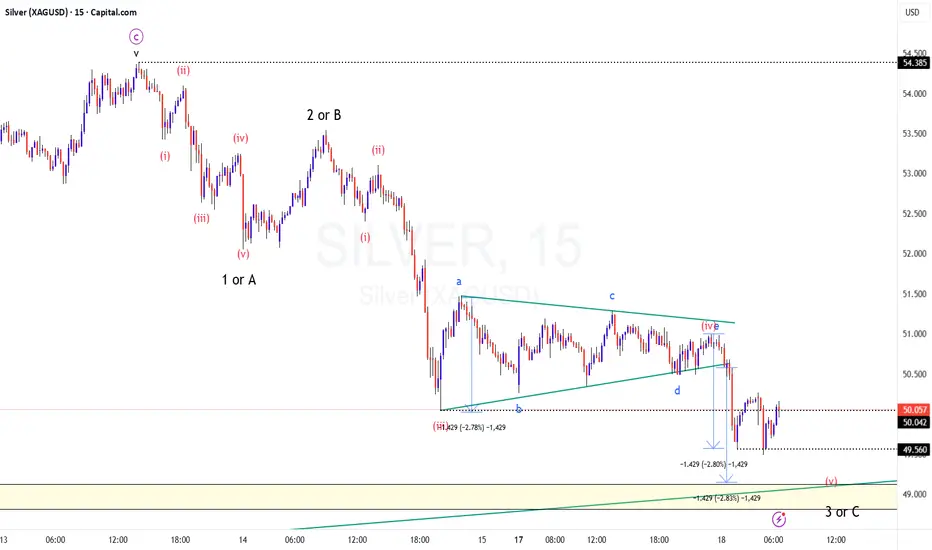
Time to TRIM your shorts in SILVER / XAGUSD?
TF: 15 Minutes
CMP: 49.941
The structure and counts suggests that we are in for a bounce on this counter anytime soon.
I have marked the internal counts of this fall from the recent swing high (54.385)
Whether it is an ABC decline or an impulse 5 wave decline, we are in for a bounce in the short
Trade Journal 13/11/2025 XAUUSD SellsI took the same setup as I took yesterday, Gold took out London Highs and Silver failed to do so. Entered on the close of 15m candle.
As customary exited at 2Rs.
Simple time based divergence model.
This model has formed thrice this week, stopped out once, exited at a small loss yesterday and today

#Silver | #XAGUSD 4H UpdateCMP: $50.44
🔴 Price testing key resistance zones
🚧 $50.47 - $50.94
⚠️ Strong supply area — consider booking profits or tightening stops on longs.
👀 Only a clean 4H close above $50.94 can open the way for further upside.
#Silver TVC:SILVER #XAUUSD #PriceAction #Commodities #Trading #F

Silver start buying on dip for next week 51.50 to 52 $ will comeHow My Harmonic pattern projection Indicator work is explained below :
Recent High or Low :
D-0% is our recent low or high
Profit booking zone ( Early / Risky entry) : D 13.2% -D 16.1 % is
range if break them profit booking start on uptrend or downtrend but only profit booking, trend not ch

Silver comex buy recommended at 48.35 target open 50.50 ,to 50.8🔑 Key Highlights (Locked Permanently)
- Supports/Resistances: 48.80 is the critical support; breach flips bias.
- Indicators: ADX >25, RSI 58, PCR 0.96 — all thresholds confirmed.
- Liquidity: Turnover $8.7B, VWAP 49.90 — strong institutional activity.
- Volatility: IV 15.0%, RV 13.7% — both b

Silver Triangle BreakoutSilver is attempting breakout forming a ascending triangle pattern on 1h and 4h timeframe. It is also trading above 200ema.

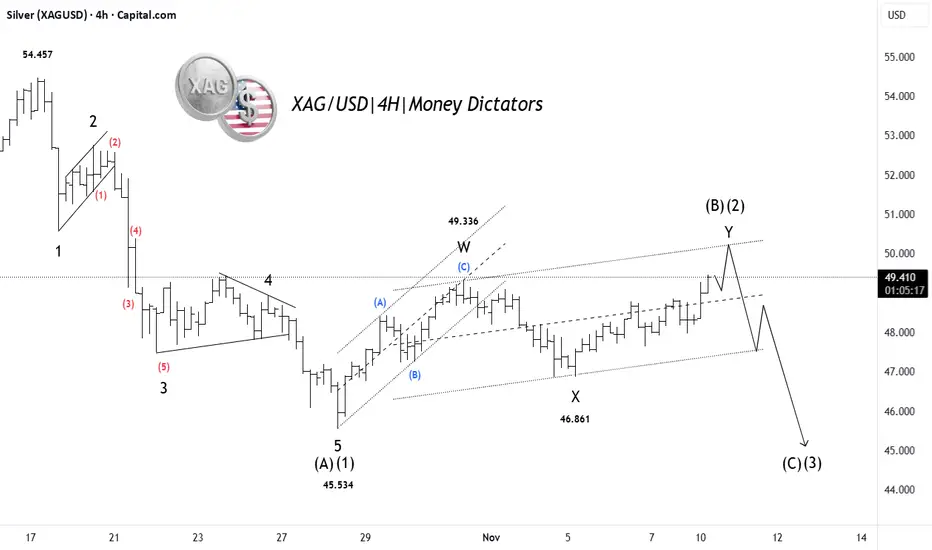
Silver Correction Ending: Major Drop AheadSilver (XAG/USD) has completed a 5-wave decline, marking the end of Wave (A)/(1) near the 45.53 level. Since then, price has been retracing upward in a complex W–X–Y corrective structure, which appears to be forming the final leg of Wave (B)/(2). The rise is losing strength near the upper channel, h
See all ideas
Summarizing what the indicators are suggesting.
Oscillators
Neutral
SellBuy
Strong sellStrong buy
Strong sellSellNeutralBuyStrong buy
Oscillators
Neutral
SellBuy
Strong sellStrong buy
Strong sellSellNeutralBuyStrong buy
Summary
Neutral
SellBuy
Strong sellStrong buy
Strong sellSellNeutralBuyStrong buy
Summary
Neutral
SellBuy
Strong sellStrong buy
Strong sellSellNeutralBuyStrong buy
Summary
Neutral
SellBuy
Strong sellStrong buy
Strong sellSellNeutralBuyStrong buy
Moving Averages
Neutral
SellBuy
Strong sellStrong buy
Strong sellSellNeutralBuyStrong buy
Moving Averages
Neutral
SellBuy
Strong sellStrong buy
Strong sellSellNeutralBuyStrong buy
Displays a symbol's price movements over previous years to identify recurring trends.