BRENT CRUDE | STELLAR GEOMETRY – A CRITICAL WINDOW AROUND 13 NOVBRENT CRUDE | STELLAR GEOMETRY – A CRITICAL WINDOW AROUND 13 NOVEMBER
13 November is an interesting date, widely discussed in certain mathematical and historical Doomsday-cycle references , and it also emerges as a significant time coordinate in my Stellar Geometry model.
The geometric structures indicate a potential high-volatility window around this date. If an unexpected geopolitical or other major event unfolds, crude could witness an extraordinary upward expansion, potentially approachi
In-depth trading ideas
TradingView: More Than a Trading Platform — A Place to Explore# TradingView: More Than a Trading Platform — A Place to Explore, Experiment and Implement Ideas
TradingView is not just another platform. Its tagline, *“Created by humans”*, reflects something deeper. Almost every tool and process offers an opportunity to explore, experiment and implement ideas independently.
Thank you, TradingView, for creating an ecosystem where we can interact, exchange ideas, develop our own methodologies and convert research into actionable tools.
**Let's look at Crud
Brent Crude Oil — Technical Analysis - Daily Chart
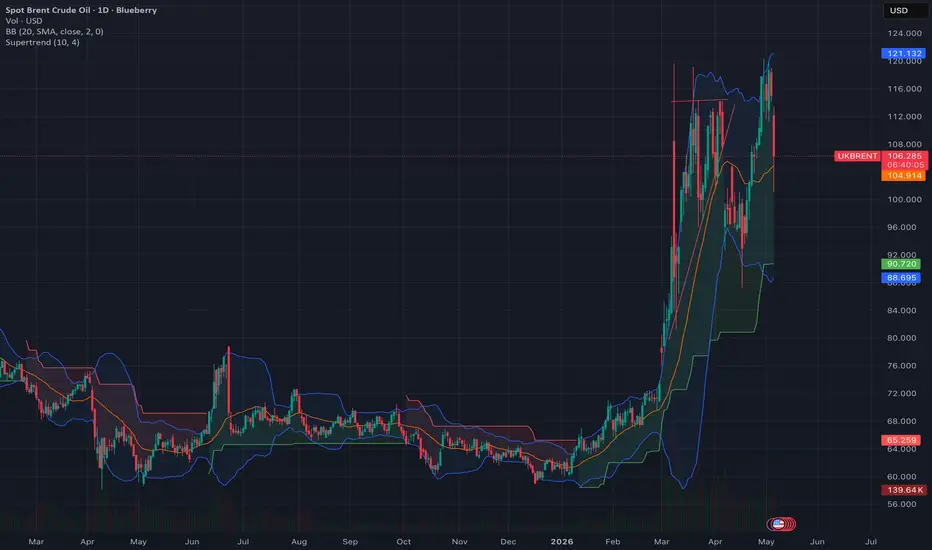
Brent crude is showing a strong bullish structure, recovering from the July low near $68 and forming higher highs and higher lows. Price is now approaching a major long-term resistance zone around $117–$120, where the descending trendline and previous swing highs converge.
The recent rally has also moved price toward the upper boundary of the rising channel. RSI is around 71, indicating strong momentum but also an overbought condition, so some consolidation or a pullback is possible.
Fibonac
High Oil Prices: Who Benefits From This Crisis?Despite rising geopolitical tensions involving Iran , Israel and the US , crude oil prices remain elevated. It makes you wonder, who actually loses, and who benefits?
Saudi Arabia and Russia can earn more from higher oil prices, while Iran may also benefit from every barrel it manages to export. US oil producers gain too, and America has domestic oil production, although higher prices still hurt its consumers. Israel, on the other hand, faces higher energy costs.
Meanwhile, India pays
High Class Option TradingOption Trading
Why Traders Prefer NIFTY Options
High liquidity
Tight bid-ask spread
Smooth price movement
Suitable for scalping and intraday trading
Best Strategy for NIFTY
Trend Following Strategy
Buy CE when:
Price above VWAP
Put writing increases
Resistance breakout confirmed
Crude looks strong.Now a days Crude price is quite Important for Every economy, Because of wars ( straight of hormuz and Russian refinery break down) it is getting more important compere Gold and Silver. As we can see in 1D timeframe chart of Crude we can see Inverse Head and sholder pattern with target of 148$ ( Can go up to 150$ phycologycal leval ), so Breace your self and Get ready for Impect if it successful clear 112-115$ with strong volume.
Brent Crude started to roll over - is this a final top?Brent achieved a little over 78.6% retracement of the previous fall from the war peak in oil prices. Recently, I published an ED pattern on Brent that shows a possible top. Brent has the same pattern on the hourly chart, and it has broken down. On the daily chart, this ED is wave 5 of C, which means that this move higher in Oil could technically be coming to an end. The chart below is a daily chart on an arithmetic scale. On this scale, it is also near the top end of a rising channel. At this le
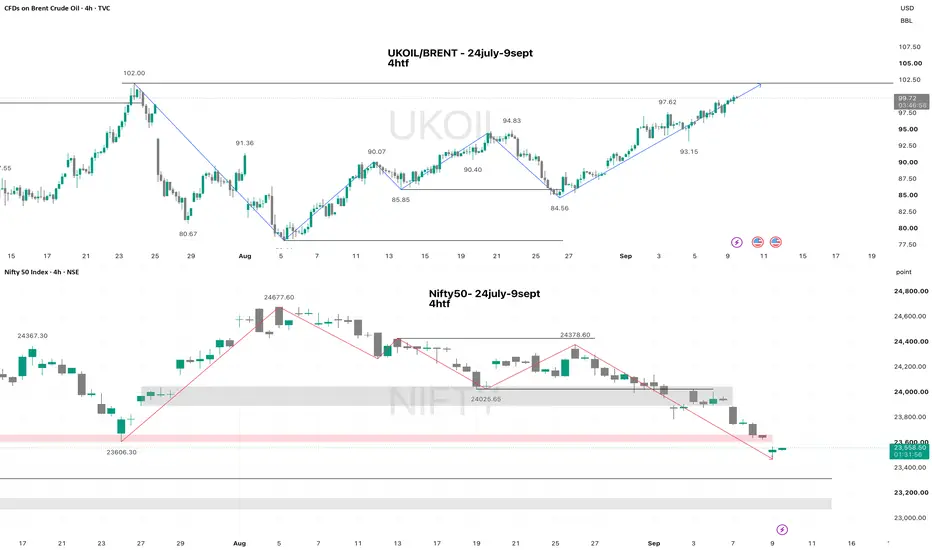
UKOIL/Brent vs Nifty50 - A relationship worth watchingThe relationship between Brent crude and Nifty 50 is quite visible in the recent price action.
Brent had made a major high near 119 in March 2026 and subsequently entered a prolonged decline. During this period, the decline in crude prices provided a supportive backdrop for Indian equities, while Nifty recovered and moved higher.
Now the situation is becoming interesting again.
Brent has recovered sharply and is currently trading around 100, with the recent swing high near 102 acting as an i
Brent Crude Oil –Previous Support Turns Resistance|Key BreakoutBrent Crude Oil – Previous Support Turns Resistance | Key Breakout Zone
Brent Crude Oil is currently trading near the $95–$96 resistance zone which previously acted as an important support level. The chart shows a potential rounded/inverse-base formation , with price once again approaching this key resistance area.
A decisive daily close above $95–$96 could confirm a bullish breakout and potentially open the way towards the next resistance levels:
Key Resistance / Breakout Zone: $95–$96
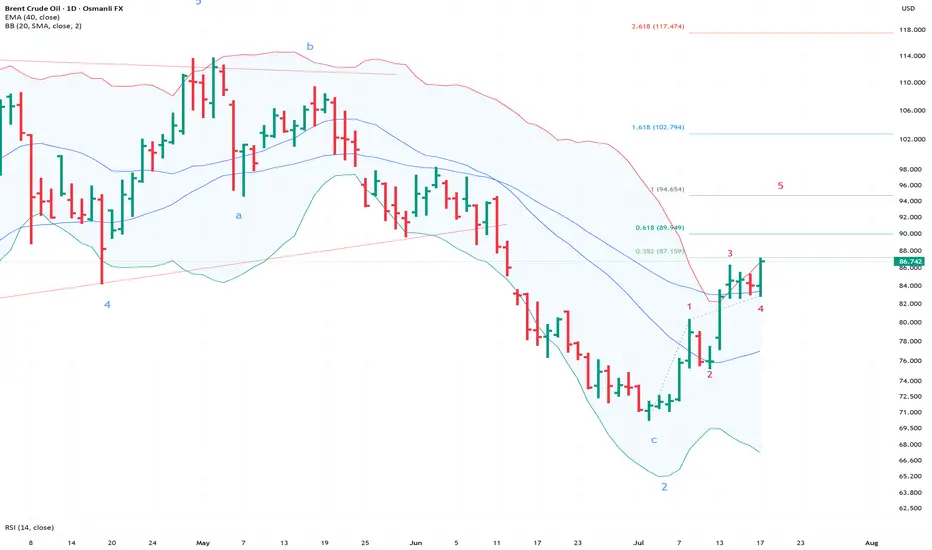
Oil is back on the tableBrent crude's impulsive advance has changed everything. From a wave 2 consolidation, we are back into the possibility of a third-wave advance. The word impulsive refers to the Elliott wave five-wave rise that we see on charts. Five waves up indicate that the trend is up and not down. This means higher levels are possible even after pullbacks. This change in trend, following the recent return to war, shows that the situation is getting worse again and is far from resolved. The world is not exactl
Oil Fell 37% While the Hormuz Blockade Was Still On
OANDA:BCOUSD
The Market Already Faded One Hormuz Blockade.
This Time Is Different - Maybe.
--------------------------------------------------------------------
THE OBSERVATION
Brent peaked near $112 in mid-May. By July 1 it traded at roughly $70.50. That is a 37% collapse in six weeks.
Here is the part worth sitting with: THE BLOCKADE NEVER LIFTED.
The Strait of Hormuz has been contested since late February. Through the entire 37% decline, the disruption was still there. What changed
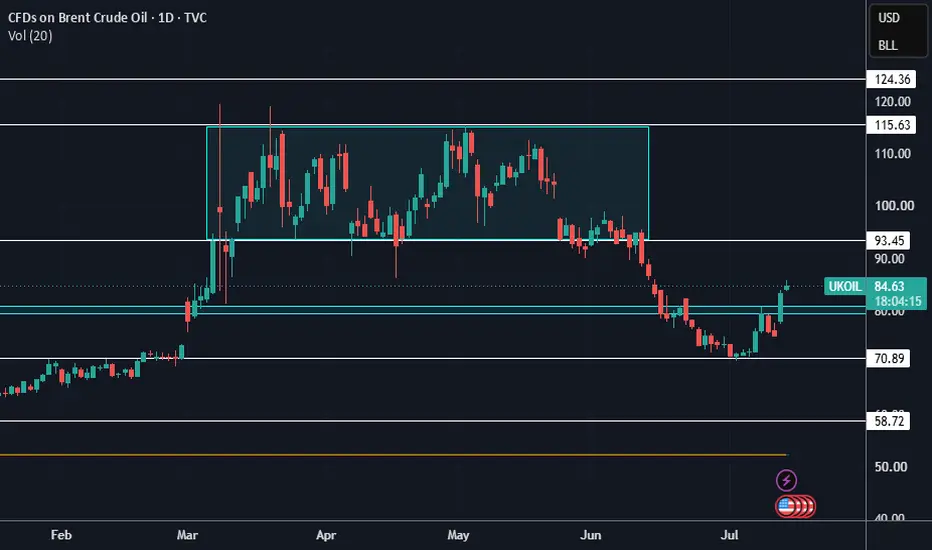
Possible upmove in CrudeCrude closed ~10% higher last day to close above $83, first time in last four weeks, amid the geopolitical tensions. It has closed above the key resistance zone of $80. Hence, I expect a upmove towards $90-92 (previous support zone) from here. Let me know your thoughts. DYOR.
Crude AnalysisThe current ~$80 acted as a resistance multiple times pre-conflict, so I expect it to take some support at the current levels. $70 is a multi-year support level and in fact the recent rally fuelled to $120 after the strong breakout and retest from this level. On the otherside, $92 can continue to act as a resistance level in the near term.
Let me know your thoughts/feedback.
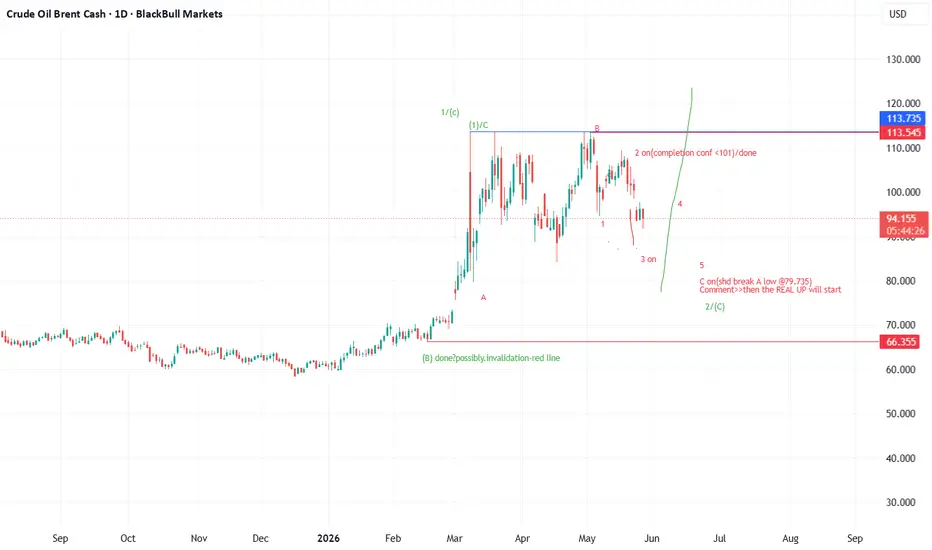
Don;t get fooled by Calm Before The Stormcrude is highly regulated commodity. Everbody wants a piece of the pie making it a slow mover. It has completed wave (B) in almost 3yrs and only 1 of (C) was done. That itself shook the world. Now the genie is out of the bottle....it cannot be re-bottled whatever wishful thinking one can undergo. Wave 2 of (C) will be over around 75 level and then to our utter panic, will go on moving up. ULTIMATELY IT WILL CROSS ATH making us pray for the Dr saab to come back from his Heavenly abode.
STATUTORY
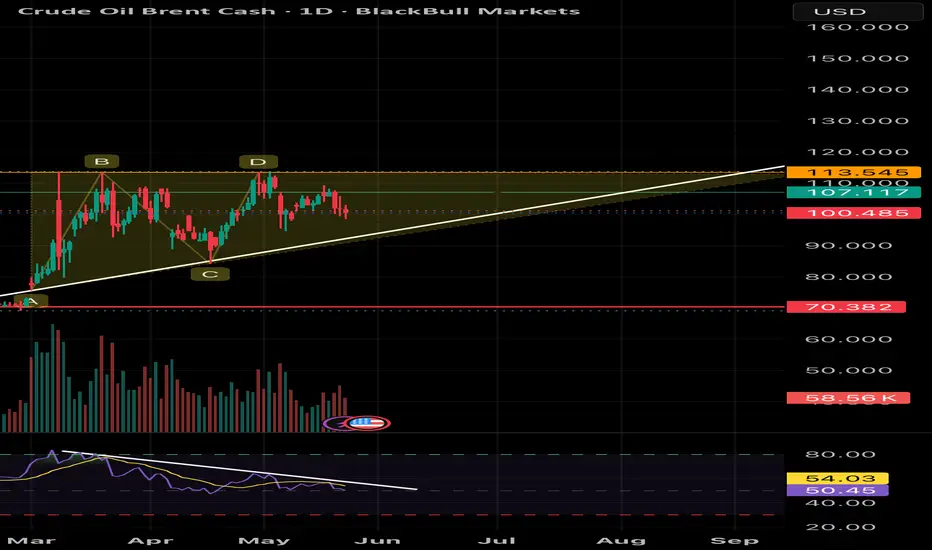
Brent Crude Oil – Daily Time Frame AnalysisBrent Crude Oil – Daily Time Frame Analysis 📊
Brent Crude continues to trade inside a broader bullish structure while respecting a long-term rising trendline from March lows. However, momentum is slowing near the major supply zone around 113–114.
🔹 Key Observations:
• Price is forming higher lows, indicating buyers are still active.
• Strong resistance seen near 113.5 where multiple rejections occurred.
• Current price around 100 is trading close to trendline support.
• RSI shows a mild bearis
Trade Like Institution Part-10Technical analysis is the study of price charts, patterns, and indicators to predict future market movements. It is based on the idea that price reflects all available information.
Core Principles
Price discounts everything
Market moves in trends
History repeats itself
Types of Charts
Line Chart
Bar Chart
Candlestick Chart (most popular)
Important Insight
PCR is not a direct buy/sell signal. It is a contrarian indicator.
Very high PCR → Market may reverse upward
Very low PCR → Market may rev
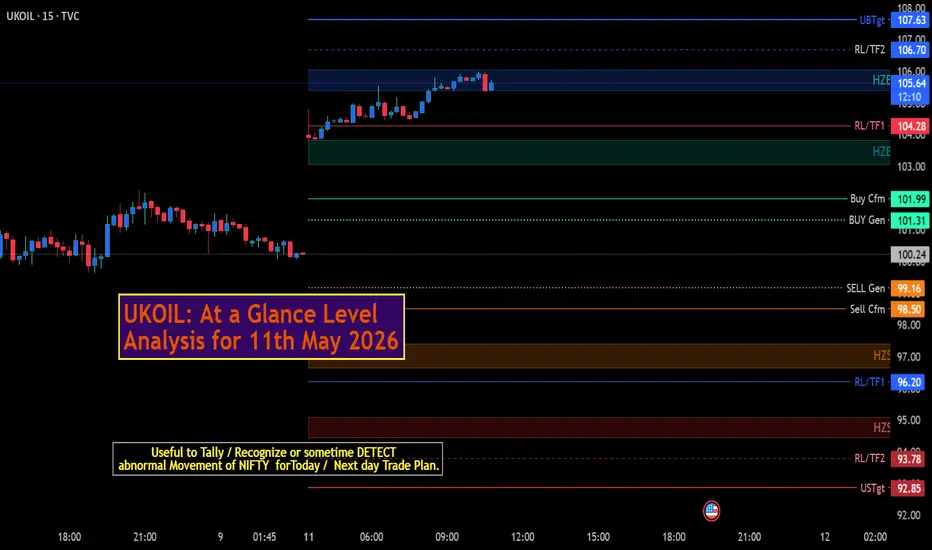
UKOIL: At a Glance Level Analysis for 11th May 2026UKOIL: At a Glance Level Analysis for 11th May 2026
━━━━━🟥🟧🟨🟩🟦🟪⬛━━━━━
💥Level Interpretation / description:
✍🏻L#1: If the candle crossed & stays above the “Buy Gen”, it is treated / considered as Bullish bias.
L#2: Possibility / Probability of REVERSAL near 🔕RLB#1 & 🔔UBTgt
L#3: If the candle stays above “Sell Gen” but below “Buy Gen”, it is treated / considered as Sidewise. Aggressive Traders can take Long position near “Sell Gen” either retesting or crossed from Below & vice-versa i.e.
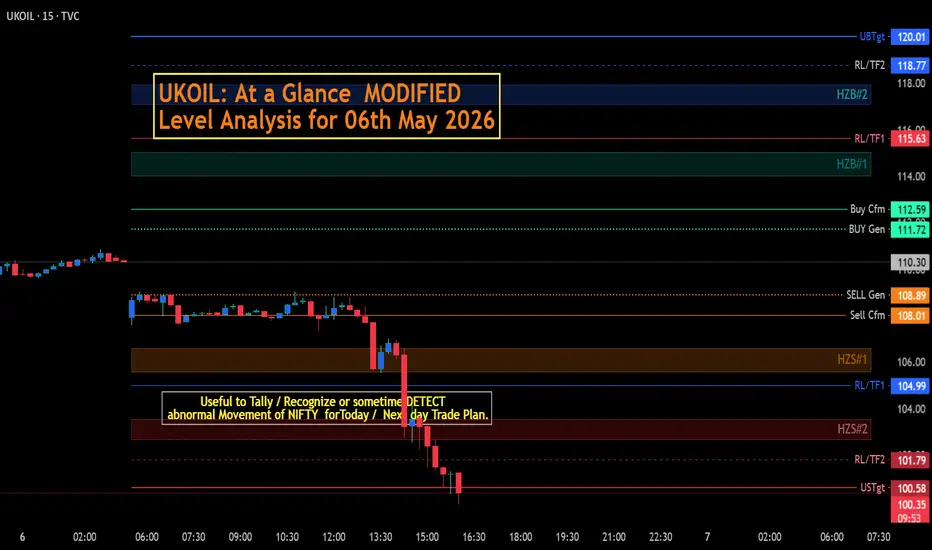
UKOIL: At a Glance MODIFIED Level Analysis for 06th May 2026UKOIL: At a Glance MODIFIED Level Analysis for 06th May 2026
Till now try to bounce chart Lowest level @ 100.72.
━━━━━🟥🟧🟨🟩🟦🟪⬛━━━━━
💥Level Interpretation / description:
✍🏻L#1: If the candle crossed & stays above the “Buy Gen”, it is treated / considered as Bullish bias. Cfm=> Confirmation.
L#2: Possibility / Probability of REVERSAL near 🔕RL/TF1 & 🔔RL/TF2
L#3: If the candle stays above “Sell Gen” but below “Buy Gen”, it is treated / considered as Sidewise. Aggressive Traders can take L
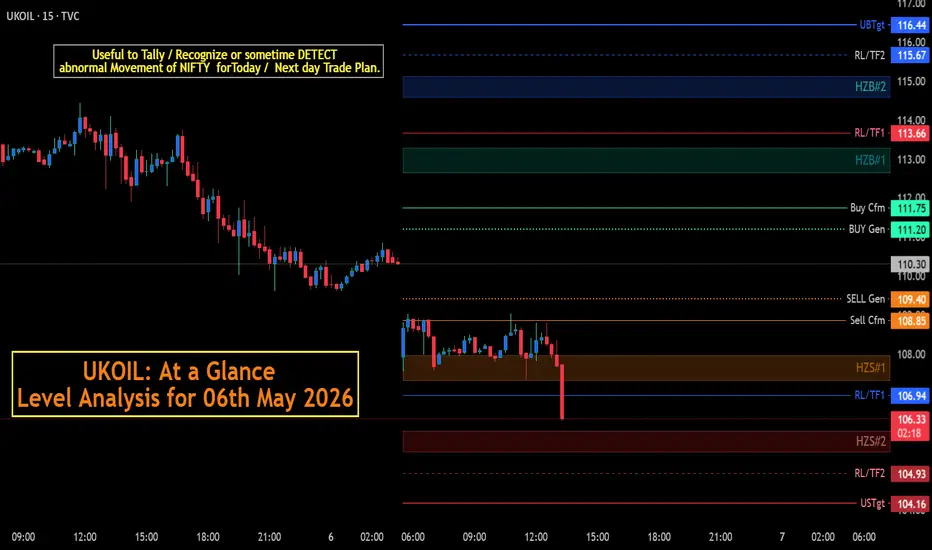
UKOIL: At a Glance Level Analysis for 06th May 2026UKOIL: At a Glance Level Analysis for 06th May 2026
UKOIL in Corrective mode.
━━━━━🟥🟧🟨🟩🟦🟪⬛━━━━━
💥Level Interpretation / description:
✍🏻L#1: If the candle crossed & stays above the “Buy Gen”, it is treated / considered as Bullish bias. Cfm=> Confirmation.
L#2: Possibility / Probability of REVERSAL near 🔕RL/TF1 & 🔔RL/TF2
L#3: If the candle stays above “Sell Gen” but below “Buy Gen”, it is treated / considered as Sidewise. Aggressive Traders can take Long position near “Sell Gen” eithe