Part 1 Support and Resistance Option Pricing – The Greeks
Option pricing is influenced by several factors such as the underlying price, time to expiry, volatility, and interest rates. These factors are represented by “Greeks,” which measure the sensitivity of an option’s price to different variables:
Delta (Δ): Measures how much the option price changes with a ₹1 move in the underlying asset.
Gamma (Γ): Measures the rate of change of Delta — i.e., how stable Delta is.
Theta (Θ): Measures time decay — how much value the option loses each day as expiry nears.
Vega (ν): Measures sensitivity to volatility — how much the option price changes with changes in market volatility.
Rho (ρ): Measures sensitivity to interest rates.
Understanding these helps traders build strategies that match their risk tolerance and market view.
Trade ideas

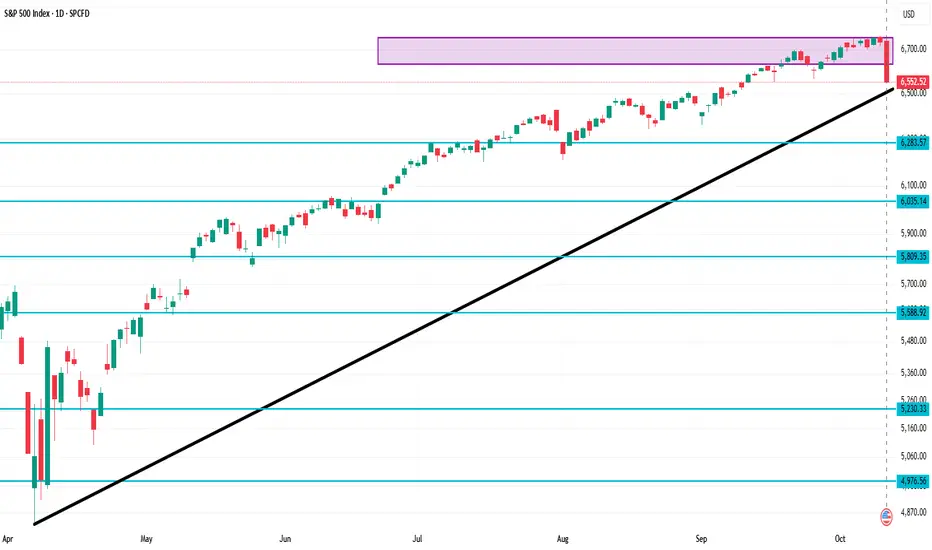
SPX 1 Day Time Frame Earlier today, the index opened at 6,740.49 USD, with a daily high of 6,762.40 USD and a low of 6,550.78 USD.
Key Metrics:
Opening Price: 6,740.49 USD
Day's Range: 6,550.78 – 6,762.40 USD
52-Week Range: 4,835.04 – 6,764.58 USD
Previous Close: 6,735.11 USD
Change: -182.6 USD
% Change: -2.71%
This downturn follows President Trump's recent threats of "massive" tariffs on China, marking the largest single-day loss for the S&P 500 since April 2025.
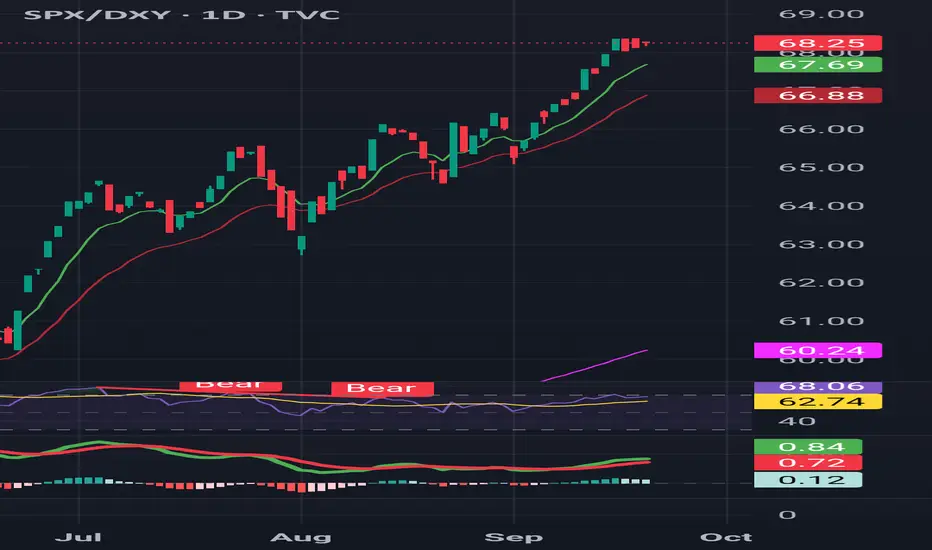
SPY/DXY RATIOSPX/DXY remains at elevated highs, supported by bullish EMA alignment. But RSI has started rolling over, and MACD momentum is flattening.
⚠️ This suggests equities’ relative outperformance over the Dollar may be losing steam. Risk of a near-term pause or pullback is rising.
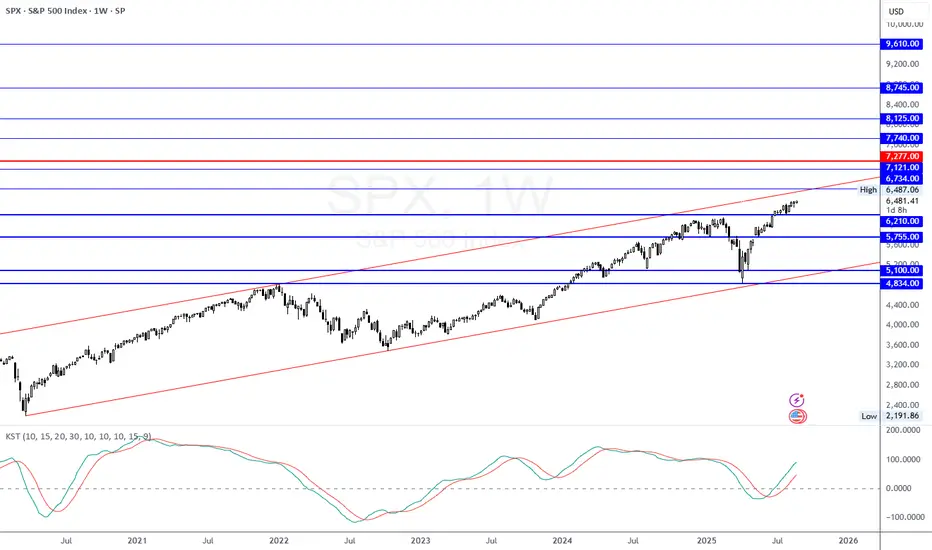
SPX ANALYSIS 28-AUG-2025LTP 6481
Supports: 6210/5755/5100/4834
Upside can be 6734-7121
Immediate Support: 6210
SPX can face some resistance around 7100-7300, where we can see some correction towards 6500/6200 before next bull run towards 7000/8000.
Upside targets: 6734-7121 (min target)
Normal target: 7740-8125
Ultimate target: 8745
Extension: 9610
S&P 500 MARKET SHIFT BEARISHmarket shifted to bearish next liquidity zone is 6300 may be market draw on this price

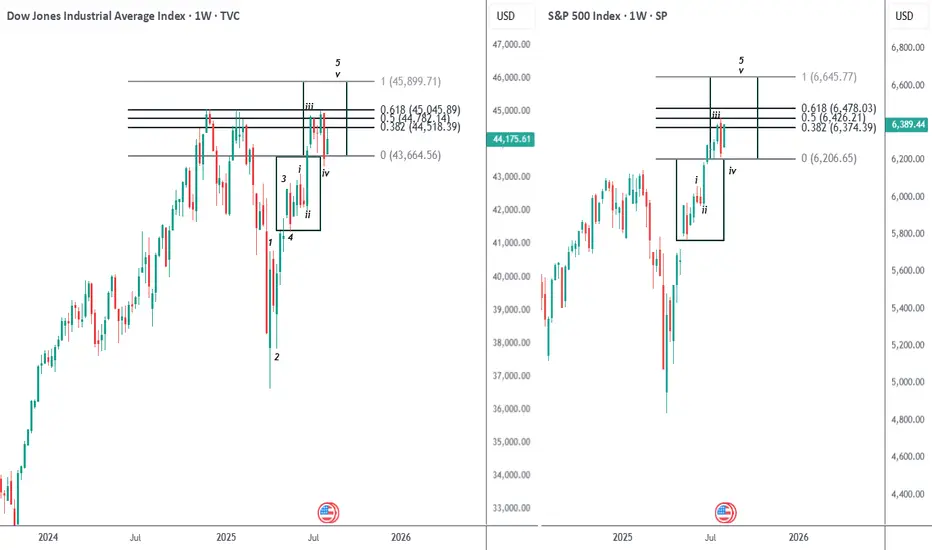
The US Indices nearing strong resistanceDow Jones n S&P 500
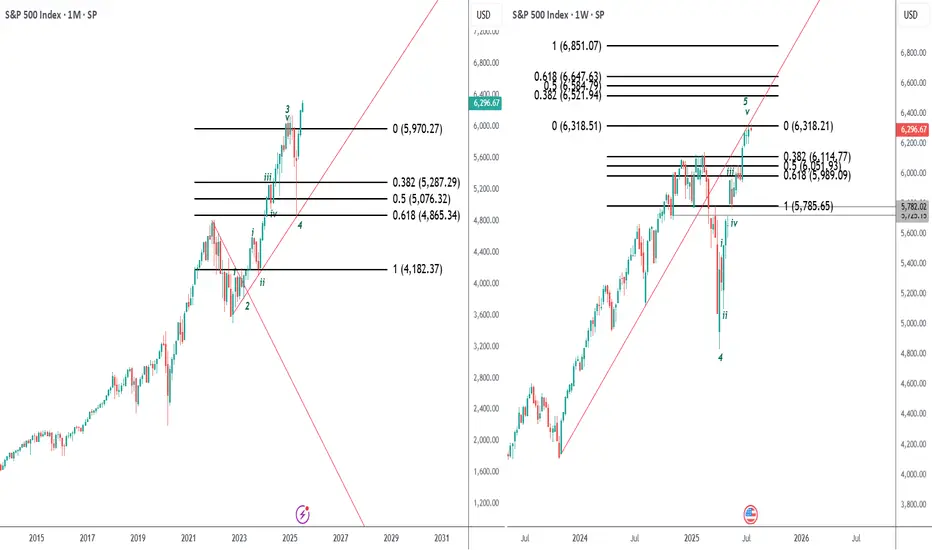
Elliott - this is the 5th wave and the last of the impulse wave of the current swing. The 5th wave has been divided into its own 5 waves. This is the last wave or the vth of 5 in play. The tgt for both of them is some 4% from the CMP.
Conclusion - atleast for a week or two the US indices should keep rallying. This should keep our mkts also hopeful. Use any rally as an opportunity to exit.
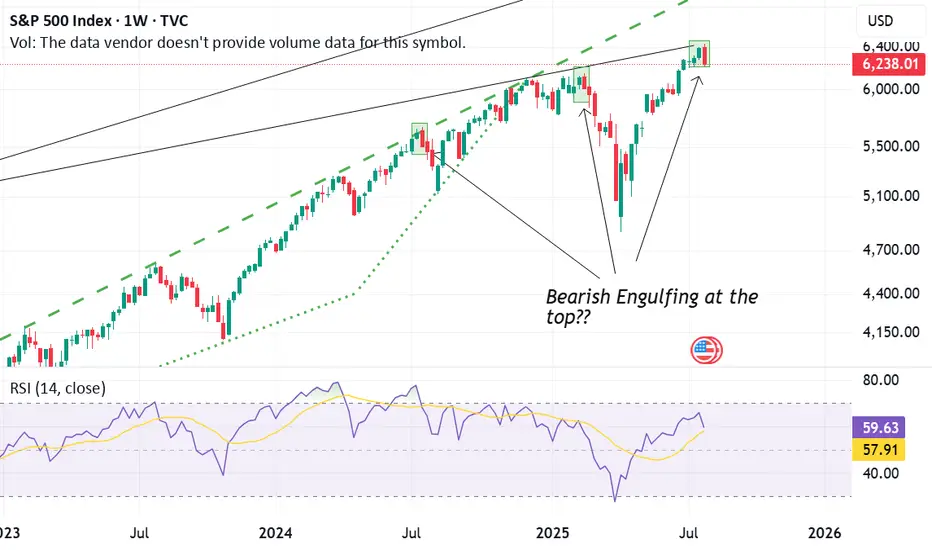
SPX forms a bearish engulfing candle again Last week, the S&P 500 Index (SPX) printed a bearish engulfing candle on the weekly chart. This candlestick pattern occurs when a larger red (bearish) candle completely "engulfs" the body of the previous green (bullish) candle. It is a classic reversal signal, often indicating that the momentum may be shifting from bullish to bearish.
What makes this significant is the recurring pattern we've observed:
At each of the last three market tops, the SPX formed a bearish engulfing pattern—and each time, this was followed by a notable correction or pullback.
The current candle mirrors those past setups almost identically, suggesting that the market may again be vulnerable to a short-term decline.
However, the big question remains:
"Will this time be different?"
In short, the bearish engulfing pattern is a warning sign—especially given its historical reliability at tops—but confirmation is key.
Ask ChatGPT
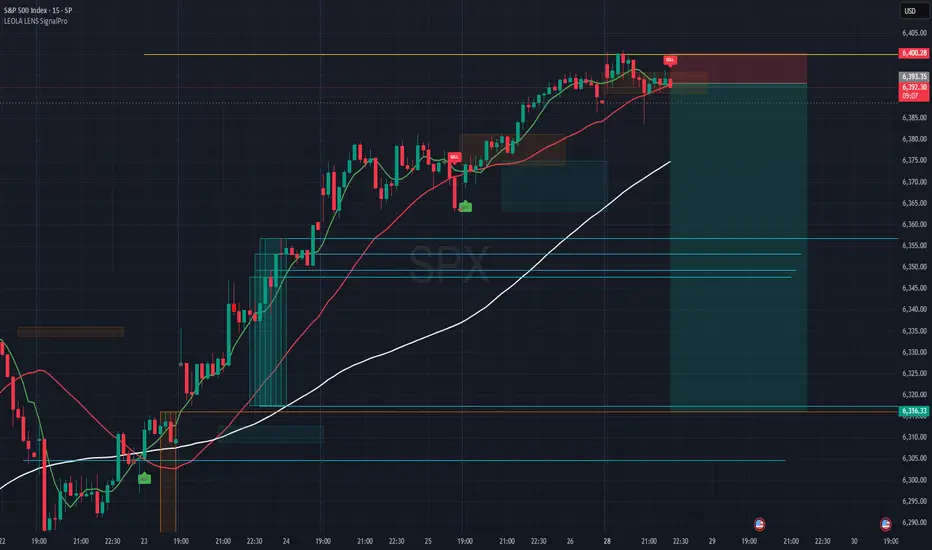
SPX Rejection-Price Stalling Near Psychological Line-Short Mode🔍 Chart Context:
✅ Strong bullish trend earlier, supported by rising moving averages.
⚠️ A single Sell label has now appeared just under the 6400.28 marked resistance.
📏 Price is compressing after the impulse rally, forming potential lower highs.
🟧 Liquidity Control Box suggests recent supply presence in this zone.
🔽 Downside target is aligned with prior accumulation and untested support zones (around 6316.33).
🎯 Intraday Setup Summary:
Entry Bias: Bearish — only valid if price stays below the orange supply zone.
Stop Zone: Above 6400.28 structural resistance.
Target Zone: Testing the next demand cluster around 6316.33 for potential reaction.
🧠 Educational Insight:
This structure showcases how price often pauses or reverses near psychological levels (like 6400), especially when supply zones and exhaustion signals align. Useful for traders who combine momentum with structural bias.
⏱ Timeframe:
15-Minute (Intraday Setup)
The US Indices is at a danger zoneSPX CMP 6339
Elliott- the 5th wave is done now. I have also sub-divided v of 5 in its own 5 waves with a star on the left chart.
Fib Ext - the 5th wave has halted at 1.382 where we also have a trendline resistance.
RSI - the oscillator has again reached the bear zone. Hence now the oscillation will be within the bear zone and this is danger.
Conclusion - the entire process may take some time as the Index has just started to turn down. But one thing for sure the TOP is made. Corrections target the iv wave of 3 hence to me this correction will not get over before 5K which is a good 20% from here.

SPX Supply Rejection-Eyes on 6304SPX shows signs of potential weakness after testing a prior supply zone and failing to sustain higher levels. The current setup anticipates a downward move, supported by structural resistance and liquidity imbalances.
🔍 Chart Highlights:
🟥 Red zone marks supply rejection after a strong upward move.
📦 Liquidity Control Boxes from SignalPro show layered imbalance zones between 6,350–6,310.
🧊 Target marked at 6304, aligned with lower liquidity pocket and recent demand structure.
⚠️ Stop region defined above the rejection high, giving clear invalidation.
📘 Educational Focus:
This trade scenario highlights how to:
Identify potential exhaustion at supply zones
Map liquidity structures using institutional-style tools
Build trade ideas with defined risk-to-reward
Such planning reinforces disciplined trading, especially in high-volume indices like SPX.

US Indices at resistanceS&P 500 CMP 6297
Elliott - this is the 5th wave which is the last of the impulse wave. I have divided the 5th wave into its own 5waves. The 1st wave and the 5th wave are generally equal. Hence the current zone becomes a high probability reversal zone.
Trendline - trendline resistance at the same zone makes it a strong resistance.
Oscillator - the oscillators too are at resistance zone which makes this zone a high prob reversal zone.
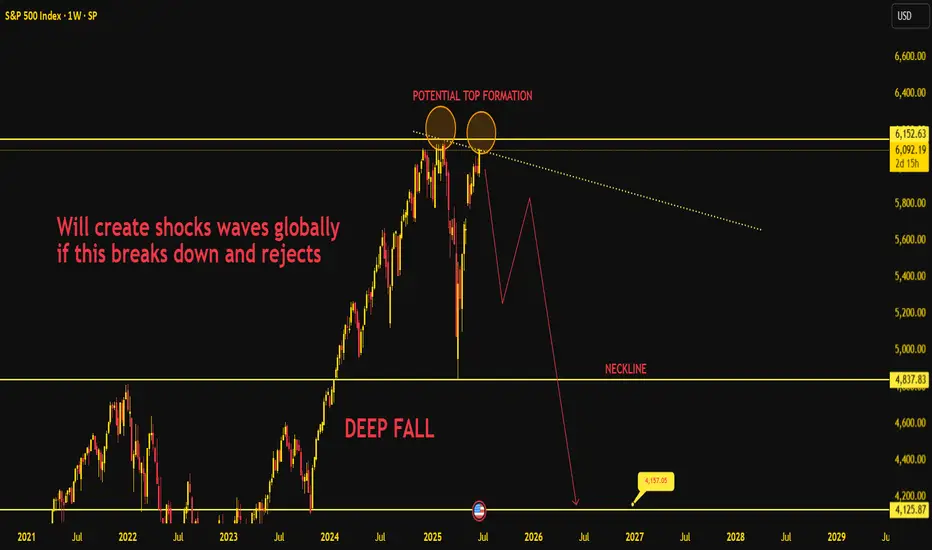
S&P 500 Weekly Macro Structure – In-Depth Breakdown as of June Current Structure & Price action -
The S&P 500 is showing early signs of forming a macro double top, one of the most powerful reversal patterns in Price action when occurring at all-time highs. The zone around 6150–6170 has now been tested twice once in March 2025 and again in June 2025. Each time, the price faced rejection, hinting at buyer exhaustion at the peak.
What makes this chart technically threatening is the alignment of:
A potential double top with weak volume on the second peak.
A visible neckline at 4837, which represents the last zone of strong institutional demand and breakout origin from the October 2023 rally.
Clear visual symmetry between left and right shoulders indicating distribution rather than accumulation.
If price decisively breaks below 4837, we enter a freefall zone, targeting the 4150–4125 range — the next significant structural shelf.
Why This Setup Matters Globally
This is not just a Price action formation; it is a systemic risk signal:
If the S&P 500 cracks, it’ll act as a domino in:
Global equity indices (FTSE, DAX, NIKKEI, NIFTY).
Emerging market outflows (especially BRICS economies).
Commodity repricing (especially metals and crude, due to deflation fear).
Dollar Strength Scenario:
If this fall happens alongside USD strength (which often occurs during flight to safety), it may also lead to:
Emerging market currency devaluation.
Debt servicing problems for dollar-denominated borrowers.
Gold volatility (initial dip, then sharp rise as panic flows in).
Intermarket Readings & Divergences
US10Y Bond Yields: If yields continue to rise while the index weakens, it’s a death cross for growth sectors.
VIX: Still below 20, but any weekly close above 25 during this formation breakdown will trigger full-blown fear cycles.
Tech Stocks: Heavily weighted in the index. If large caps like AAPL, MSFT, NVDA start to fade, this fall will accelerate.
Roadmap Projection
Here’s the expected flow based on current structure:
Fakeout Above 6150 → quick rejection → triggers wave 1 fall.
Bounce from 5500–5600 (psychological + moving average confluence).
Neckline Retest (4837) – critical. If rejected again, freefall starts.
Major demand expected only around 4150–4125, where long-term investors might re-enter.
If neckline breaks with high volume and weekly close below, we could be looking at a 25–30% retracement from the highs.
Macro Echo of Past Crashes?
This pattern closely resembles:
2007–08 double top structure before Lehman.
Dotcom bust in 2000 where euphoria blinded exit signals.
The difference now? AI and tech hype has pushed valuations to unsustainable highs, and central banks are tight, not loose.
🔸 Final Take
This is not a normal pullback. The S&P is on the verge of confirming a generational top, with implications for every asset class. Once 4837 breaks, expect:
Mass volatility in global markets
Flight to cash and gold
Repricing of risk premiums
Action Plan:
If holding longs – reduce exposure, raise stop-losses.
Hedge via VIX calls or inverse ETFs.
Watch for a weekly rejection candle at 6150 to trigger confirmation.
This chart is a time bomb. The wick is lit.
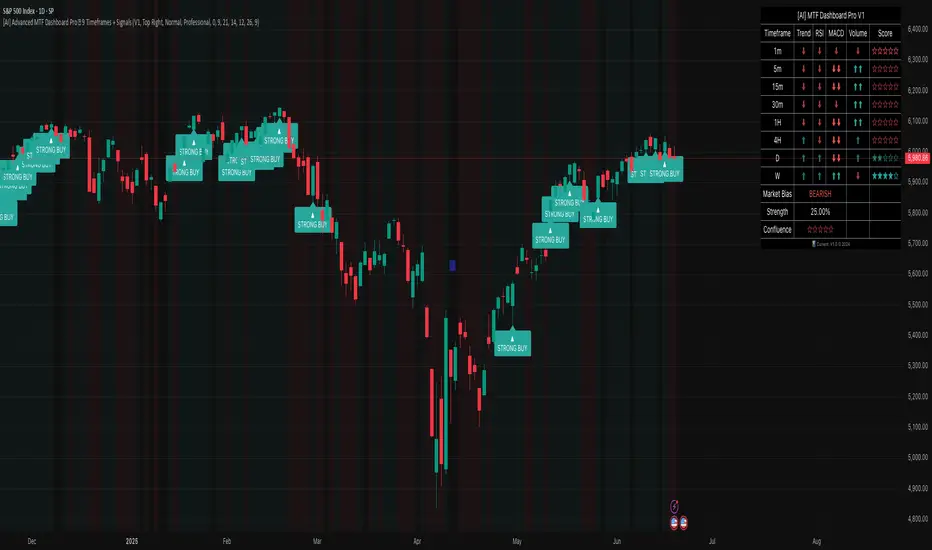
[AI] Advanced MTF Dashboard Pro █ 9 Timeframes + Signals# 🚀 Advanced MTF Dashboard Pro █ 9 Timeframes + Signals
## The Ultimate Multi-Timeframe Analysis Dashboard - See Everything at a Glance!
Transform your trading with the most comprehensive MTF dashboard on TradingView. This professional-grade tool analyzes 9 timeframes simultaneously, giving you instant market insights that would normally require multiple charts and hours of analysis.
---
## ⚡ KEY FEATURES
### 📊 **9-Timeframe Analysis**
✅ **Complete Coverage** - 1m, 5m, 15m, 30m, 1H, 4H, Daily, Weekly, Monthly
✅ **Toggle Control** - Show only the timeframes you need
✅ **Real-Time Updates** - All data refreshes automatically
✅ **Clean Organization** - Professional table layout
✅ **Smart Positioning** - Place dashboard anywhere on chart
### 🎯 **Multi-Indicator Analysis Per Timeframe**
✅ **Trend Direction** - EMA cross-based trend detection
✅ **RSI Momentum** - Overbought/oversold conditions
✅ **MACD Signals** - Histogram direction and strength
✅ **Volume Analysis** - Above/below average volume
✅ **Confluence Score** - Combined signal strength rating
### 💎 **Advanced Signal System**
✅ **Visual Status Indicators**
- ⬆⬆ Strong Bullish
- ⬆ Bullish
- ➡ Neutral
- ⬇ Bearish
- ⬇⬇ Strong Bearish
✅ **Confluence Ratings**
- ★★★★★ Excellent Setup
- ★★★★☆ Strong Setup
- ★★★☆☆ Good Setup
- ★★☆☆☆ Fair Setup
- ★☆☆☆☆ Weak Setup
### 📈 **Market Analysis Dashboard**
✅ **Overall Market Bias** - Instant bullish/bearish/neutral assessment
✅ **Bias Strength %** - Quantified market direction strength
✅ **Confluence Score** - Overall setup quality rating
✅ **Trend Alignment** - See when multiple timeframes agree
✅ **Smart Filtering** - Focus on high-probability setups
### 🔔 **Professional Alert System**
✅ **Strong Signal Alerts** - When confluence is extremely high
✅ **Bias Change Alerts** - Market direction shifts
✅ **Custom Messages** - Detailed alert descriptions
✅ **Multi-Timeframe Alerts** - Know which timeframes triggered
✅ **Smart Frequency** - No alert spam
### 🎨 **Customization Options**
✅ **4 Color Schemes** - Professional, Classic, Vibrant, Dark
✅ **6 Table Positions** - Top/Bottom/Middle + Left/Right
✅ **4 Text Sizes** - Tiny to Large
✅ **Toggle Features** - Show/hide any component
✅ **Visual Preferences** - Background colors, signals, etc.
---
## 🎯 PERFECT FOR
• **Multi-Timeframe Traders** - See all timeframes without switching
• **Confluence Traders** - Find high-probability aligned setups
• **Day Traders** - Quick market assessment for entries
• **Swing Traders** - Identify major trend alignments
• **Scalpers** - Spot micro-trends within larger trends
---
## 📱 WORKS ON ALL MARKETS
✅ **Forex** - All currency pairs
✅ **Crypto** - Bitcoin, Ethereum, all altcoins
✅ **Stocks** - Individual stocks and ETFs
✅ **Indices** - S&P 500, NASDAQ, etc.
✅ **Commodities** - Gold, Oil, Silver
✅ **Futures** - All futures contracts
---
## ⚙️ QUICK START GUIDE
### 1️⃣ **Add to Chart**
Click "Add to Favorites" and apply to any chart
### 2️⃣ **Configure Timeframes**
- Toggle ON the timeframes you trade
- Toggle OFF timeframes you don't need
### 3️⃣ **Customize Appearance**
- Choose your color scheme
- Select table position
- Adjust text size for your screen
### 4️⃣ **Interpret Signals**
- **Green rows** = Bullish timeframes
- **Red rows** = Bearish timeframes
- **More arrows** = Stronger signals
- **More stars** = Better confluence
### 5️⃣ **Set Alerts**
Right-click indicator → "Add Alert" → Choose conditions
---
## 📚 TRADING STRATEGIES
### **Strategy 1: Confluence Trading**
1. Wait for 70%+ timeframes to align (same direction)
2. Enter when confluence score shows ★★★★ or better
3. Use lower timeframe for precise entry
4. Higher timeframes for trend direction
### **Strategy 2: Timeframe Divergence**
1. Look for lower TFs turning while higher TFs trend
2. Potential reversal when multiple TFs flip
3. Confirm with volume increase
4. Best at major support/resistance
### **Strategy 3: Momentum Alignment**
1. All momentum indicators (RSI/MACD) align
2. Volume confirms direction
3. Enter on pullback to moving average
4. Exit when momentum diverges
---
## 🛠️ INDICATOR SETTINGS EXPLAINED
### **Timeframe Selection**
Each timeframe can be toggled on/off. Only active timeframes:
- Appear in the dashboard
- Count toward confluence
- Trigger alerts
### **Indicator Parameters**
- **Fast/Slow EMA**: Trend detection sensitivity (9/21 default)
- **RSI Length**: Momentum period (14 default)
- **MACD Settings**: Signal generation (12/26/9 default)
### **Visual Settings**
- **Table Position**: Where dashboard appears
- **Text Size**: Readability adjustment
- **Color Scheme**: Match your chart theme
### **Signal Settings**
- **Show Trend Strength**: Display trend indicators
- **Show Momentum**: RSI/MACD columns
- **Show Volume**: Volume analysis column
- **Show Confluence**: Star rating column
---
## 🌟 WHY CHOOSE ADVANCED MTF DASHBOARD PRO?
### **🤖 AI-Enhanced Analysis**
Our algorithms intelligently weight signals based on timeframe importance and market conditions, providing more accurate confluence scores than simple averaging.
### **⚡ Lightning Fast**
Optimized code ensures smooth performance even with all 9 timeframes active. No lag, no delays, just instant insights.
### **👁️ See Everything**
Stop switching between charts. One glance shows you everything you need to make informed trading decisions.
### **🎯 Precision Timing**
Identify the exact moment when multiple timeframes align for the highest probability trades.
### **📈 Proven Results**
Based on professional trading techniques used by institutional traders, now accessible to everyone.
---
## 💡 PRO TIPS
1. **Higher Timeframes = Stronger Trends** - Give more weight to 4H/Daily/Weekly
2. **Confluence is Key** - Best trades have 80%+ timeframe agreement
3. **Volume Confirms** - Look for volume spikes with signal alignment
4. **Patience Pays** - Wait for ★★★★★ setups for best results
5. **Risk Management** - Even perfect setups can fail, always use stops
---
## 🎯 ADVANCED USAGE
### **For Scalpers**
- Focus on 1m, 5m, 15m
- Quick confluence checks
- Rapid signal changes
### **For Day Traders**
- Use 5m to 1H primarily
- 4H for overall bias
- Balance speed with reliability
### **For Swing Traders**
- Emphasize 4H, Daily, Weekly
- Monthly for major trend
- Slower but more reliable signals
---
## 📞 SUPPORT & COMMUNITY
- 💬 **Comments Section** - Ask questions below
---
## ⚠️ RISK DISCLAIMER
Trading involves substantial risk of loss. Past performance does not guarantee future results. This indicator is for educational purposes and should not be considered financial advice. Always do your own research and use proper risk management.
---
## 🔄 VERSION HISTORY
**v1.0** (Current)
- Initial release
- 9 timeframe analysis
- 4 indicators per timeframe
- Confluence scoring system
- Full alert integration
- 4 color schemes
---
## 🙏 CREDITS
Inspired by institutional multi-timeframe analysis techniques
---
**🏷️ TAGS**
#MTF #MultiTimeframe #Dashboard #Confluence #TrendAnalysis #Momentum #RSI #MACD #Volume #DayTrading #SwingTrading #Scalping #Forex #Crypto #Stocks #TechnicalAnalysis #TradingDashboard #MarketAnalysis #AI #Signals
---
### ⭐ If this dashboard helps your trading, please leave a like and share your experience in the comments!
### 🚀 Click "Add to Favorites" to start seeing the market like never before!
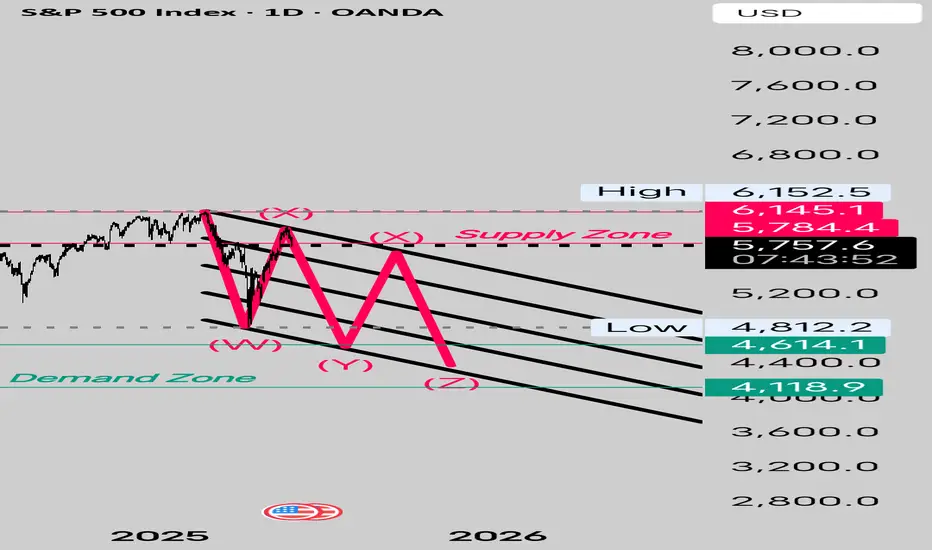
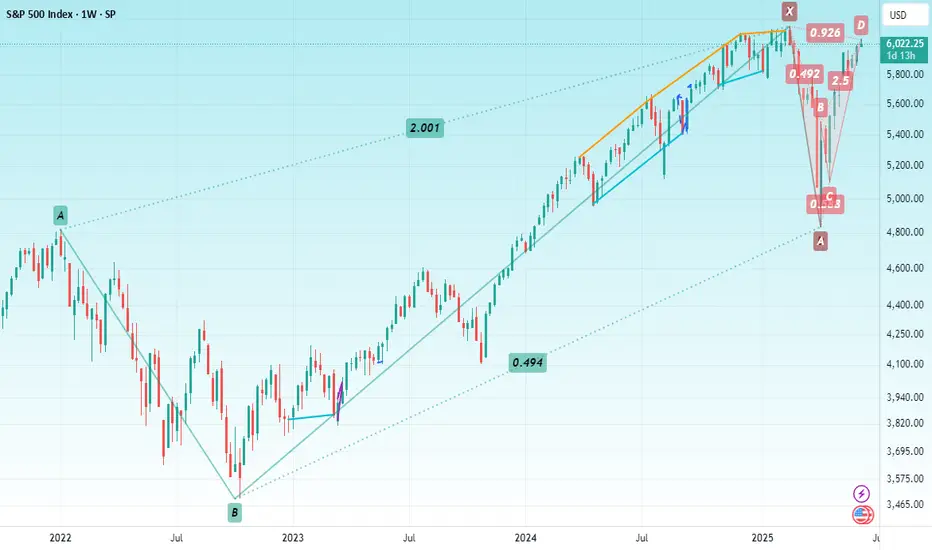
SPX500 Ready for Wave C of The Triple Combo Elliot waves
SPX500 Has rejected from Supply Zone at 0.854 Fib retracement
These are the Marked Circles from where some Bounces are expected.
Though less likely to be meaningful.
Fib Extensions Suggest the Wave C could upto 4300. Finally Testing the Demand Zone.
S&P 500Hello & welcome to this analysis
After making a monthly time frame Bullish Harmonic Reciprocal ABCD in April, the index has now formed a Bearish Harmonic Bat in daily time frame.
A pullback till 5800 - 5750 should not be ruled out as long as its below 6100
All the best
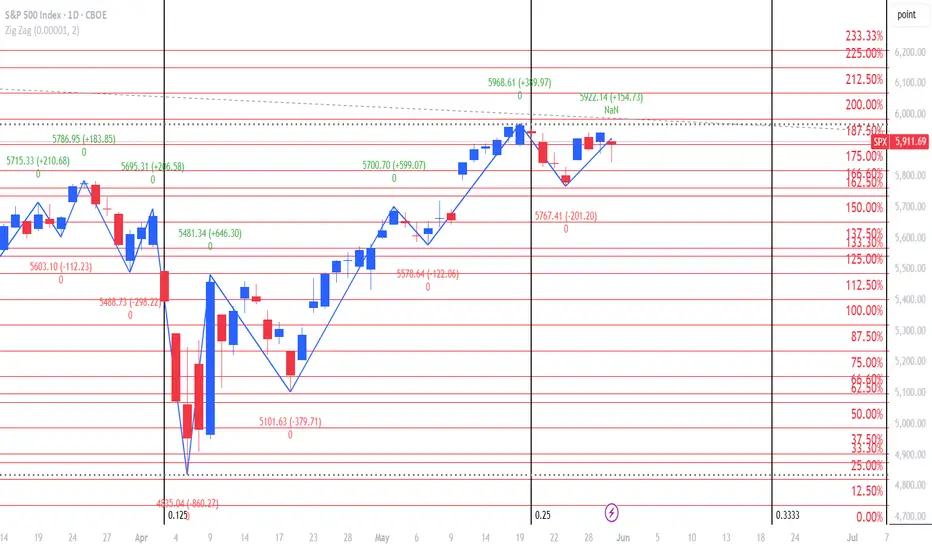
SPX DAILY GANN ANALYSIS UPDATED 31 MAY 2025...We got low near the pressure date in April 2025 4738.40 was the level to watch . We got low near 4835.04 near the pressure date. First target of 5487.60 was achieved within 2 days. Actual high was 5481.34. Next target was 5988.64 which was achieved near the May 2025 pressure date. Actual high of May 2025 was 5968.61. Level to watch here for uptrned to continue is 5824.56. Momentum can be seen only above levl of 6153.72. Next pressure date id 20 June 2025.
Happy Trading !!!
SPX GOAL FOR TADAY I this is where spx gonna fight at these area stay keep tight SL and trail win to the moon and enter with high lot and enjoy the profit ,
happy Friday every one
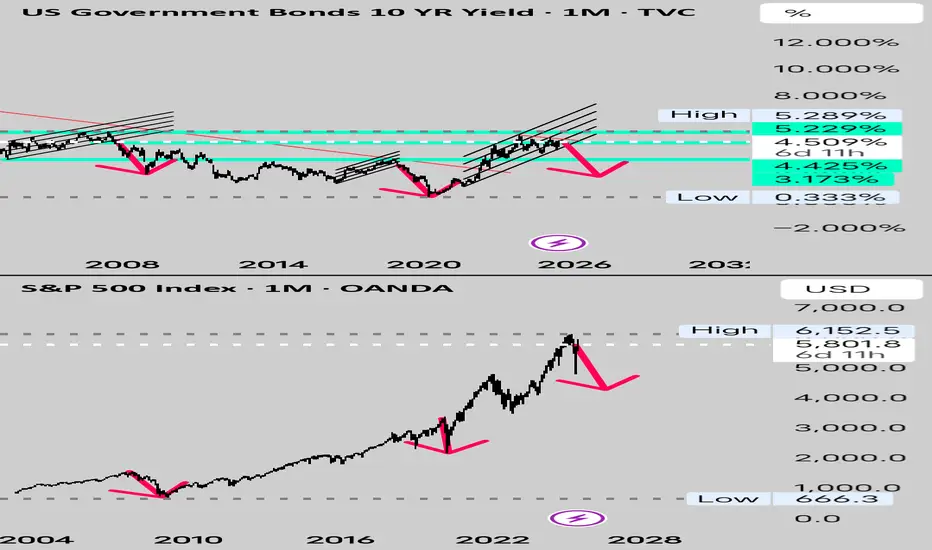
10 Year US Government Bonds Looking Attractive.The relationship between bond yields and interest rates is inversely proportional:
- **When interest rates rise**, existing bond prices typically fall, leading to higher yields. This is because new bonds are issued at the higher rates, making existing bonds with lower rates less attractive unless their prices decrease.
- **When interest rates fall**, existing bond prices typically rise, leading to lower yields. This is because existing bonds with higher rates become more attractive relative to new bonds issued at the lower rates.
With the Quantitative Tightening, we witnessed the rise in Bond Yeilds.
Currently we are in high interest rate environment and with Quantitative easing in process.. People are going lock in the high interest bonds dropping the Yeilds in the Process.
2008 2020 witnessed decent correction with the Drop in Yeilds.
It Remains to be seen if History repeats itself. And When..
SPX/ NDX/ DJI - Elliot Wave - Change in CountsI have expected May 8th as the top of the pullback in this post:
However, it seems that there were more legs pending.
View still remains that this is a counter trend rally, and we will eventually head down again.
We are in 3rd of C and we will get another move up in 5th, which should mark the end of the entire leg up.
If I am invested in US markets - I would use this rally to book profits!
View is similar in Nasdaq and DJI, so not sharing those charts again. :)
All the best!

SPX - Elliot Wave Update -PullBack Over - Time for next leg downSPX has pulled back in an ABC with 5th of C going on today.
Good time to short and ride at least 10%, if lucky 15-20% :)
All the best!
S&P 500 Bearish Reversal Setup: Short Entry Below Key ResistanceEntry Point: Around 5,678.79
Stop Loss: Around 5,833.61 (above recent resistance zone)
Target Point: Around 4,831.37 (indicating a bearish target)
2. Technical Patterns:
The price hit a resistance zone (highlighted in purple) and reversed—this is often a bearish signal.
The trendline break (marked with the orange dot and blue arrow down) suggests a potential trend reversal.
The moving averages (likely 50 EMA and 200 EMA) indicate the price is still above the support zone but weakening.
3. Risk/Reward Ratio:
Risk (Stop Loss – Entry): ~154.82 points
Reward (Entry – Target): ~847.42 points
Risk/Reward Ratio: Approximately 1:5.5, which is favorable for shorting.
4. Trade Sentiment:
Bearish bias based on the breakdown from the resistance zone and confirmation from chart patterns.
If the price fails to hold above 5,682.87, a short trade may be validated with the target at 4,831.37.

Professional Trade Analysis: S&P 500 Index (SPX) – Swing Trade SChart Overview
Your chart shows the S&P 500 Index (SPX) on a daily timeframe with:
Recent strong bullish candles
Price reclaiming above short-term moving averages
RSI and MACD indicators showing bullish momentum
Well-marked support/resistance zones
Current Market Structure
Trend: The index is bouncing from a recent low, showing a potential trend reversal or strong corrective rally.
Support Zone: Around 5,250–5,300 (recent swing low and demand zone)
Resistance Zone: Around 5,800–5,900 (previous supply zone and near the upper edge of your marked green box)
Entry: Price is currently near 5,686, above the moving averages, confirming bullish momentum.
Suggested Swing Trade Plan
1. Bullish Bias (Long Position)
Entry: Around current price (5,650–5,700), ideally on a minor pullback to the 5,600–5,650 area for better risk/reward.
Stop Loss: Below recent swing low or the lower edge of your marked red box (around 5,425–5,450).
Target: 5,800–5,900 (upper resistance zone).
Rationale:
Strong bullish momentum, confirmation from RSI and MACD.
Price action has broken above moving averages.
Clear swing structure with defined risk and reward.
2. Bearish Bias (Short Position)
Consider only if: Price shows strong rejection at 5,800–5,900 with bearish reversal candlesticks or negative divergence on RSI/MACD.
Entry: Near 5,850–5,900 (if reversal signs appear).
Stop Loss: Above 5,950.
Target: Back to 5,600–5,650.
Key Professional Tips
Wait for Confirmation: If entering long, wait for a minor pullback or bullish reversal candle near support.
Risk Management: Risk no more than 1–2% of your capital per trade.
Monitor Indicators: Watch for RSI overbought/oversold and MACD crossovers for early exit signals.
Adjust Stops: Trail your stop-loss as price moves in your favor to lock in profits.
News Awareness: Be aware of any major economic events or earnings that could impact volatility.
Summary Table
Direction Entry Zone Stop Loss Target Zone Rationale
Long 5,650–5,700 5,425–5,450 5,800–5,900 Bullish momentum, trend reversal
Short* 5,850–5,900 5,950 5,600–5,650 Only on bearish reversal signal
*Short only if reversal is confirmed at resistance.
Final Note
Your setup is solid for a swing trade. Stick to your plan, manage risk, and let the price action guide your decisions. Happy trading! 🚀
If you want analysis on other instruments or more trade ideas, let me know!
S&P 500 Index Futures (ES)
Highly liquid and volatile, ideal for swing trading both bullish and bearish trends.
Strong, well-defined support and resistance zones.
Broad market exposure with frequent swings, making it suitable for price action strategies
