NZD USD Weekly analysis (18-05-25 to 24-05-25)📊 Technical Analysis (4H Chart – AUD/USD)
Current Price: ~0.6403
AUD/USD is showing signs of a potential bearish continuation after a short-term bounce or liquidity sweep.
🔍 Key Technical Observations:
Resistance Zone:
• 0.6435 – 0.6455: Ideal area to look for rejection
Support Zones / Targets:
• 0.6370 – 0.6350 (first downside target)
• Extended downside toward 0.6330 if momentum builds
The green projection path implies:
Minor bullish correction
Rejection from resistance
Bearish continuation toward new lows
🟡 Bias:
Bearish Below 0.6450.
A clean rejection from the marked resistance zone could trigger a strong downside push.
A close above 0.6460 would invalidate this structure.
🌍 Fundamental Outlook for the Week (13–17 May 2025)
🇦🇺 1. RBA on Hold, Economy Softens
The RBA has paused rate hikes, citing weakened domestic growth.
This may continue to pressure AUD if U.S. data stays firm.
🇺🇸 2. Strong USD Outlook
USD remains firm thanks to persistent hawkish Fed tone and solid U.S. job data.
Aussie struggles when global risk sentiment dips or U.S. yields rise.
📅 3. Key Events to Watch:
Australia Employment Data (May 21) – A soft print could trigger downside
US PMI and Durable Goods (May 23–24) – Strong data = AUD bearish
✅ Conclusion
AUD/USD likely to retest 0.6370 – 0.6350 after rejecting 0.6435–0.6455.
This week could bring a fake-out pump before the real move down. Stay alert for bearish rejections and use tight risk management.
Trade ideas

ictHi I'm a forex hunter audusd symbol analysis we have an important situation here called a reversal pattern there is a possibility of support in this area

AUDUSD MULTI TIME FRAME ANALYSISHello traders , here is the full multi time frame analysis for this pair, let me know in the comment section below if you have any questions , the entry will be taken only if all rules of the strategies will be satisfied. wait for more price action to develop before taking any position. I suggest you keep this pair on your watchlist and see if the rules of your strategy are satisfied.
🧠💡 Share your unique analysis, thoughts, and ideas in the comments section below. I'm excited to hear your perspective on this pair .
💭🔍 Don't hesitate to comment if you have any questions or queries regarding this analysis.

AUD USD Weekly analysis (10-05-25 to - 17-05-25)📈 Technical Analysis – AUD/USD (4H Chart)
Current price: 0.64113
Your chart indicates:
A bullish reversal from the recent low
Price likely to push higher toward 0.64600–0.64800
The upward arrow and timing (near U.S. data release) suggests anticipation of USD weakening or risk-on rally
Pattern:
The pair appears to be forming a higher low
A breakout above 0.64350 could trigger momentum buying
🌐 Fundamental Drivers – AUD/USD
🇦🇺 Australia Side
Jobs data due May 16 – expected to show moderate growth
RBA maintains a neutral to slightly hawkish stance due to persistent services inflation
🇺🇸 US Side
CPI data (May 15) and Retail Sales (May 16) are key
If CPI is cooler than expected, the USD could weaken, pushing AUD/USD up
✅ Conclusion
Your forecast suggests a bullish setup with a possible push toward 0.64800 if AUD holds above 0.63900 and macro data aligns (especially if USD weakens post-CPI). Look for confirmation through a clean break above 0.64350. A dovish Fed or strong AU jobs data would fuel the move.

AUD/USD Weekly analysis (04-05-25 to - 10-05-25)🟨 AUD/USD
Move: AUD/USD may dip to support near 0.6315 before rebounding sharply.
Reason: Market awaits key U.S. data; short-term USD strength could fade quickly.
Outlook: Rejection from the demand zone could lead to a bullish breakout above 0.6500.
Next Week: Watch for bullish reversal signals between 0.6320–0.6350 for a long entry setup.

AUDUSD Bullish Breakout and Retest Setup (2H Timeframe)🧾 Pair: AUDUSD
Timeframe: 2-Hour
Bias: Bullish
Strategy Type: Breakout + Retest + Imbalance Fill + Supply Targeting
📊 Market Structure Analysis:
AUDUSD was consolidating in a range for several days between approximately 0.6380 and 0.6435.
A clean bullish breakout has now occurred, breaking above the resistance zone around 0.6435–0.6440.
Price is retesting the broken resistance, which aligns with a fresh demand zone (newly formed OB).
A minor imbalance below price is being tested as price retraces, creating a healthy structure for a potential continuation move.
The target zone is a higher timeframe supply zone (~0.6525–0.6535), which has not been tested recently and offers clean RR.
📍 Key Levels:
Demand Zone (Entry Area): 0.6440 – 0.6428
Imbalance Fill Support: 0.6428
Target Supply Zone: 0.6525 – 0.6535
Current Price: 0.6445 (hovering around entry zone)
🎯 Trade Plan:
Entry: 0.6440 (after confirmation of bullish rejection from demand zone)
Stop Loss: 0.6420 (below imbalance + invalidation of bullish order block)
Take Profit: 0.6527 (prior supply zone)
Risk-to-Reward (R:R): ~1:4
✅ Confluences Supporting the Setup:
✅ Breakout of Consolidation Range (classic breakout structure).
✅ Retest of previous resistance as support, confirming the breakout.
✅ Newly formed bullish OB in the retest zone.
✅ Imbalance zone below adds magnetism and builds confluence.
✅ Clear upside target at clean supply (unmitigated).
✅ Momentum candle breakout suggests strong bullish intent.
⚠️ Invalidation Criteria:
If price breaks and closes below 0.6420, the bullish structure is broken.
Be cautious around high-impact USD news (NFP, FOMC, CPI), which could cause liquidity spikes.
💡 Pro Tip:
If unsure about direct entry, look for 15M–1H bullish CHoCH (change of character) or bullish engulfing candle confirmation in the OB zone for a lower-risk entry.
📘 Summary:
Direction: Long
Zone of Interest: 0.6440 – 0.6428 (demand + OB)
Target: 0.6525 – 0.6535 (clean HTF supply)
Risk-Reward: Excellent (1:4+)

AUDUSDPrice action trading is a methodology where traders make decisions based on the interpretation of actual price movements on a chart, rather than relying primarily on lagging indicators. It involves observing and analyzing candlestick patterns, trend lines, support and resistance levels, and volume to identify potential trading opportunities and manage risk. The focus is on understanding the story the market is telling through its price behavior.

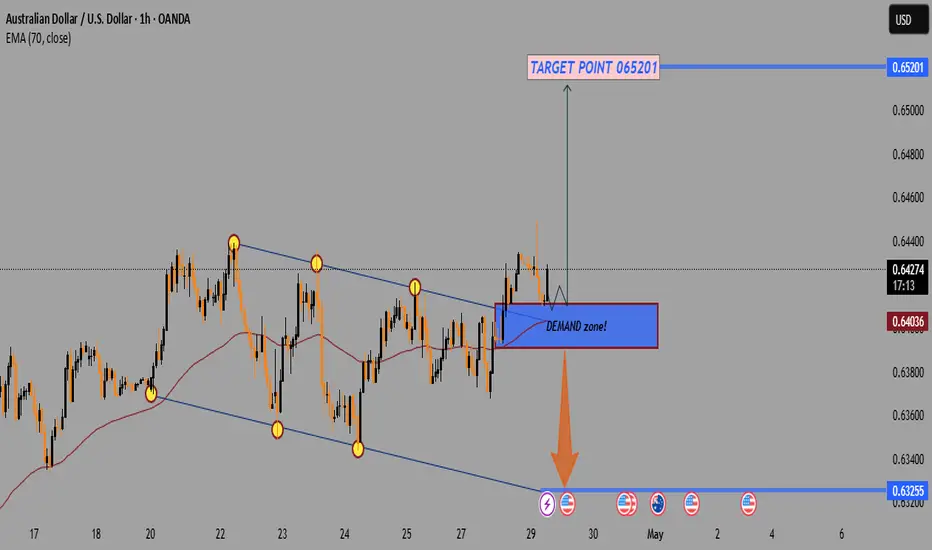
AUD/USD Bullish Breakout – Demand Zone Retest Before Targeting 📉 Chart Pattern:
🔻 Formed a descending wedge/channel pattern (yellow dots).
💥 Recently broke out upward — this is typically a bullish signal!
📦 DEMAND Zone (Support):
📘 Blue box labeled “DEMAND zone!” shows a strong area of buyer interest.
🔁 Price is currently retesting this zone — a healthy move after breakout.
✅ Holding this zone could confirm bullish continuation.
🎯 Target Point:
🚀 Marked at 0.65201 — labeled "TARGET POINT 065201".
📏 Measured move suggests this is a realistic bullish price objective.
📊 Technical Indicator (EMA 70):
📉 The 70 EMA (red line) is at 0.64037.
✅ Price is above the EMA, signaling upward momentum.
Upcoming Economic Events:
⚠️ Multiple high-impact news events (USD and AUD flags) are scheduled around April 30 – May 2.
🌪️ Expect potential volatility — manage risk accordingly!
Summary:
✅ Bias: Bullish
🟢 Buy Opportunity: If price holds above demand zone.
🎯 Target: 0.65201
❌ Invalidation: Break below demand zone → support near 0.63255
AUDUSD Week 4 AprilAll timeframes are uptrend. And market is at strong resistance.
and market can not able to break it.
So to go for buy, it has to break that level.
If not it has to give BOS to sell trades.
so just wait and observe for edge formation.

"AUD/USD Reversal Setup – Short from Supply Zone!''🔹 Trend Overview:
Price was in a strong uptrend 🔼, forming higher highs and higher lows.
Key Zones:
🟦 Supply Zone (🔵 Resistance Area):
0.63803 - 0.64064
Price entered this zone and started to slow down ⏸️, showing signs of seller strength.
🔵🟤🟤🟤
📍Entry Point: 0.63803
This is where the short (sell) trade is planned.
✍️ "Let’s short it here!"
🚫 Stop Loss: 0.64064
Just above the supply zone to avoid false breakouts.
🛑 "If it goes here, we're out!"
🎯 Target Point: 0.62800
Previous support zone.
🟢💰🟢
💥 "This is where we take profit!"
Indicators:
📈 EMA (7) – Black line
Shows price momentum. Currently flattening ➡️, meaning bulls are losing steam.
Trade Idea Summary:
📉 Bias: Bearish (Short)
✅ Entry: 0.63803
🛑 Stop Loss: 0.64064
🎯 Target: 0.62800
⚖️ Risk/Reward Ratio: ~1:3.8 (Very solid!)
⏱️ Timing: Watching for signs of reversal before entering

AUD/USD) Resistance level pullback Short Read The ChaptianSMC Trading point update
analysis of the AUD/USD pair on the 2-hour timeframe, showing a possible bearish setup. Here's a breakdown of the idea behind it:
Key Observations:
1. Current Trend:
The pair was in an uptrend, as indicated by the rising channel (parallel trendlines). However, it has now broken out of that channel.
2. Resistance Level:
The price has reached a resistance zone around 0.64000, and it seems to be rejecting this level.
3. 2 Timeframe Demand Zone:
Around the 0.63300 – 0.63400 range, this area previously acted as a demand zone (support), and the chart suggests price might retest it.
4. Projected Move:
First, a pullback up into the resistance zone could occur.
Then a drop to the demand zone.
If the demand zone fails to hold, the price could head down toward the key support/FVG (Fair Value Gap) around 0.61000 – 0.61500.
5. EMA (200):
The 200 EMA is below the price, suggesting longer-term bullish pressure, but it's starting to flatten, which could signal weakness in the uptrend.
6. RSI Indicator:
RSI is around 52, showing neutral momentum—neither overbought nor oversold, allowing room for movement in either direction.
Mr SMC Trading point
---
Idea Summary:
The chart suggests a potential reversal from the uptrend into a downtrend, triggered by a failure to break above resistance. The two key targets for a bearish move are:
First: the 2TF demand zone
Final: the key support/FVG zone
Pales support boost 🚀 analysis follow)

AUD/USD LONG TRADE SETUP🛒 Trade Idea:
Entry: Inside the 4H demand zone (around 0.6000 - 0.6060).
Confirmation: Look for bullish price action or a lower timeframe change of character (ChoCh).
Target: Liquidity area around 0.6320+.
Stop-Loss: Below the 4H demand zone (around 0.5950 or tighter based on entry strategy).
✅ Confluence Factors:
Bullish BOS shows structural shift.
Imbalance + 4H demand zone = strong entry confluence.
Liquidity target provides clear TP area.

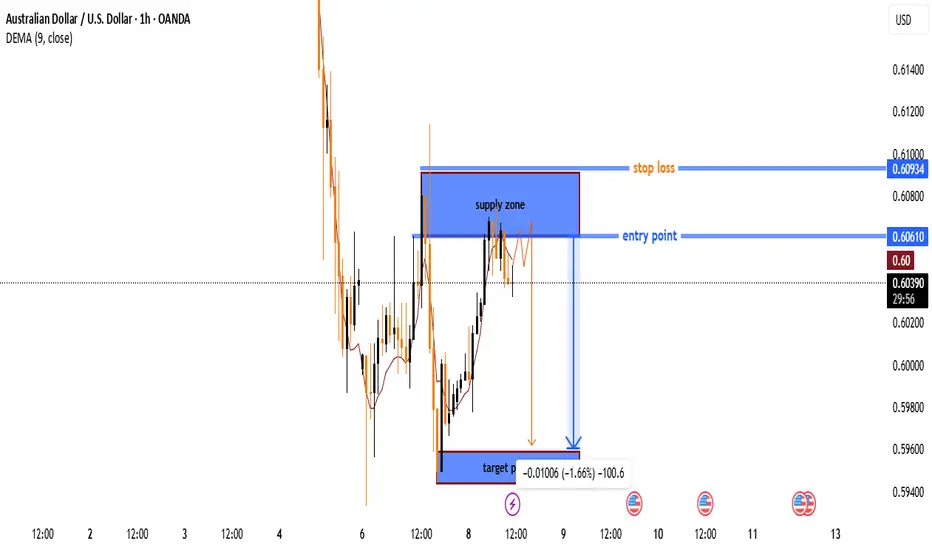
AUD/USD Supply Zone Rejection Trade Setup🔵 Supply Zone → (Blue highlighted area) The price is expected to reverse from here.
🔹 Entry Point → 0.60610 📍 (Marked with a blue line) The trade is planned to start here.
🟠 Stop Loss → 0.60934 ❌ (Marked with an orange line) If the price goes above this, the trade will be exited to prevent further loss.
🔻 Target Point → 0.59400 🎯 (Marked at the bottom) Expected profit zone if the trade moves as planned.
📉 Trade Plan:
✅ Short position (Sell trade) expected to drop from the supply zone.
🚀 Risk-to-reward ratio looks good as the potential profit is higher than the risk.
⚠️ Risk Factor: If price breaks above the supply zone, the setup might fail.
AUD/USD: Bullish Momentum Builds from Strong DemandIn the 4-hour AUD/USD chart, strong supply and demand zones are visible. A significant demand zone is observed around the 0.62269 level. Within the chart, a Change of Character (ChoCh) is identified from the 0.6323 level, and a Break of Structure (BoS) is noted at the 0.63211 level. A strong selling reaction has been observed from the supply zone, and the market has retested that level again.
On the demand side, the market has touched the strong demand zone twice and showed a bullish formation each time. Currently, the price is forming a strong bullish candle again.
Based on the Fibonacci levels, potential upside targets could be seen at 0.62717, 0.63128, and 0.63312, provided the market holds above the demand zone. However, if the demand zone is broken, there is a possibility of the market dropping down to 0.61901 .

AUDUSD - SELL - Wave 5 - Elliott wave AUD/USD (Australian Dollar/US Dollar) is a major currency pair in the Forex market, representing the exchange rate between the Australian Dollar (AUD) and the US Dollar (USD). It is influenced by factors such as:
Commodity Prices: Australia is a major exporter of commodities like iron ore and gold, so AUD/USD is highly correlated with commodity price movements.
Interest Rate Differentials: The Reserve Bank of Australia (RBA) and the US Federal Reserve's interest rate decisions impact the pair significantly.
Market Sentiment: AUD is often seen as a risk-on currency, meaning it strengthens during times of global economic optimism and weakens during uncertainty.
US Economic Data: Since USD is the world's reserve currency, US economic indicators like inflation, employment, and GDP growth influence AUD/USD.
This pair is popular among traders due to its liquidity and volatility, making it a favorite for both short-term and long-term strategies. Are you currently trading AUD/USD, or just analyzing it?

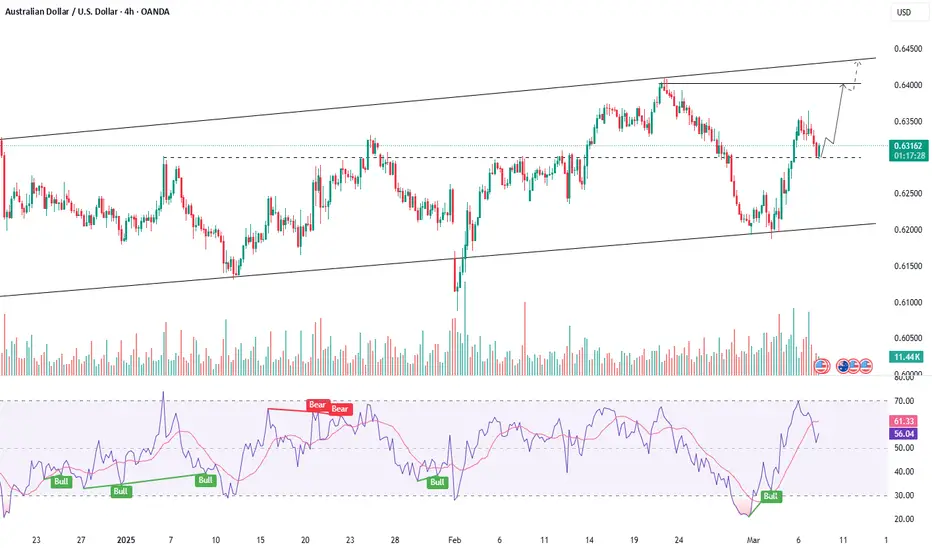
AUDUSD - RETRACEMENT WITHIN UPTREND BEFORE FURTHER GROWTHSymbol - AUDUSD
CMP - 0.6302
AUDUSD pair, supported by a decline in the US dollar, holds significant potential for continued growth. However, given the upcoming NFP release today, Friday, the associated risks are heightened.
Currently, the currency pair is establishing a local uptrend, and in conjunction with the weakening dollar, the Australian dollar may sustain its strengthening trajectory. On the 4-hour chart, a local correction is developing towards an imbalance zone, with a strong support level at 0.6300 The price is displaying a false breakout, attempting to capture liquidity and subsequently consolidate at higher levels. Should the bulls successfully defend the 0.6300 – 0.6330 range, the price is positioned to maintain its upward momentum in both the short and medium term.
Key support levels: 0.6300, 0.6255
Key resistance levels: 0.6330, 0.6363
A consolidation above the 0.6300 level, followed by a sustained rise and consolidation above 0.6330, would confirm the bulls' intentions for further upward movement. However, with the NFP release and other significant economic data on the horizon, the risks are amplified, and elevated market volatility should be expected.
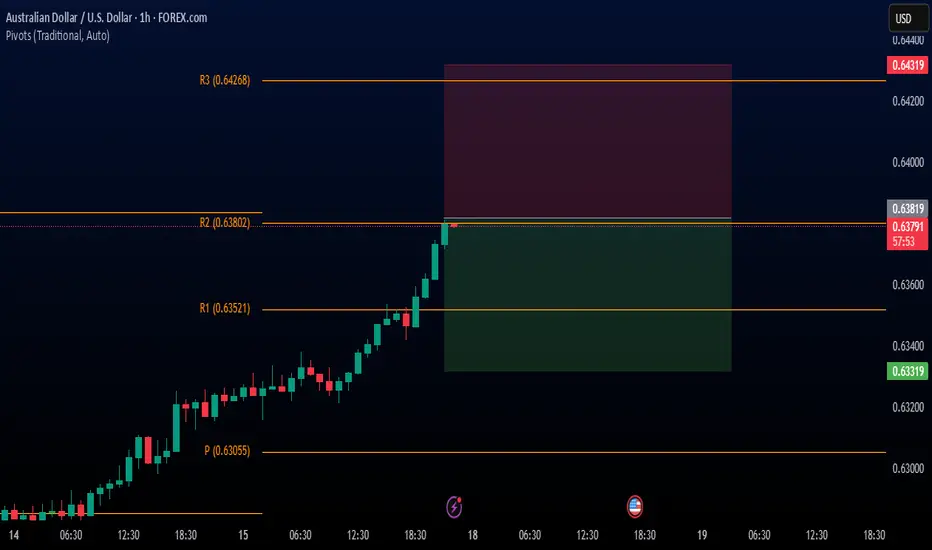
AUD USD Rally Needs a PitstopHello traders, This is the pivot resistance zone in the AUD/USD 1 hour. Candles taking resistance at the pivot R2 level of 0.63802 indicate a sell bias based on the market trend and the behavior of the previous day.
Trading ideas
Entry: 0.63819
Target: 0.64319
Stop loss: 0.63319
Risk Reward Ratio 1:1
Your likes and boosts motivate us to keep learning and sharing ideas!
AudUsd BearishRed line is entry point for sell limit.
Higher time frame shows bearishness ,may reached daily Ob on sell side
Liquidity stacked on sell side good RR , london entry

AUD/USD Technical Review📈 *Bullish Breakout Ahead?*
The AUD/USD daily chart indicates a potential **bullish reversal**, with price action bouncing off key support zones and forming an upward trendline. Here are some key observations:
🔹 **Support Levels**: The pair is holding above the **0.6269 - 0.6220** support zone, which has been tested multiple times.
🔹 **Trendline Support**: A rising trendline suggests buyers are stepping in at higher levels.
🔹 **Resistance Targets**: The next major resistance zones are at **0.6680 - 0.6696** and **0.6846**, aligning with previous supply areas.
🔹 **Moving Average Influence**: The 50-day MA is being tested, and a clean break above it could fuel further upside.
💡 **Bullish Scenario**: If price remains above **0.6269**, we could see a rally toward **0.6600+** in the coming weeks.
⚠️ **Bearish Risk**: A breakdown below **0.6207** could invalidate this bullish bias.
📊 **Overall Sentiment: Cautiously Bullish 🚀**
What are your thoughts? Will AUD/USD hit **0.66+** soon? Drop your analysis below! ⬇️🔥

**Short Trade Plan for AUD/USD: "Catching the Bear in a Bull's B### 🔥 **Short Trade Plan for AUD/USD: "Catching the Bear in a Bull's Breath"**
#### 🔍 **Chart Analysis**
From the latest AUD/USD chart:
1. **Primary Trend (Long-Term)** remains **Bearish (Downtrend)** as the price stays clearly below the **BB 104 0.1 (Lower Band)**, indicating strong selling pressure in the long run.
2. **Secondary Trend (Short-Term)** shows a minor recovery as the price bounces back into the **Channel LB12** (Lower Band 1 - Lower Band 2) of **BB 20 1**, reflecting a short-term rebound from the oversold condition.
---
#### 💡 **Trading Strategy **
1. **Trend Confirmation:** The primary trend is still bearish, so focus on short positions.
2. **Optimal Entry Point:** Wait for the price to rise near the **Upper Band 1 (UB1)** or encounter resistance around the **BB 104 0.1 (Lower Band)**.
3. **Confirmation Signal:** Look for a **bearish candlestick pattern** (e.g., bearish engulfing or shooting star) to validate the entry.
4. **Position Sizing:**
- If the **SMA 104 slope** is clearly down and **ADX > 25**, open **2/3 (66.67%)** of the full position size.
- If **SMA 104 slope** is flat or **ADX < 20**, reduce to **1/2 (50%)** or even **1/3 (33.33%)**.
5. **Stop Loss:** Place it just above the **BB 104 0.1 (Upper Band)** to minimize risks from false breakouts.
6. **Profit Target:**
- First target at **Lower Band 1 (LB1)** for partial profit-taking.
- Final target near **Lower Band 2 (LB2)** if the downtrend continues.
7. **Risk Management:** Apply trailing stop if the trend remains strong, following the **BB 20 0.2 (Middle Band)**.
---
#### 🚨 **Key Takeaway**
Despite the short-term bullish bounce, the primary trend remains bearish. Taking advantage of short opportunities at resistance levels aligns with the **SBD Strategy** and ensures risk control in case of unexpected bullish momentum. Stay vigilant and adapt position sizing according to trend strength and volatility! 💪

AUDUSD MULTI TIME FRAME ANALYSISHello traders , here is the full multi time frame analysis for this pair, let me know in the comment section below if you have any questions , the entry will be taken only if all rules of the strategies will be satisfied. wait for more price action to develop before taking any position. I suggest you keep this pair on your watchlist and see if the rules of your strategy are satisfied.
🧠💡 Share your unique analysis, thoughts, and ideas in the comments section below. I'm excited to hear your perspective on this pair .
💭🔍 Don't hesitate to comment if you have any questions or queries regarding this analysis.

Sell Trade - AUD/USDPlace a sell trade on AUD/USD and check out my chart for the ideal sell entry and stop-loss placement.
Remember:-
Move SL to breakeven once the trade reaches 1:1.5 R.
Aim for a minimum reward of 1:2 R.
Risk no more than 2.5% of your total margin.
Let's execute this trade smartly! 🚀

AUDUSD - Impulse entry - SL hit1. Candle took Support
2. waited for high break of the candle
3. Sl hit after entry
