USDCAD Intraday Liquidity Reversal USDCAD delivered a textbook sell-side liquidity purge before rotating higher, suggesting smart money participation emerging from the lower dealing range.
Price engineered a sweep below the equal lows near 1.3517, effectively triggering resting sell stops and late breakout shorts. The displacement that followed indicates aggressive buy-side interest rather than passive short covering, reinforcing the probability of accumulation at discount.
From an ICT framework, the market transitioned from a bearish delivery into a short-term market structure shift (MSS) after failing to continue lower post-liquidity grab. The impulsive bullish leg left behind a minor inefficiency, hinting that algorithms repriced the pair too quickly after securing liquidity.
Orderflow Narrative:
External range liquidity was cleared beneath prior lows.
Smart money likely accumulated within the discount zone of the current dealing range.
Subsequent displacement validates intent, not randomness.
The highlighted long setup aligns with the expectation of price gravitating toward equilibrium, with 1.3550–1.3575 acting as the next magnet where opposing liquidity clusters rest.
Trade Logic:
Entry Zone: Discount / post-sweep reaction
Invalidation: Sustained acceptance below the liquidity low
Target: Draw on buy-side liquidity above internal highs
U.S. Dollar / Canadian Dollar
No trades
What traders are saying

USDCAD | 1H Market Structure OutlookUSDCAD is currently trading within a well-defined short-term distribution range after engineering a strong impulsive rally from the late-January lows. The recent expansion into the 1.3700 handle appears to have tapped into a premium supply zone, where price printed rejection wicks, signaling the presence of institutional sell-side liquidity.
From an SMC / ICT perspective:
Price swept relative equal highs before showing displacement to the downside, hinting at a classic buy-side liquidity grab.
The rejection from the marked supply suggests smart money may be positioning for a retracement toward inefficiencies left below.
Internal structure is beginning to shift bearish on the lower timeframe, though confirmation would require a decisive break of structure (BOS) beneath the 1.3620 support.
Key Levels to Watch
Supply / Premium: 1.3695 to 1.3710
Intermediate Support: ~1.3620 (range floor)
Higher-Timeframe Demand: 1.3580 to 1.3600, aligning with the visible demand block and potential mitigation zone.
Projected Path
If price fails to reclaim the supply region, the probability favors a corrective move lower, potentially delivering a measured draw on liquidity into the demand zone. A brief pullback into a lower high followed by continuation would further validate bearish order flow.
Invalidation Scenario:
Sustained acceptance above 1.3710 would negate the bearish premise and open the door for continuation toward higher liquidity pools.
Bias: Short-term bearish while below supply, with expectations of liquidity engineering toward discounted pricing.

USDCAD MULTI TIMEFRAME ANALYSIS Hi traders, this is the complete multi-time frame analysis for this pair. Please feel free to ask any questions in the comment section below. The entry will only be made if all strategy rules are met.

USDCAD – 15M | Breakout → Retest → Continuation SetupStrong impulsive move delivered a clean break in market structure to the upside.
Price pushed into buy-side liquidity, then paused at prior highs.
Key read:
Bullish displacement confirmed ✔️
Old resistance now acting as support ✔️
Pullback unfolding inside premium with inefficiency below

Bearish Displacement from HTF Supply | Targeting Sell-Side L
Price is finding heavy resistance at the current supply. Looking for the move down to the next high-probability demand zone. Trade safe!

Long USDCAD Setup Looking to BUY USDCAD. Price is bouncing from a strong support zone with bullish momentum divergence, suggesting a potential reversal higher.

USDCAD at historical demand zoneThe USDCAD pair is currently testing a critical support zone that has historically acted as a trusted base. After a sharp descent, we are seeing signs of life as the price attempts to hold this floor and move higher.
The immediate price action suggests this level is highly decisive for the next major trend. Here are the two primary scenarios to watch:
1. If the current momentum sustains and the base remains intact, the first major target is the overhead resistance at 1.3826.
Continuation: A clean break and daily close above 1.3826 would signal a shift in market structure, likely igniting a fresh bullish wave toward higher swing levels.
2. On the flip side, if the recovery loses steam and the price slips back below the 1.3662 mark, the outlook turns sharply bearish.
Target: Trading below this support would invalidate the current bounce and open the doors for a deeper correction toward the 1.3400 psychological level.
As usual, Volume plays key role.

USD/CAD: Elliott Wave Bearish BiasUSD/CAD is showing a bearish Elliott Wave structure on the 4H chart. Price appears to have completed a corrective Wave 2 near the 0.5–0.618 Fibonacci retracement zone, which is a common area for corrections to end. From there, the market has started to turn lower, suggesting the beginning of a new impulsive Wave 3 to the downside, which is usually the strongest bearish wave. As long as price stays below the recent swing high near the retracement zone, the bias remains bearish, with downside targets toward the 1.365–1.360 area. A move above the Wave 2 high would invalidate this count and delay the bearish scenario.
Stay tuned!
@Money_Dictators
Thank you :)

USDCAD 4HR T/F ANALYSIS----
usdcad 4hr t/f analysis----- after parallel channel breakdown we can measure marked supply which are repeated here so after supply complete then we can see demand from reversal portion and wait for also bullish candle on reversal portion it`s a confirmation to get right trade ok let`s see---

How I Traded USDCAD for 1:5.5R | $650 Profit | Full Breakdown (H📊 USDCAD 1:5.5R Trade | $650 Profit – Full Breakdown (Hindi)
Is video me maine USDCAD ka real trade step-by-step explain kiya hai jisme 1:5.5 Risk-Reward ke saath $650 profit book hua 💰
Ye video un traders ke liye hai jo:
✔️ High R:R trades seekhna chahte hain
✔️ Entry, SL aur TP ka clear logic samajhna chahte hain
✔️ Discipline aur patience ke saath trading karna chahte hain

USDCAD ON 2H Time frame Head and shoulder pattern.As you can see market is forming head and shoulder pattern if market breaks the neckline we can sell with LTF

USDCAD on 1hr time frame As you can see market is following trend line and if it breaks we can see massive fall. After getting lower time frame confirmation we can enter.
Plan your trade accordingly.

USDCAD (Monthly) — Wave 5 Extended, Structure IntactUSDCAD continues to trade within a well-defined rising channel, maintaining its long-term bullish structure.
The broader Elliott Wave context suggests the market is in Wave 5 (extended), currently undergoing internal consolidation rather than trend exhaustion.
🔍 Key Observations
Higher highs and higher lows remain intact
Price holding above channel support
No structural breakdown on monthly timeframe
Momentum cooling is time-based, not price-destructive
📌 Key Levels
Support zone: 1.30 – 1.33
Channel support: Critical for structure
Structural invalidation: Only on sustained breakdown below channel support
As long as price respects the channel, the primary trend remains bullish.
Any consolidation within the structure should be viewed as digestive, not distributive.
📎 This analysis focuses on structure, not prediction.
Disclaimer:
This is a structural and educational analysis based on Elliott Wave and price behavior. Not financial advice.
#MarketStructure
#ElliottWave
#USDCAD
#ForexAnalysis
#WaveTheory
#TechnicalAnalysis
#TrendStructure
#MacroMarkets
#PriceAction

USDCAD Trade Description – Liquidity Sweep + Discount Rejection USDCAD created a clean sell-side liquidity sweep below the previous low near 1.3700, taking out resting liquidity and tapping into a higher-timeframe discount zone.
After the sweep, price showed a sharp rejection wick, signaling absorption of sell orders and a potential reversal. The market then broke structure to the upside on lower timeframes, confirming a shift in momentum.
Price retraced back into the refinement zone / mitigation block, aligning perfectly with:
✔ Discount pricing
✔ Liquidity grab below the equal lows
✔ Rejection from a demand zone
✔ Bullish displacement following the sweep
This offered a high-probability long setup with entry near the mitigation block, stop below the sweep low, and targets toward the premium zone around 1.3780–1.3800.
The trade idea is based on price reverting back to its equilibrium after removing inefficient lows and collecting sell-side liquidity.

USD/CAD – Liquidity & Structure Based Short IdeaUSD/CAD has been trading inside a well-defined rising channel for a while. Price is now approaching the upper boundary of this channel, a zone where sellers have previously stepped in with strength.
This area is not just resistance, it’s also a liquidity zone, where stop-losses of late buyers are resting above recent highs. Such zones often attract smart money activity before a directional move.
What Price Is Telling Us: Price is currently stalling near resistance instead of expanding higher. We can observe Multiple rejections near the channel top, Overlapping candles showing loss of bullish momentum and Lack of strong follow-through despite previous volume spike.
This behavior often appears before distribution or a corrective move, especially when price is trading at premium levels.
If this analysis helped you, like, follow, and comment for more clean Forex breakdowns.
Disclaimer: This analysis is for educational purposes only and does not constitute financial advice. Trading involves risk, and past performance does not guarantee future results. Please manage risk responsibly.

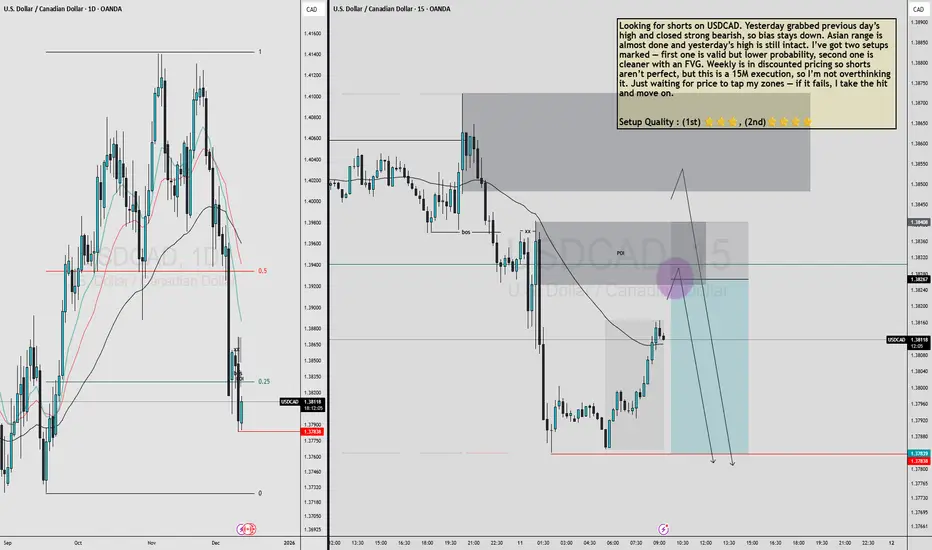
USDCAD MULTI TIMEFRAME ANALYSIS Looking for shorts on USDCAD. Yesterday grabbed previous day’s high and closed strong bearish, so bias stays down. Asian range is almost done and yesterday’s high is still intact. I’ve got two setups marked — first one is valid but lower probability, second one is cleaner with an FVG. Weekly is in discounted pricing so shorts aren’t perfect, but this is a 15M execution, so I’m not overthinking it. Just waiting for price to tap my zones — if it fails, I take the hit and move on.
Setup Quality : (1st) ⭐⭐⭐, (2nd)⭐⭐⭐⭐
USDCAD - Breakout Will Flip the Trend BullishUSDCAD has been sliding inside a well-defined descending channel, completing a full five-wave drop toward the support zone. The structure from the top looks corrective rather than impulsive. That means the downtrend is weakening as it reaches its final leg.
Your count shows Wave 3 finishing at the dashed red line zone, followed by a small Wave 4 bounce, and now the market is pushing into the last Wave 5. This final drop is expected to target the Fibonacci levels near 1.3915 and 1.3895 . Nothing suggests strength until those levels are tested.
The price is still trapped inside the downward channel, and every bounce has been getting sold. That confirms sellers are still in control for now. Wave (C) is close to completion, but buyers haven’t proven anything yet.
The bullish outlook only becomes valid after a clean breakout above the channel. Without that break, any upside move is just noise inside a bearish structure. The breakout must hold with a higher low to confirm a trend reversal.
If the channel breaks decisively, a strong bullish reversal toward 1.40+ becomes possible. The entire structure suggests the downtrend is aging, so a major upside swing is likely once sellers exhaust. Until then, downside targets remain open and caution is necessary.
Stay Tuned!
@Money_Dictators

USD/CAD in Daily time frameAS per Wave analysis, Correction of flat is done. Now Wave 5 started for down trend in daily time frame for an Target of 1.36250

USDCAD Short Term bullish ScenarioUSD/CAD looks like an short term buying opportunity in 1HR time frame. It tend's to move for an Target =1.40500

Part 7 Trading Master Class With Experts Risks in Option Trading
1. For Option Buyers
High time decay
Need sharp moves
Volatility drop can cause losses
2. For Option Sellers
Large potential loss
Requires strict stop-loss
High volatility can spike premiums unpredictably

Part 6 Learn Institutional TradingWhat Is Premium?
Premium is the cost of buying an option.
It depends on multiple factors:
Underlying price
Strike price
Time to expiry
Volatility (IV)
Interest rates
Market demand and supply
If implied volatility is high, premium rises.
If expiry date is near, premium decays faster.

USDCAD MULTI TIMEFRAME ANALYSIS Hello traders , here is the full multi time frame analysis for this pair, let me know in the comment section below if you have any questions , the entry will be taken only if all rules of the strategies will be satisfied. wait for more price action to develop before taking any position. I suggest you keep this pair on your watchlist and see if the rules of your strategy are satisfied.

Part 6 Learn Institutional TradingTypes of Options Strategies
Option strategies are divided into two broad categories:
- Directional Strategies
Used when you expect the market to move strongly in one direction.
1. Long Call
Profit from big upward moves.
2. Long Put
Profit from major downward moves.
3. Bull Call Spread
Buy call + Sell call (higher strike)
Reduces cost and risk.
4. Bear Put Spread
Buy put + Sell put (lower strike)
