Ote Refinement trade setup for currency .hoping for a long entry set up . after taking out the inducement and fvg associated with the bos .
USDEUR trade ideas

Buy Trade - EUR/USDGreetings to everyone!
You can place a buy trade on EUR/USD and check out my chart for the ideal entry, stop-loss & target placement.
Remember :-
* Move your SL to breakeven once the trade reaches 1:1 R.
* Aim for a minimum reward of 1:1.5 R.
* Don't risk more than 3% of your total margin.
Let's execute this trade smartly! 🚀
💬 About Me:
I am a professional trader with over four years of experience in the markets. I focus on swing trading using the 4H timeframe, mainly in the forex space. The trades I share here are the actual positions I’m executing. I post them as a small gesture to give back to the trading community that’s been a big part of my journey.
Cheers! 🙏

EURUSD BUY PLANPair: EURUSD
Current Price: 1.17415
🔹 Market Context
Price is currently reacting at a very important Order Block (OB) zone.
Daily trend is bullish and aligns with the 4H structure, adding confluence for upside continuation.
Market is showing good upside momentum from this level.
🔹 Trade Idea
Buy Bias → Looking for long opportunities from this OB zone.
Stop Loss (SL): 1.17180 (below OB & structure protection).
Entry Trigger: Wait for Fractal Structure Breaks on lower timeframes to confirm buyers stepping in.
🔹 Plan Execution
Mark OB zone on 4H + Daily.
Drop to 15m / 5m to watch for fractal structure breaks and bullish confirmation.
Enter on confirmation, targeting clean liquidity levels above.
Maintain proper risk management (max 1–2% per trade).
🔹 Summary
EURUSD is at a high-probability buy zone with HTF trend alignment, OB support, and momentum confluence. Waiting for fractal confirmation will filter out weak setups and give us a precise entry.

CAN WE - $EUROLooking for a small reversal during UK session to take out the Monday High a short term bullish and long term bearish on MIL:EURO

EURUSD MULTI TIME FRAME ANALYSISHello traders , here is the full multi time frame analysis for this stock , let me know in the comment section below if you have any questions , the position will be taken only if all rules of the strategies will be satisfied. wait for more price action to develop before taking any position. I suggest you keep this pair on your watchlist and see if the rules of your strategy are satisfied.
🧠💡 Share your unique analysis, thoughts, and ideas in the comments section below. I'm excited to hear your perspective on this pair .
💭🔍 Don't hesitate to comment if you have any questions or queries regarding this analysis.

Good palce to shot Here lower liquidity swept with CHOCH as changed market shift , Current Order Block good Inducemnent, Good go for Shot

EURO - PLAN FOR TODAYMIL:EURO - I am bearish on D - tf but currently i am looking for a quick retracement during UK Open to fill some upper limits.

AI & Machine Learning Models in Market Prediction1. Overview of AI and Machine Learning in Finance
1.1 Artificial Intelligence in Finance
AI refers to computer systems designed to perform tasks that normally require human intelligence. In finance, AI can perform tasks like risk assessment, fraud detection, sentiment analysis, and predictive modeling. Its ability to simulate human-like decision-making is particularly valuable in trading, where speed, accuracy, and adaptability are crucial.
1.2 Machine Learning as a Subset of AI
Machine Learning is a subset of AI that focuses on algorithms that learn from data. Unlike traditional statistical methods, ML models improve their predictive accuracy as they are exposed to more data. ML can be categorized into:
Supervised Learning: The model learns from labeled historical data to predict future outcomes (e.g., stock prices).
Unsupervised Learning: The model identifies hidden patterns in unlabeled data (e.g., market clustering, anomaly detection).
Reinforcement Learning: The model learns by trial and error to maximize rewards, often used in algorithmic trading.
2. Types of Machine Learning Models Used in Market Prediction
2.1 Regression Models
Regression analysis predicts continuous outcomes, such as stock prices, interest rates, or commodity values. Common models include:
Linear Regression: Models the relationship between a dependent variable and one or more independent variables.
Ridge and Lasso Regression: Improve linear regression by adding regularization to prevent overfitting.
Polynomial Regression: Captures non-linear relationships in market data.
2.2 Classification Models
Classification models are used when outcomes are categorical, such as predicting whether a stock will go up or down. Examples include:
Logistic Regression
Support Vector Machines (SVM)
Random Forests
Gradient Boosting Machines
2.3 Time Series Models
Financial data is inherently sequential. Time series models exploit temporal dependencies to forecast future trends:
ARIMA (Auto-Regressive Integrated Moving Average)
SARIMA (Seasonal ARIMA)
Prophet (by Facebook)
LSTM (Long Short-Term Memory networks): A type of neural network ideal for capturing long-term dependencies in sequential data.
2.4 Deep Learning Models
Deep learning involves multi-layer neural networks capable of modeling complex, non-linear relationships in market data:
Convolutional Neural Networks (CNNs): Typically used for image recognition but applied to visualized market data like candlestick charts.
Recurrent Neural Networks (RNNs): Designed for sequential data, with LSTM and GRU as advanced versions.
Transformers: Advanced models that handle large datasets and multiple features, increasingly used in financial forecasting.
2.5 Reinforcement Learning
Reinforcement Learning (RL) models are particularly popular in algorithmic trading. In RL:
The agent (trading algorithm) interacts with an environment (market).
It receives feedback (reward or penalty) based on its actions.
Over time, it learns strategies to maximize cumulative rewards.
Applications include high-frequency trading, portfolio optimization, and dynamic hedging strategies.
3. Data Sources for AI Market Prediction
AI models require large and diverse datasets. Key sources include:
Historical Market Data: Prices, volumes, and volatility indices.
Economic Indicators: GDP, inflation, employment rates.
Company Fundamentals: Financial statements, earnings reports, and debt levels.
Alternative Data: Social media sentiment, news articles, Google Trends, satellite imagery.
High-Frequency Data: Tick-by-tick data used in HFT algorithms.
Data quality is critical: noisy, incomplete, or biased data can significantly reduce model accuracy.
4. Features and Variables in Market Prediction
Feature engineering transforms raw data into meaningful input variables. Common features include:
Technical Indicators: Moving averages, RSI, MACD, Bollinger Bands.
Sentiment Scores: Derived from social media or news sentiment analysis.
Macroeconomic Variables: Interest rates, commodity prices, geopolitical events.
Market Microstructure: Order book depth, bid-ask spreads, and trade volume.
Feature selection helps reduce dimensionality, improve computation efficiency, and avoid overfitting.
5. Advantages of AI and ML in Market Prediction
Speed and Efficiency: Can analyze millions of data points in seconds.
Pattern Recognition: Detects complex non-linear patterns invisible to human analysts.
Adaptability: Models can adjust to new market conditions.
Risk Management: Improves predictive accuracy, helping mitigate losses.
Automation: Enables algorithmic trading and continuous market monitoring.
6. Challenges and Limitations
Data Quality and Availability: Poor or biased data reduces model effectiveness.
Overfitting: Models may perform well on historical data but fail in real-time markets.
Market Unpredictability: Black swan events and irrational market behavior are difficult to model.
Interpretability: Complex models like deep neural networks are often “black boxes.”
Regulatory Compliance: Financial regulations may restrict the use of certain AI models.
7. Case Studies and Applications
7.1 Stock Price Prediction
Companies use LSTM networks and hybrid models combining technical indicators and sentiment analysis to forecast stock movements. Some hedge funds leverage AI for short-term price predictions.
7.2 Algorithmic and High-Frequency Trading
AI-driven HFT systems execute thousands of trades per second using reinforcement learning and predictive analytics to exploit market inefficiencies.
7.3 Portfolio Optimization
AI models can rebalance portfolios dynamically, considering risk, expected returns, and correlations between assets, often outperforming traditional mean-variance optimization.
7.4 Risk Assessment and Fraud Detection
Machine learning models assess credit risk, detect unusual trading patterns, and flag potential fraud in real-time.
8. Future Trends
Explainable AI (XAI): Increasing demand for transparent models that can explain decisions to regulators and investors.
Integration with Alternative Data: Enhanced predictive power through social media, news sentiment, and satellite imagery.
Quantum Computing: Potential to accelerate complex computations and improve prediction accuracy.
AI-Driven Macroeconomic Forecasting: Integration of global economic, political, and environmental data for holistic market prediction.
Conclusion
AI and Machine Learning have transformed financial market prediction, offering unprecedented speed, accuracy, and adaptability. By leveraging historical and real-time data, these technologies can identify complex patterns, optimize trading strategies, and improve risk management. However, challenges such as data quality, overfitting, interpretability, and market unpredictability remain.
As AI continues to evolve, combining explainable models, alternative data, and advanced computational techniques will redefine the future of market analysis, making financial decision-making more informed and strategic.

Leveraged & Margin Trading1. Understanding Margin and Leverage
1.1. Margin Trading
Margin trading is a practice where traders borrow funds from a broker to trade financial instruments beyond the capital they own. Essentially, the trader puts up a portion of the trade’s value as a “margin,” while the broker provides the remainder.
Initial Margin: The amount a trader must deposit to open a position.
Maintenance Margin: The minimum account balance required to keep the position open. Falling below this can trigger a margin call.
Example:
If an investor wants to buy $10,000 worth of stock but only has $2,000, they can borrow the remaining $8,000 from the broker. Here, $2,000 is the initial margin.
2. How Margin Trading Works
2.1. Opening a Margin Account
Margin trading requires a margin account with a brokerage. Unlike a standard cash account:
Brokers assess creditworthiness and risk tolerance.
Regulatory bodies often impose minimum equity requirements.
Margin accounts allow borrowing for long and short positions.
2.2. Margin Call and Liquidation
A margin call occurs when the trader’s equity falls below the maintenance margin. Brokers demand additional funds or liquidate positions to cover losses.
Example:
Initial equity: $5,000
Maintenance margin: 25%
Position value drops, equity falls below $1,250 → margin call issued.
2.3. Interest and Costs
Borrowing funds incurs interest. Traders must account for:
Daily or monthly interest rates on borrowed funds.
Fees for overnight or extended positions.
Potential hidden costs in leveraged ETFs or derivatives.
3. Types of Leverage and Margin Instruments
3.1. Equity Margin Trading
Allows buying more shares than one can afford.
Popular in stock markets like the NYSE, NSE, and NASDAQ.
Often subject to regulatory limits, e.g., max 2x leverage for retail investors.
3.2. Forex Leverage
Forex brokers often provide high leverage (50:1 to 500:1) due to low volatility per pip.
Extremely high risk due to rapid market movements.
Margin is expressed as a percentage (e.g., 2% margin = 50x leverage).
3.3. Derivatives and Futures
Futures contracts inherently involve leverage.
Traders only deposit a fraction of the contract value as margin.
Profit/loss calculated daily (“mark-to-market”).
3.4. CFD (Contract for Difference) Trading
CFDs let traders speculate on asset price movements without owning the asset.
Leverage is widely used, amplifying gains and losses.
4. Benefits of Leveraged & Margin Trading
Amplified Returns: Small price movements can generate substantial profits.
Capital Efficiency: Traders can deploy limited capital across multiple positions.
Hedging Opportunities: Use leverage to hedge existing portfolios.
Short-Selling: Margin accounts enable profiting from falling markets.
Access to Advanced Markets: Leverage allows participation in markets with high nominal value (commodities, derivatives).
5. Risks and Challenges
5.1. Magnified Losses
Leverage increases exposure to adverse price movements.
Small losses can quickly exceed initial capital, leading to debt.
5.2. Margin Calls and Forced Liquidation
Margin calls can trigger automatic liquidation at unfavorable prices.
Timing and liquidity are critical to avoid catastrophic losses.
5.3. Interest and Fees
Borrowing costs reduce net gains.
Long-term leveraged positions can become expensive.
5.4. Psychological Pressure
High leverage induces stress, emotional trading, and overconfidence.
Traders may exit positions prematurely or double down recklessly.
6. Strategies in Leveraged & Margin Trading
6.1. Trend Following
Use leverage to maximize profits in strong trending markets.
Combine technical analysis, moving averages, and momentum indicators.
6.2. Scalping and Intraday Trading
Small positions with tight stop-losses reduce exposure.
High-frequency trades magnified through margin can yield substantial intraday gains.
6.3. Hedging and Portfolio Protection
Leveraged instruments hedge existing investments.
Options and futures contracts allow downside protection.
6.4. Swing Trading
Capture medium-term price swings.
Leverage allows traders to scale positions while maintaining capital efficiency.
7. Risk Management in Leveraged Trading
7.1. Setting Stop-Loss Orders
Essential to limit downside.
Automated stop-losses prevent emotional decision-making.
7.2. Position Sizing
Calculate leverage based on volatility and account size.
Avoid risking more than a small percentage of total capital per trade.
7.3. Diversification
Spread exposure across multiple assets.
Reduces risk of catastrophic losses from a single position.
7.4. Monitoring Margin Levels
Keep track of maintenance margin requirements.
Avoid last-minute margin calls by maintaining buffer equity.
8. Regulatory and Ethical Considerations
Regulators impose limits on retail leverage to protect investors.
Brokers must disclose risks clearly.
Leveraged trading carries ethical responsibility—reckless use can lead to systemic market instability.
9. Practical Examples
9.1. Stock Margin Trade
Buy 500 shares at $50 each = $25,000
Own capital: $5,000
Borrowed: $20,000 (5:1 leverage)
Scenario A: Price rises 10% → $27,500 value
Profit = $2,500 → 50% return on own capital
Scenario B: Price falls 10% → $22,500 value
Loss = $2,500 → 50% loss on own capital, risk of margin call
9.2. Forex Leverage
EUR/USD position: $100,000
Own capital: $2,000 → 50:1 leverage
100 pips movement → profit/loss = $1,000 (50% of equity)
9.3. Futures Contracts
Oil futures: 1 contract = 1,000 barrels, $80/barrel → $80,000
Margin: 10% → $8,000 deposit
Price increase to $85 → $5,000 profit → 62.5% return on margin
10. Psychological Aspects
Leverage magnifies emotions: greed, fear, and overconfidence.
Discipline is crucial—traders must stick to pre-defined risk strategies.
Education and simulation trading can build confidence before risking real capital.
11. Leveraged ETFs
Exchange-Traded Funds designed to multiply returns of an underlying index.
Examples: 2x or 3x daily returns of S&P 500.
Ideal for short-term strategies; long-term holding can lead to compounding decay.
12. Leveraged Trading in Crypto Markets
Cryptocurrency exchanges offer extreme leverage (up to 100x).
High volatility makes margin calls frequent.
Traders must combine technical analysis, position sizing, and stop-losses rigorously.
13. Common Misconceptions
Leverage guarantees profit: False—losses are amplified too.
Higher leverage = better returns: False—risk management is more important than high leverage.
Margin trading is only for experts: False—but education is crucial.
14. Best Practices
Always calculate maximum potential loss before opening positions.
Use leverage conservatively, especially in volatile markets.
Diversify trades across assets and strategies.
Keep an emergency equity buffer to avoid forced liquidation.
Continuously review and adjust risk exposure.
15. Conclusion
Leveraged and margin trading are potent tools in modern financial markets. They provide opportunities to magnify returns, access sophisticated trading strategies, and enhance portfolio efficiency. However, they come with inherent risks: magnified losses, margin calls, psychological stress, and the potential for total capital erosion.
Success in leveraged trading depends on education, risk management, discipline, and strategic execution. Understanding the mechanics of margin accounts, leverage ratios, and market dynamics is essential. When used prudently, leverage can be a powerful ally; when mismanaged, it can become a trader’s downfall.
In essence, leveraged and margin trading are not merely about borrowing money—they are about amplifying strategic thinking, market insights, and disciplined execution. Traders who respect both the power and the peril of leverage are often those who succeed in the long run.

EUR/USD WEEKLY ANALYSIS: Where Liquidity Zone Price Target On ? OANDA:EURUSD
The Previous Uptrend (around September 16-17):
The candles show positive Delta values (+5.64K, -2.97K, +174). Although the candle on the 17th had a negative Delta, the overall trend leading up to it was driven by buying pressure. The high volume numbers on the buy side (left) during this period confirm that buyers were in control, pushing the price up.
The Current Corrective Move (around September 18-19):
This is where the Footprint data becomes most interesting and confirms the pullback.
September 18th candle: This candle shows a significant negative Delta (-288). This is a strong signal that sellers have entered the market aggressively. While the total volume is high (77.84K), the imbalance is clearly in favor of the sellers. The large red numbers on the right side of the candle, especially at higher prices, show that sellers were dominating and pushing the price down.
September 19th candle: The price continues to drop, and the Delta remains negative, reinforcing the selling pressure. The high sell volumes at the top of the candle confirm that this is a sustained downtrend within the larger corrective move.
Confirmation for the Trading Plan:
The Footprint data perfectly complements the SMC plan. It shows that the current downward move is not random; it's a deliberate shift in order flow driven by aggressive selling. This validates our expectation that the price will likely continue its correction.
To execute the long trade from the BUY ZONE, we would need to see a reversal in this Footprint data. Look for a future candle that shows a positive Delta, or a significant increase in buy volume at the lower price levels, especially within the BUY ZONE of 1.1670-1.1690. This would indicate that "Smart Money" is stepping back in to buy, confirming our entry.
In short, the Footprint data confirms the bearish pressure driving the current correction. It tells us not to rush into a buy and to wait for a clear shift in order flow to validate an entry.
Market Structure Analysis
Change of Character (ChoCH): The price shifted from a downtrend to an uptrend by breaking the previous high, which is marked as "ChoCH". This is the first signal indicating a change in the trend.
Break of Structure (BOS): After the ChoCH, the price continued to form higher highs and higher lows. A strong upward move broke the most recent high, creating a new "BOS". This confirms that the uptrend is continuing.
Current Trend: The current market structure is bullish. The price has created a new high (HH) and is now in a corrective phase, pulling back to find a strong support zone.
Analysis of Key Zones
Based on the market structure, there are key zones to watch:
BUY ZONE:
Location: The price range is from ~1.1670 to ~1.1690.
Significance: This zone is a crucial Order Block (OB). It was formed by the last candle before the price started its strong upward move, breaking the structure (BOS). According to SMC logic, this is where "Smart Money" placed large buy orders to push the price up, and the price is highly likely to retrace to "fill" the remaining orders. This is the most potential entry point for a long position.
SELL ZONE:
Location: The price range is from ~1.1820 to ~1.1840.
Significance: This zone is an Order Block and may also contain an Imbalance (liquidity gap). The price has already pulled back and had a minor reaction to this area. This is a temporary resistance zone. If the price continues to correct lower towards the "BUY ZONE", it will break through this area.
Liquidity and Stop Loss Zones:
Stop Loss (HH): The stop loss for a potential short trade would be placed above the highest peak (~1.1900).
Stop Loss (LL): The stop loss for a potential long trade would be placed below the lowest low (below the "BUY ZONE", ~1.1640). This area holds liquidity for buy orders placed here. If the price breaks this zone, the bullish structure could be invalidated, and the trading plan needs to be reconsidered.
Trading Plan
Based on the analysis, there are two main scenarios for trading EUR/USD:
Primary Scenario (Long Trade):
Strategy: Wait for the price to continue its corrective pullback.
Entry: Place a pending buy order in the BUY ZONE (~1.1670 - 1.1690).
Reasoning: This is the strongest Order Block zone, where the price is highly likely to reverse to continue the uptrend.
Take Profit:
TP1: The nearest high, above the SELL ZONE (~1.1840).
TP2: The current highest peak (~1.1880).
TP3: The liquidity zone above the high (HH) (~1.1920).
Stop Loss: Place it below the lowest low (LL), which is below the BUY ZONE (~1.1640).
Alternative Scenario (Short-Term Short Trade):
Strategy: Based on the current correction.
Entry: Consider a short-term sell trade when the price hits the SELL ZONE (~1.1820 - 1.1840).
Reasoning: This is a temporary resistance zone that could push the price down to fill the BUY ZONE below.
Take Profit: The BUY ZONE (~1.1670).
Stop Loss: Place it above the nearest peak within the corrective phase (~1.1860).
Important Note: The long trade scenario (primary plan) is more reliable because it aligns with the main market trend. The short trade scenario should be considered a short-term, higher-risk trade. Always follow proper risk management principles and only enter a trade with clear confirmation signals (e.g., a reversal candlestick pattern or a clear reaction to the key zones).

Part 4 Learn Institutional Trading1. Uses of Options
Options trading is not just speculation; it serves multiple purposes:
Hedging (Risk Management):
Investors use options to protect against unfavorable price movements.
Example: A stock investor buys a put option to limit losses if the stock price drops.
Speculation:
Traders use options to bet on price direction with limited capital and potentially high returns.
Income Generation:
Selling options (writing calls or puts) can generate consistent income through premiums.
Covered calls are a popular income strategy where you hold the stock and sell a call option against it.
Arbitrage Opportunities:
Advanced traders exploit mispricing between options and underlying assets to make risk-free profits.
2. Option Strategies
Options provide flexibility through a variety of strategies, which range from simple to highly complex:
Basic Strategies
Long Call: Buy call option anticipating price increase.
Long Put: Buy put option anticipating price decrease.
Covered Call: Hold stock and sell a call to earn premium.
Protective Put: Buy a put for stock you own to limit downside risk.
Intermediate Strategies
Straddle: Buy call and put at the same strike and expiry to profit from volatility.
Strangle: Buy call and put with different strikes to benefit from large price moves.
Bull Spread: Combine two calls (different strikes) to profit from moderate upward movement.
Bear Spread: Combine two puts to profit from moderate downward movement.
Advanced Strategies
Butterfly Spread: Limit risk and reward for minimal cost, suitable for low volatility expectations.
Iron Condor: Sell an out-of-the-money call and put while buying further out-of-the-money options to cap risk.
Calendar Spread: Exploit differences in time decay by trading options with the same strike but different expiries.
3. Greeks in Options Trading
Options traders use Greeks to measure sensitivity of option prices to different variables:
Delta: Measures price change in option relative to underlying asset.
Gamma: Measures change in delta as asset price changes.
Theta: Measures time decay of the option’s premium.
Vega: Measures sensitivity to volatility.
Rho: Measures sensitivity to interest rates.
Understanding Greeks helps traders manage risk, hedge positions, and optimize strategies.
4. Risks in Options Trading
Options trading carries significant risk, especially for sellers/writers:
For Buyers:
Risk limited to premium paid.
Potential for total loss if option expires worthless.
For Sellers:
Risk can be unlimited for uncovered (naked) options.
Margin requirements can be high.
Time Decay Risk:
Options lose value as expiry approaches, especially OTM options.
Volatility Risk:
Unexpected changes in market volatility can affect option premiums dramatically.
Proper risk management, position sizing, and understanding of market conditions are crucial.
5. Practical Tips for Options Trading
Start Small: Begin with a few contracts until you understand mechanics and risk.
Focus on Liquid Options: Trade options with high volume to ensure tight spreads and easy entry/exit.
Use Stop-Loss: Protect capital by predefining risk limits.
Understand Time Decay: Avoid holding OTM options for too long without movement in underlying.
Diversify Strategies: Combine hedging, speculation, and income strategies.

selling Eurusddaily time frame market is bullish
4hr = bearish
1hr = bearish
entry at 50% area of 1hr timeframe

Part 6 Institutional Trading Key Terms in Options Trading
Let’s break down the important jargon:
Call Option (CE):
Gives the right to buy an asset at a fixed price within a certain time.
Example: You buy a Reliance 2500 Call. It means you can buy Reliance shares at ₹2500 anytime before expiry, even if the market price rises to ₹2700.
Put Option (PE):
Gives the right to sell an asset at a fixed price within a certain time.
Example: You buy a Reliance 2500 Put. It means you can sell Reliance at ₹2500, even if the price falls to ₹2300.
Strike Price:
The price at which you agree to buy (call) or sell (put). Think of it as the “deal price.”
Premium:
The fee you pay to buy an option. Like a booking fee—it’s non-refundable.
Example: You buy Reliance 2500 Call for ₹50 premium. Your cost is ₹50 × 505 (lot size) = ₹25,250.
Expiry Date:
Every option has a limited life. After expiry, it becomes worthless.
In India, stock options usually expire on the last Thursday of every month. Weekly options for Nifty and Bank Nifty expire every Thursday.
In-the-Money (ITM), At-the-Money (ATM), Out-of-the-Money (OTM):
ITM Call: Strike price < current market price. (Option already profitable).
ATM Call: Strike price ≈ current price.
OTM Call: Strike price > current market price. (Not profitable yet).
How Options Work – Simple Examples
Example 1: Call Option
You expect Infosys to rise from ₹1500 to ₹1600 in the next month.
You buy a Call Option at ₹1500 strike for ₹40 premium.
Scenario 1: Infosys rises to ₹1600. You can buy at ₹1500 and sell at ₹1600 → profit ₹100 per share – ₹40 premium = ₹60 net.
Scenario 2: Infosys stays at ₹1500. No use. You lose only the premium (₹40).
Scenario 3: Infosys falls to ₹1400. You don’t exercise. Loss = only premium.
Example 2: Put Option
You expect Infosys to fall from ₹1500 to ₹1400.
You buy a Put Option at ₹1500 strike for ₹35 premium.
Scenario 1: Infosys falls to ₹1400. You sell at ₹1500 and buy back at ₹1400 → profit ₹100 – ₹35 = ₹65 net.
Scenario 2: Infosys stays at ₹1500. No use. Loss = ₹35 premium.
So, in options trading:
Maximum loss = premium paid.
Maximum profit = unlimited (for calls) or large (for puts).

Short Idea (EUR/USD)Entry: Around 1.1848 (current price level)
Stop Loss (SL): 1.1859 (above recent swing high)
Target 1: 1.1834 (support area shown on your chart)
Target 2: 1.1825 (if momentum continues downward)
Reasoning:
Price is failing to break above resistance at 1.1850-1.1860.
Recent candles show rejection wicks, indicating sellers stepping in.
Risk-to-reward looks favorable with SL above resistance and TP near prior support.

EURO/USDDealing Range & Discount Zone: Price is in the lower half of the recent range, where buyers may step in.
FVG (Fair Value Gap): Market may retrace to fill imbalance before moving higher.
Bullish Order Block: Strong demand area below, likely to support price if tested.
Trendline: Price is compressing under a descending trendline.
Scenarios:
Break above trendline → bullish continuation.
Small dip to order block → reversal upward.
👉 Overall bias: Bullish, with retracement possible before upside move.

EURUSD Short PossibilitesEURO looks bearish during NY Open targeting the H1 fvg for a quick reversal

EURUSD - MONDAY RANGE Good morning, traders. It's Monday, and I'm looking for a buy on the EURO after it takes out the Asia low. I'm expecting a bounce up from that 15-minute FVG (Fair Value Gap).

Is EUR/USD Setting Up for a Massive Bullish Move?My EUR/USD analysis is a multi-timeframe forecast focusing on key institutional levels. The daily chart provides a long-term perspective, showing the pair in a consolidation phase after a significant downtrend. I've identified a very powerful sell zone from 2020 that represents a major historical resistance level. I expect sellers to enter the market if the price re-approaches this area.
On the 4-hour chart, the focus shifts to the immediate price action. The pair is currently in a tight consolidating range. My strategy is to wait patiently for a clear breakout from this range. I have identified a Green Order Block (OB) and a Buyer Liquidity zone below the current price. My primary thesis is that the price may drop to these levels to grab liquidity before a larger move upwards.
I've outlined two potential bullish scenarios, both of which target the major sell zone. The first (blue arrow) involves a drop to the buyer liquidity zone before the rally, while the second (white arrow) predicts a more direct breakout. A key part of my plan is to look for confirmation on a lower timeframe, such as a change of character, before entering a long position.
In essence, my analysis is a road map for a potential long trade, but it emphasizes patience, confirmation, and a rule-based approach. The core idea is to follow institutional footprints by targeting liquidity zones and trading with the expected direction of smart money. I will not enter a trade until my specific breakout criteria are met, ensuring a high-probability setup.

EURUSD(20250912) Today's AnalysisMarket News:
U.S. initial jobless claims surged to 263,000 in the week ending September 6, reaching a near four-year high. Traders are fully pricing in three Federal Reserve interest rate cuts by the end of 2025.
Technical Analysis:
Today's Buy/Sell Levels:
1.1712
Support and Resistance Levels:
1.1798
1.1766
1.1745
1.1679
1.1658
1.1626
Trading Strategy:
If the price breaks above 1.1745, consider entering a buy position, with the first target price at 1.1766.
If the price breaks below 1.1712, consider entering a sell position, with the first target price at 1.1679

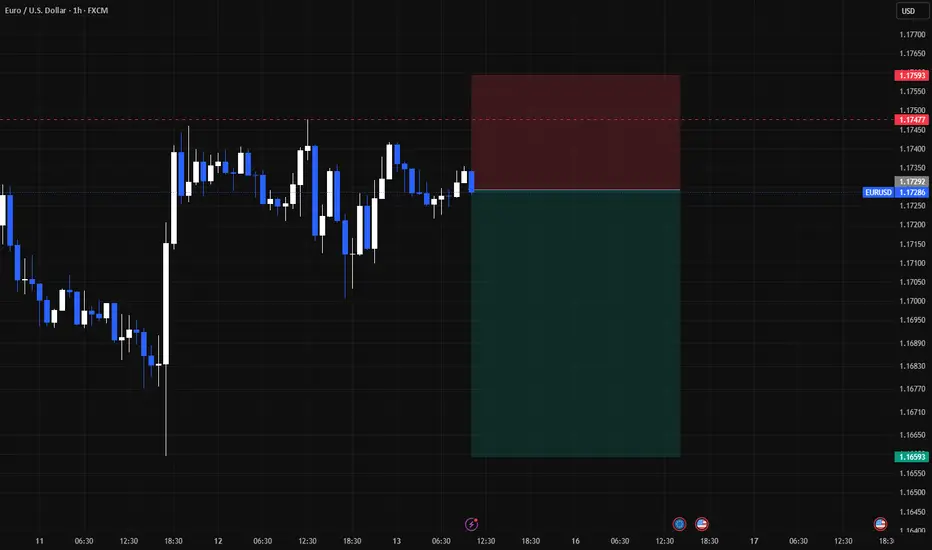
EUR/USD | 30M | Live Execution Zone
We’ve marked out our trade zone post-CPI. Price tapped into our supply pocket at 1.1747 and is now reacting as anticipated. Position structured with:
Entry at the rejection from supply
Stop above the sweep zone
Target the lower liquidity pool near 1.1680
Key narrative: Market took out liquidity on both sides, confirmed displacement, and is now showing signs of delivering south before the next structural shift.
This is a clean setup aligning with the higher-timeframe bias — patience and discipline doing the work.
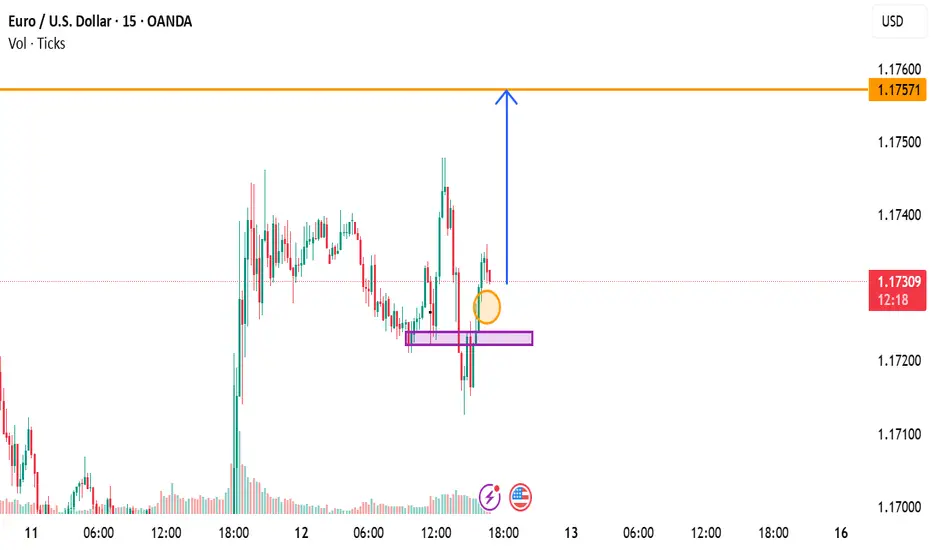
EURUSD Buy SetupPrice has successfully retested a key support zone (marked in purple) and is showing strong bullish momentum on the 15-minute chart. This retest confirms buyers are stepping back in.
📌 Entry: 1.1732
📌 Target: 1.17798
This setup offers a favorable risk-to-reward ratio, aiming for a clean move back to the previous swing high. As long as price stays above the support zone, bias remains bullish
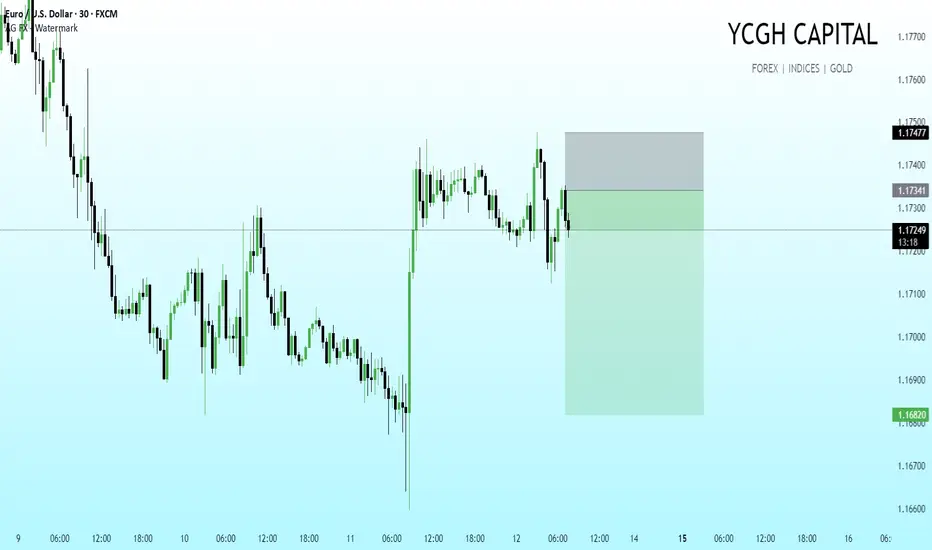
EUR/USD | 1H | Smart Money OutlookPrice has swept the previous low and is reacting from a key liquidity pocket. Structure remains intact for a potential bullish delivery. With CPI expected to print on the stronger side, we could see a favorable USD reaction — but the market is already pricing in the move, setting up EUR/USD for a liquidity grab before a push higher.
I’m watching for:
Accumulation near 1.1680 zone
Break of internal structure for confirmation
Targeting the 1.1730 region as the next supply area
If CPI comes out as expected, we could get that impulsive leg upward aligning with this setup.
