EURUSD – Bottoming out, poised for breakoutAfter a sharp decline since late July, EURUSD is consolidating around the key support zone of 1.1520–1.1580. On the H4 chart, price remains within a descending channel but is beginning to form a compression pattern — often a precursor to a strong breakout. Bullish momentum is building as price rebounds from the 1.1480 low and holds a modest upward bias.
On the macro front, the USD is weakening as markets increasingly expect the Fed to cut interest rates in September, especially after a string of weak labor data. In contrast, the EUR is supported by stable inflation and the ECB’s persistent hawkish stance. If the current support zone holds, EURUSD could break out of the descending channel and target the resistance levels at 1.1680 and 1.1770.
USDEUR trade ideas

EUR/USD Next Move - Bullish Continuation Setup 📊 1H Trend: Currently bullish, with structure showing higher lows and higher highs.
I am monitoring a potential long opportunity at my defined zone.
🔑 Key Buy Zone
1.15885 – 1.15685
This area is a potential demand zone where price could bounce.
Stop Loss (SL): 1.15600
📌 Entry Strategy
Entry should only be considered after confirmation on the 15m and 5m timeframes.
This ensures the setup is aligned with market structure and avoids premature entries.
🎯 Targets
TP1: 1.16418
TP2: 1.16950
Taking partial profits at TP1 and running the rest toward TP2 could provide a balanced risk-to-reward.
⚠️ Disclaimer: This is a market observation for educational purposes only. Not financial advice. Always trade based on your own plan and risk management.

EURUSD TankThis looks like a very good spot to SELL the EURUSD. Economic factors are showing slightly weak US dollar, but COT reports indicate Commercials still have a lot of LONG contracts. This gives a very nice confluence with a 61.8% retracement of last week's bearish move, also paired with an attractive $1.70 price tag along with it.

BIGGER PICTURE EURUSD/FIBER ANALYSIS 06-AUG-2025CMP: 1.1600
Supports: 1.1389/1.1250/1.1055/1.016/0.9534
Resistances: 1.1789/1.1834
As long as the above supports hold, we can expect more bullish move towards 1.1715.
Ultimate target Zone 1: 1.1919-1.2300
1.2577
Ultimate target Zone 2: 1.2970-1.3234-1.3655
Extensions: 1.4200, 1.4700

EURUSD – bearish trend remains dominantEURUSD is trading within a clearly defined descending channel. After a slight rebound from the 1.14800 support zone, the price is now retesting the resistance area around 1.16000 – a zone filled with multiple previous Fair Value Gaps (FVGs). If the price fails to break above this level, the bearish trend is likely to continue with a potential move down toward 1.14000.
Latest news:
Weaker-than-expected US job data initially pressured the USD, but growing expectations that the Fed will maintain its tightening stance are helping the dollar recover – putting downward pressure on the euro.
Summary:
If EURUSD fails to break above 1.16000, a continuation of the downtrend toward 1.14000 is likely in the coming days.

EURUSD remains in a downtrendEUR/USD continues to move within a descending channel, with the 1.1600 area acting as strong resistance. Recent price action suggests the current rebound may be just a retest before the downtrend resumes. The next bearish target is around the 1.1390 support zone.
On the news front, although a strong U.S. PMI puts slight pressure on EUR, the USD faces mixed forces:
Weak NFP data increases expectations of a Fed rate cut.
The new US–EU trade deal imposing a 15% tariff has sharply weakened the euro.
Eurozone PMI improved but remains below 50, indicating a still-fragile recovery.

EUR/USD May Dip to 1.136 Before Targeting 1.178 and 1.182EUR/USD is in a broader uptrend but may first take a minor dip toward the 1.136 support zone before resuming its bullish momentum. This pullback could provide a healthier structure for the next leg higher.
If the pair holds above 1.136 and shows bullish confirmation, it could head toward the next upside targets at 1.178 and 1.182 in the coming sessions.
Key Levels:
🔻 Short-term Support: 1.136
🎯 Upside Targets: 1.178 → 1.182
📌 Bias: Bullish above 1.136 on confirmation
🔍 Watch for a higher low and momentum shift near 1.136
#EURUSD #ForexAnalysis #PriceAction #BullishOutlook #TechnicalAnalysis #TrueDirections1

EUR/USD 1H Chart Analysis – Bearish Setup Alert!Price is currently forming a rising wedge, a pattern often associated with a bearish reversal. After a sharp bullish impulse, the pair is showing signs of exhaustion below the key resistance zone (1.1575 - 1.1596).
🔻 Potential Bearish Scenario:
Breakdown below the wedge support could trigger a deeper correction.
Immediate support: 1.1546 - 1.1540
If that breaks, next downside targets:
➤ 1.1485,
➤ 1.1416,
➤ 1.1408
🔒 Invalidation Zone:
Bullish momentum may resume only if price breaks and closes above 1.1596 with volume.
📌 Keep an eye on price action near the wedge boundary—breakout or breakdown will define the next move.
#EURUSD #ForexTrading #PriceAction #TechnicalAnalysis #FXMarket #TradingSetup #ChartPatterns #BearishSignal

EURUSD Eyes Short Structure Break📌 EURUSD 15-min — Structure Breakdown After Consolidation Near Resistance
Technical Chart Breakdown (15m):
🔴 SELL Signal triggered after price rejected upper boundary of a tight consolidation box.
🟠 Multiple rejections formed just below 1.158 — suggesting local supply absorption.
🔻 Price broke below the red moving average and consolidation low, confirming momentum shift.
🟡 Leola Lens caution structure (box cluster) marked a potential pause before breakdown.
📉 Downside focus remains valid as long as price stays below 1.158.
🔍 Structural target zone extends toward 1.15, with intermediate reaction levels visible.
Disclaimer: This chart is shared for educational purposes only and does not constitute financial advice or a recommendation to trade. Always conduct your own analysis and manage risk appropriately.

EURUSD after NFPFollowing Friday’s NFP release, EURUSD flipped bearish structure. I’m now looking for a retracement into a key demand zone, where I’ll be watching for buy setups.
Until then, I’ll look for a possible sell-to-buy scenario — shorting the move down into demand, and then reassessing for bullish confirmation.
Let’s see how price reacts on Monday.

EURUSD – Euro tumbles under strong dollar pressureAfter a brief uptick following the US–EU trade agreement, EUR/USD quickly sank under a wave of strong US economic data. While import tariffs on EU goods were reduced to 15%, the US dollar gained more as capital kept flowing into the US thanks to a Q2 GDP growth above 3%, steady PCE, and a strong ADP report.
On the H4 chart, the bearish structure is clear: EUR/USD broke below key support and formed a series of unfilled FVGs, signaling sellers are still in control. The current pullback towards the 1.14300 resistance zone could act as a bull trap, with the next target eyed near 1.12300 — a likely liquidity zone.
If this area breaks, the 1.1200 mark may be triggered next. Meanwhile, USD strength shows no signs of fading — especially as the Fed maintains a cautious stance with no easing in sight. The euro is no longer seen as a safe haven, and investors are gradually pulling out.

EUR/USD Elliott Wave Count Signals Downside TargetsThe EUR/USD chart is displaying a completed 5-wave Elliott impulse structure, suggesting the potential start of a larger corrective move to the downside. Wave 5 appears to have finished after a classic ending diagonal pattern, with price now breaking below the wave 4 support trendline — a strong confirmation of trend exhaustion.
Currently, price is retracing upward towards the 0.5–0.618 Fibonacci retracement zone of the last impulsive leg, around 1.15912–1.16383, which may serve as the final rejection zone for bears to re-enter. This area aligns perfectly with prior support-turned-resistance and is considered the potential reversal pocket.
If price holds below the 1.17869 invalidation level, the structure supports the beginning of an ABC correction or a larger bearish impulse.
Target 1 (T1): 1.14800
Target 2 (T2): 1.13915
Stop Loss (SL): 1.17869
This scenario remains valid as long as the price does not break above 1.17869. A clean break and close above this level would invalidate the bearish setup and suggest a possible wave extension.

EUR/USD - 1H Bearish Scenario ! Sell Zone Identification🔍 Market Context
On the 1H timeframe, EUR/USD continues to show a bearish market structure.
Price is expected to bounce back into a premium area before resuming its downward trend.
This creates a fresh Sell Zone between 1.15350 – 1.15800, aligning with supply and retracement levels.
✅ Trade Plan
Sell Zone: 1.15400 – 1.15800
Execution: Wait for confirmation on 5m or 15m timeframe before entry:
Break of Structure (BOS)
Strong bearish displacement candle
Stop Loss (SL): Above 1.1600
Targets (TP):
TP1: 1.14700
TP2: 1.14400
After Than Trail
⚠️ Risk Note
Do not enter blindly — always wait for lower timeframe confirmation.
Manage risk carefully, as bounce-backs can trap early sellers.

Non farm payroll Analysis EURUSD 15minWe can expect market to go for buystops and then we can expect it would go for sell side liquidity , as we have bearish bias right now we can excpet market to go for first buyside sellstops and then sellside, keep follow for more updates

EURUSD at risk of reversal: will sellers take control?Hello everyone! What are your thoughts on EURUSD?
Lately, the euro has been under pressure due to growing weakness in the Eurozone economy. The European Central Bank (ECB) has sent out more cautious signals in response to rising recession risks and cooling inflation. This increases the likelihood that the ECB may wrap up its tightening cycle earlier than the Fed – a shift that could weigh heavily on EURUSD.
From a technical standpoint, EURUSD recently hit a peak around 1.1766 after several attempts, and a CHOCH (Change of Character) reversal pattern may be forming. If the pair fails to reclaim the 1.1766 zone, a deeper downside scenario is likely to unfold.
As for me, I’m currently favoring short setups, especially around supply zones or after failed retests. Discipline and solid risk management remain my top priorities.
How about you? What’s your take on this pair?

EURUSD: Short-term rebound signals after sharp dropEURUSD has just reacted to a key demand zone and is showing signs of a technical rebound. A small double bottom pattern is forming on the 3H chart, indicating that buyers are starting to return. If the price holds above this recent low, the short-term bullish scenario could continue.
On the news front, the US JOLTS data came in lower than expected, reflecting a cooling labor market. This reduces the likelihood of further Fed tightening, creating room for the euro to recover slightly.
Strategy: Favor buying if price remains above the support zone, with a potential move to retest the upper FVG area before the market makes its next decision.

EURUSDIn my previous post, I mentioned being in EUR/USD longs; however, I exited the position after the price action failed to align with my expectations. I anticipated a sweep of the recent low before a continuation to the upside.
Let’s now examine the EUR/USD on the 4H timeframe. As expected, the price took out the previous low, dropped into a key Demand Zone, and reacted with a strong bullish move. My targets remain the previous High, followed by the swing high marked by the red line. Let's wait and see what Monday brings.
With the DXY losing value, I expect the euro to appreciate—assuming no significant fundamental shifts occur. That said, if the price struggles to form a new high or a higher high (HH), I will reassess my bias accordingly.

EUR/USD Under Pressure : Sell or Buy ? The EUR/USD pair remains under mild bearish pressure, hovering around the 1.1700 mark and extending its Thursday downtrend. Meanwhile, the US Dollar (USD) stays firm despite growing optimism over improving US-China relations. However, the ongoing tension between Trump and Powell continues to capture market attention.
In response to these developments, EUR/USD has stalled its previous rally. On the chart, the pair is forming a series of lower highs, moving within a narrowing wedge pattern. The 1.1600 level now emerges as the critical battleground between bulls and bears.
Do you think EUR/USD can successfully defend this support zone? Let us know your thoughts!

EURUSD – Bullish momentum fades, signs of a reversal emergeEURUSD is approaching the key resistance zone at 1.1780, a level that has been rejected multiple times in the past. On the H4 chart, the pair remains firmly within a descending channel since early July, with several FVG zones stacked above—indicating growing selling pressure. The recent upside momentum is clearly weakening, raising the risk of a deeper pullback.
Market context:
– The US dollar continues to gain support from strong economic data, while the Eurozone lacks clear signs of recovery.
– Traders are holding their breath ahead of upcoming Eurozone inflation data and the US PCE report—events that could trigger significant moves.
Trade setup: If EURUSD fails to break above 1.1780, a drop toward the 1.1610 support zone becomes increasingly likely.

EURUSD: Will the monthly candle flip bullish or stay bearish?Hello traders , here is the full multi time frame analysis for this pair, let me know in the comment section below if you have any questions , the entry will be taken only if all rules of the strategies will be satisfied. wait for more price action to develop before taking any position. I suggest you keep this pair on your watchlist and see if the rules of your strategy are satisfied.
🧠💡 Share your unique analysis, thoughts, and ideas in the comments section below. I'm excited to hear your perspective on this pair .
💭🔍 Don't hesitate to comment if you have any questions or queries regarding this analysis.

EURUSD: The Rally Was Just a Trap – Bears Are Ready to Strike!After a strong rebound toward the 1.18400 zone driven by short-term optimism, EURUSD is now facing a potential reversal as price stalls within multiple Fair Value Gap zones. The chart reveals weakening bullish momentum, with lower highs forming inside a key resistance area.
Fresh U.S. data: Jobless claims dropped more than expected, giving the USD a solid boost. Meanwhile, the ECB remains hesitant, showing little conviction as Eurozone inflation cools.
A bearish scenario is unfolding: price forms a flag pattern → breaks the ascending channel → targets 1.17300. A break below this level could send EURUSD toward 1.16500 or even lower.
Bulls, beware! This could be a bull trap — and the bears are gearing up for a counterattack.
SELL setup: Look for bearish reversal signals around 1.18300–1.18400. Stop-loss above the high, first target at 1.17300.

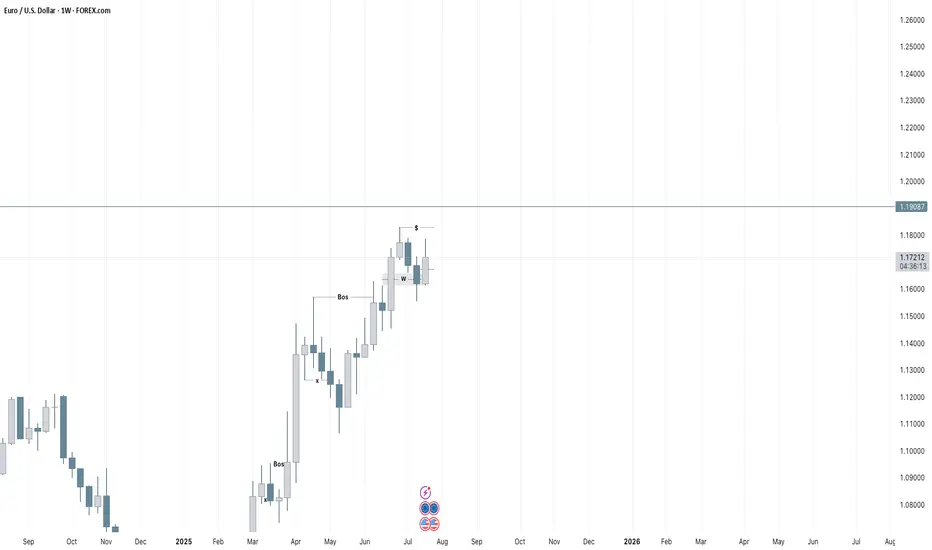
Technical Insights on Weekly timeframe ChartPrice has reacted to the weekly Fair Value Gap (FVG), indicating a potential bullish move toward liquidity resting above, as the market seeks to rebalance and mitigate inefficiencies and we need Confirmations.
EURUSD: Bearish Breakdown in SightEURUSD is currently holding above the 1.173 support zone, but the bearish structure is becoming more evident. The downward trendline and nearby resistance have repeatedly rejected price rebounds.
If the support at 1.173 breaks, a sharp move toward the 1.168 target is likely — a key previous low.
Trend: Prefer SELL if a breakdown confirms – low risk, high potential.
