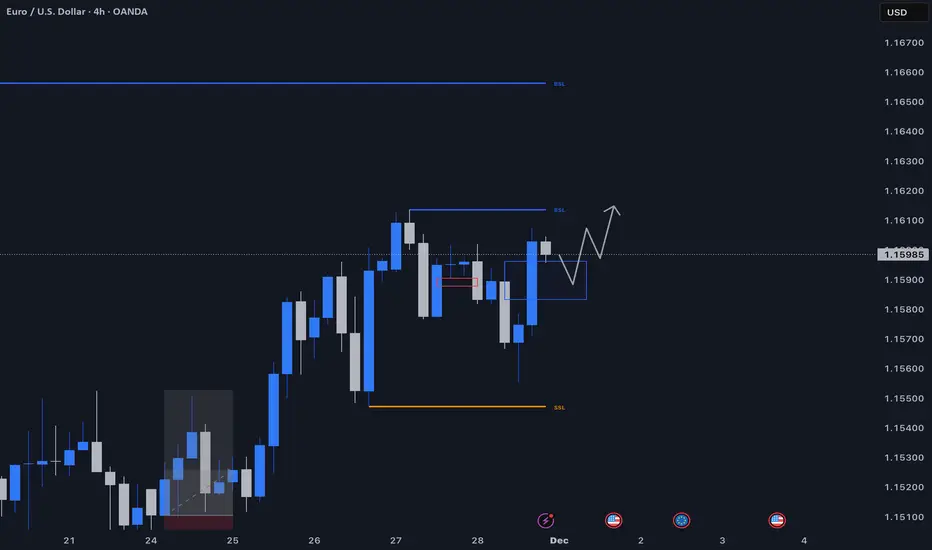
EURUSD MULTI TIMEFRAME ANALYSIS EURUSD plan: I’m first waiting for price to sweep the Asian range low. After the sweep, if bullish momentum kicks in and I see a clear structure shift on the lower time frames, I’ll take a long targeting the weekly high of 10 Nov 2025 at 1.16560.
However, price may skip the sweep and push higher directly. If that happens, I’m fine with it — I’ll look for alternative long entries. Another possible scenario is a sweep of the Asian range high first, followed by a pullback inside the range before the move starts.
Noting correlation: EURUSD looks bullish for me, while GBPUSD has a bearish bias today. It’s a contradictory mix, so the setup isn’t the cleanest, but the R:R remains solid. I’ll monitor all scenarios and execute only when structure confirms.
Trade ideas

EURUSD – Retesting Demand Zone for Potential Upside ReversalPrice has tapped into a well-defined HTF demand zone after a controlled selloff. The latest wick into the zone suggests absorption and potential willingness to push higher.
If the zone continues to hold, I’m expecting bullish orderflow to kick in, leading to a structure shift and an upward continuation toward the next liquidity pool.
Bullish Path:
• Sweep into HTF demand
• Hold above the blue line (micro support)
• Shift in structure
• Continuation toward upside inefficiencies
⚠️ ENTRY CONDITION (IMPORTANT):
I will take the trade only if the LTF replicates the same structure and confirmations I’m anticipating on the HTF. No LTF alignment = No trade.
The idea remains valid as long as price respects the demand zone and doesn’t close decisively below it.

EURUSD MULTI TIMEFRAME ANALYSIS Hello traders , here is the full multi time frame analysis for this pair, let me know in the comment section below if you have any questions , the entry will be taken only if all rules of the strategies will be satisfied. wait for more price action to develop before taking any position. I suggest you keep this pair on your watchlist and see if the rules of your strategy are satisfied.

Interesting EURUSD Rebounce w/ chance of BPR and FVG respectedIdea create from FVG 1H respected through US High Impact News. Market interesting with chance of BPR 15m short term and rebounce with OB 5M look like strong effective. Lets risk a bit for SHORT position to see if price can be back at BPR 15m, if right then we looking for BUY position when market effective with OB 5M. If not any condition above, lossed the risk and cancel the BUY position.

Common Mistakes Traders Make with OI Analysis1. Assuming Rising OI Always Means Trend Continuation
A widespread misconception is that rising OI always confirms the current price trend. This is not always true. OI increases whenever new positions are added, but it does not tell us whether those positions are long or short.
If price rises and OI rises, traders often assume “trend is strong.”
But this could be short sellers entering aggressively, expecting a reversal.
Similarly, a falling market with rising OI could represent fresh long build-up by contrarian traders.
Why this is dangerous:
Misreading this combination can trick traders into continuing with a trend that is near exhaustion.
Correct approach:
Always read OI along with volume, price action, and context rather than in isolation.
2. Ignoring the Impact of Expiry Week
During expiry week, OI behaves very differently. Many traders fail to adjust for this.
Positions are squared off.
New positions are not added in large numbers.
Premiums decay rapidly.
Large players use rollovers that distort OI patterns.
Hence, traditional OI interpretations—long buildup, short covering, etc.—often fail because traders misread expiry-related unwinding as trend reversal.
Correct approach:
During expiry, interpret OI with caution and focus more on price action and volume rather than OI signals alone.
3. Not Understanding Rollovers in Futures OI
Many beginners assume rising OI in the near-month futures means new positions are being built. Instead, what might actually be happening is:
Positions shifting from near-month to next-month contracts.
Hedging activity by institutions.
Calendar spreads that distort near-month OI data.
This mistake leads traders to overestimate trend strength.
Correct approach:
Study OI across all three series (near, next, and far) to understand rollover behavior properly.
4. Misinterpreting OI Changes Without Considering Volume
OI alone cannot confirm the strength of a move. Many traders rely only on OI changes without checking volume.
High OI + low volume = weak or misleading signal.
High volume + high OI = strong confirmation.
Low volume + decreasing OI during price rise often indicates a false breakout.
Volume validates OI. Ignoring it causes traders to enter trades without proper confirmation.
Correct approach:
Always combine OI with volume analysis for accurate interpretation.
5. Treating OI Spikes as Market Direction Indicators
Large spikes in OI sometimes occur because:
Institutions hedge large positions.
Market makers adjust exposure.
Spread trading activity increases.
Options sellers deploy neutral strategies like short straddles and strangles.
These do not indicate directional bias. Retail traders often mistake such spikes for bullish or bearish signals, resulting in incorrect directional trades.
Correct approach:
Identify whether the OI spike is due to directional positions or non-directional strategies (like option selling).
6. Misreading Options OI Without Understanding Option Selling
Options OI is heavily influenced by option writers, not buyers. Newer traders often assume:
Call OI rising → bullish
Put OI rising → bearish
In reality:
Call writers increase call OI when they expect resistance.
Put writers increase put OI when they expect support.
Hence call OI rising often signals resistance, not strength, while put OI rising signals support, not weakness.
Correct approach:
Always analyze OI from the perspective of option sellers, who dominate the market.
7. Forgetting That OI is a Lagging Indicator
OI does not update tick by tick. Many traders treat it like real-time data and make impulsive trades.
Because OI updates slowly:
Sudden intraday reversals may not immediately reflect in OI.
By the time OI suggests a trend is weakening, price may already have reversed.
Correct approach:
Use OI as a confirmation tool, not a primary signal generator.
8. Over-Reliance on OI Without Price Action
Some traders depend entirely on OI data and ignore charts altogether.
This can lead to:
Entering when price is in consolidation.
Missing out on key support/resistance levels.
Falling for traps created by short-term OI fluctuations.
OI cannot tell you the exact entry or exit point—price action provides that.
Correct approach:
Use OI to understand behind-the-scenes market behavior, but rely on price action for execution.
9. Not Accounting for Market Maker Adjustments
Market makers frequently adjust their books, making OI fluctuate without real directional intent.
Retail traders often mistake this for trend-building activity.
These adjustments occur due to:
Delta hedging
Neutral strategies
Risk balancing
Changes in implied volatility
This can create misleading OI buildups or unwinding.
Correct approach:
Interpret OI only after analyzing IV trends, premiums, and market structure.
10. Ignoring the Broader Market Environment
OI signals lose meaning in certain market conditions:
High volatility
Major news events
Budget or RBI announcements
Global market shocks
Overnight gaps
During these periods, traders still try to use OI to predict short-term moves and end up getting trapped.
Correct approach:
In high-event environments, reduce the weight of OI analysis and rely more on price structure and risk management.
11. Believing That OI is a Predictive Tool
Many traders expect OI to tell them in advance:
When a breakout will happen
Which way the market will move
How strong the move will be
But OI is not predictive—it only shows participation, not intention.
This belief causes false confidence and poor decision-making.
Correct approach:
Treat OI as a supporting indicator, not a forecasting tool.
12. Not Adjusting OI Interpretation for Different Instruments
OI behaves differently in:
Index options
Stock options
Futures
Weekly vs monthly expiries
Applying the same OI interpretation across all instruments is a major mistake. For example:
Stock options have lower liquidity → OI signals are weaker.
Index options have high liquidity → OI signals are more reliable.
Correct approach:
Know the nature of the instrument before applying OI analysis.
Conclusion
OI is extremely powerful, but only when interpreted correctly. Most traders misuse it by treating it as a direct prediction tool rather than a secondary confirmation metric. The key to avoiding mistakes is to use OI together with price action, volume, volatility, and overall market context. Understanding that OI represents participation—not direction—helps traders avoid false assumptions and make better-informed decisions.
EURUSD - Intraday SetupRisk Management / Event Warning
Trade Management: If the trade activates and moves +15 pips to 1.16650, the Stop Loss will be moved to Breakeven (1.16500) to lock in a risk-free trade.
Fundamental Risk: High-impact USD data (US Usual Weekly Earnings) is due on December 4th. Volatility may spike around 8:30 PM IST. The position will be monitored closely or partially closed before this release to protect profits.

Option Trading & Derivatives (F&O) Trading1. What Are Derivatives?
A derivative is a financial contract whose value is derived from an underlying asset. This underlying can be:
Stocks
Indices (Nifty, Bank Nifty)
Commodities
Currencies
Interest rates
Derivatives do not represent ownership of the underlying asset. Instead, they allow traders to speculate on price movements or hedge risks without directly buying the actual asset.
Why derivatives exist:
Hedging (Risk Management):
Businesses and traders use derivatives to protect against adverse price movements.
Speculation:
Traders can predict price moves and earn profits with relatively small capital (leverage).
Arbitrage:
Taking advantage of price differences across markets to generate risk-free returns.
2. What Is F&O Trading?
The F&O (Futures and Options) segment is the derivatives market where futures contracts and option contracts are traded. These instruments are standardized and regulated by exchanges like NSE and BSE in India.
Futures
A future is a contract between two parties to buy or sell the underlying asset at a predetermined price on a future date.
Key features:
Obligation to buy or sell
Mark-to-market settlement daily
High leverage
No upfront premium—margin required
Options
Options are more flexible. Here, the buyer has the right, but not the obligation, to buy or sell the underlying asset at a specific price before expiry.
This structure makes option trading safer for buyers, as maximum loss is limited to the premium paid.
3. What Is Option Trading?
Option trading involves buying or selling option contracts. Options are of two main types:
A. Call Option (CE)
A call option gives the buyer the right to buy the underlying asset at a particular price (strike price).
Used when the trader expects:
Market will go up
Example: If Nifty is at 21,000 and you expect a rise, you may buy a 21,100 CE.
B. Put Option (PE)
A put option gives the buyer the right to sell the underlying asset at a particular price.
Used when the trader expects:
Market will go down
Example: If you expect Nifty to fall from 21,000, you may buy a 20,900 PE.
4. Components of an Option Contract
Understanding option pricing requires knowing its key elements:
1. Strike Price
The price at which the buyer can buy (Call) or sell (Put) the underlying asset.
2. Premium
The cost paid by the buyer to the seller (writer).
Premium depends on volatility, time left to expiry, and price difference from the underlying.
3. Expiry Date
Options expire on a fixed date.
In India:
Index options: Weekly + monthly expiry
Stock options: Monthly expiry only
4. Lot Size
Options are traded in lots, not single shares.
5. Option Buyers vs Option Sellers
Understanding the difference is critical.
Option Buyer (Holder)
Pays premium
Has limited loss
Profit is unlimited (in calls) or high (in puts)
Buyers need strong directional movement.
Option Seller (Writer)
Receives premium
Has limited profit (premium)
Loss can be unlimited
Sellers win when markets stay sideways or move less than expected.
6. Why Do Traders Prefer Options?
1. Limited Risk for Buyers
Even if the market moves drastically against you, the maximum loss is the premium paid.
2. Low Capital Requirement
Compared to futures or stock delivery, options require lesser capital to take large positions.
3. Hedging Tool
Portfolio managers use options to protect investments from downside risk.
4. Flexibility
Options allow strategies for bullish, bearish, or sideways markets.
7. How Options Derive Value — Premium Breakdown
Option premium consists of:
A. Intrinsic Value
The actual value based on the current market price.
B. Time Value
The value of the time remaining before expiry.
Longer duration = higher premium.
C. Volatility Impact
High volatility increases premium as price movement expectations rise.
8. Types of Options Based on Moneyness
1. In-the-Money (ITM)
Call: Strike < Spot
Put: Strike > Spot
These have intrinsic value.
2. At-the-Money (ATM)
Strike price = current market price.
3. Out-of-the-Money (OTM)
Call: Strike > Spot
Put: Strike < Spot
Cheaper but riskier.
9. F&O Trading Strategies Using Options
Options are versatile, enabling a variety of strategies.
1. Directional Strategies
Good for trending markets:
Long Call (Bullish)
Long Put (Bearish)
Call Spread / Put Spread
2. Non-Directional Strategies
Good for sideways markets:
Iron Condor
Short Straddle
Short Strangle
3. Hedging Strategies
Protective Put
Covered Call
Traders select strategies based on volatility, trend strength, and risk appetite.
10. Risks in F&O Trading
Even though options look simple, F&O trading carries significant risks:
1. High Volatility Risk
Unexpected news can move prices sharply.
2. Time Decay Risk
Option buyers lose value each day.
3. Leverage Risk
Small capital controls large positions, increasing both profits and losses.
4. Liquidity Risk
Some stocks in F&O have low volume, making entry/exit difficult.
11. Who Should Trade Options?
Option trading suits:
Traders who understand market direction
Those with small capital
Risk-managed traders
Portfolio investors wanting hedge protection
Advanced traders who use spreads and combinations
However, without knowledge, beginners should avoid naked option selling due to unlimited risk.
12. Role of F&O in the Financial Market
F&O segment plays a crucial role in overall market stability:
1. Risk Transfer Mechanism
Allows shifting risk between participants.
2. Enhances Market Liquidity
More participants → deeper markets.
3. Price Discovery
F&O prices indicate future expectations.
4. Improves Market Efficiency
Arbitrage aligns cash and futures prices.
Conclusion
Option trading and F&O derivatives form the backbone of modern financial markets. They offer traders the ability to hedge risk, speculate with lower capital, and access leverage for higher potential returns. Options, in particular, stand out because they provide flexibility through calls and puts, limited loss for buyers, and strategic combinations that can suit any market condition. However, the power of leverage and complexity also requires strong understanding, disciplined risk management, and strategic execution. For traders who master these skills, the F&O market becomes a powerful tool for generating consistent returns and managing market uncertainty effectively.

Index Rebalancing Impact1. Why Index Rebalancing Happens
Indices are meant to represent a particular segment of the market. Over time, however:
Some companies grow while others shrink.
Market capitalizations change.
New leaders emerge in sectors.
Corporate actions (mergers, delistings, bankruptcies) occur.
Market liquidity and trading patterns evolve.
To maintain accuracy and credibility, index providers periodically evaluate components based on criteria such as:
Free-float market capitalization
Liquidity (trading volumes and turnover)
Sector representation
Corporate governance and regulatory compliance
Financial performance
Rebalancing ensures that the index remains aligned with the current structure and performance of the market.
2. How Rebalancing Works
The rebalancing process typically includes:
a. Announcement Phase
Index providers (NSE Indices, MSCI, FTSE Russell, S&P Dow Jones) release the final list of changes ahead of implementation, typically 2–4 weeks in advance. This gives institutional investors time to prepare.
b. Execution Day
On the official rebalancing date—often coinciding with the end of a quarter—index funds and ETFs must:
Buy stocks that are being added.
Sell stocks that are being removed.
Adjust weightings for stocks that remain but whose weight has changed.
This creates heightened trading activity, especially in the closing session (closing auction window).
c. Post-Rebalance Adjustment
Stocks may continue to adjust over the next few sessions as traders reposition and arbitrage strategies unwind.
3. Impact of Index Rebalancing
A. Price Impact on Stocks Being Added
When a stock is added to a major index:
Index funds buy the stock, leading to strong demand.
Prices often surge in the short term (known as the index inclusion effect).
Liquidity improves due to higher institutional participation.
Valuations may rise as more ETFs and passive funds accumulate holdings.
This effect is especially pronounced in indices with large passive following such as Nifty 50, S&P 500, or MSCI Emerging Markets.
However, this rise may be temporary—after the initial bounce, prices may stabilize or even decline as speculative traders exit.
B. Price Impact on Stocks Being Removed
Stocks removed from the index face:
Forced selling by index funds.
Immediate drop in price due to excess supply.
Reduced liquidity as passive funds exit.
Potential long-term decline in visibility and analyst coverage.
This is called the index deletion effect and can significantly hurt sentiment.
C. Impact on Index Levels
Rebalancing can change:
Sector weights (e.g., financials vs. IT)
Market-cap distribution
Risk and volatility characteristics
If high-weight stocks are added or removed, the impact on the overall index value can be sizeable.
D. Impact on Trading Volumes and Liquidity
Rebalancing typically results in:
Surge in trading volumes, especially in the last hour.
Increased delivery-based buying from funds.
Temporary widening of spreads due to volatility.
Short-term liquidity mismatches, particularly in mid-cap or small-cap rebalancing.
Index rebalancing days are often among the highest volume days of the year.
E. Impact on ETFs and Passive Funds
Passive funds must replicate the index exactly. Rebalancing forces:
High turnover in ETF portfolios.
Transaction costs, which may be passed on to investors.
Tracking error risks if markets are too volatile on rebalancing day.
This mechanical trading adds to price distortions.
F. Impact on Derivatives Markets
Index rebalancing impacts:
Nifty Futures and options due to hedging adjustments.
Volatility around expiry, especially if rebalancing coincides with derivatives expiry.
Straddle and strangle traders who position based on anticipated price swings.
Quant traders and arbitrage desks particularly exploit these windows.
G. Impact on Market Sentiment
Inclusion in a major index is often seen as:
A sign of strong fundamentals.
Higher institutional confidence.
Better corporate governance.
Removal, on the other hand:
Signals deterioration.
May reduce analyst and investor focus.
4. Who Benefits from Index Rebalancing?
i. Short-Term Traders
They profit from:
Price surges in stocks being added.
Price drops in stocks being removed.
Volatility spikes on execution day.
High-frequency traders (HFTs) and algorithmic funds dominate this space.
ii. Arbitrageurs
They exploit price inefficiencies created by:
Temporary demand-supply imbalance.
Tracking errors in ETFs.
Lag between announcement and execution.
iii. Corporates
Being added to an index increases visibility and prestige, potentially lowering cost of capital.
5. Risks and Challenges of Index Rebalancing
a. Excess Volatility
Prices swing sharply on announcement day and execution day, often unrelated to fundamentals.
b. Temporary Distortions
Stocks may become:
Overvalued after inclusion.
Undervalued after exclusion.
These distortions eventually normalize but create risk for traders.
c. Market Manipulation or Speculation
Some traders attempt to anticipate rebalancing outcomes, leading to front-running—buying in advance of the official announcement.
d. Overdependence on Indexing
As passive investing grows, mechanical buying/selling can destabilize markets during rebalances.
6. Global vs. Local Impacts
MSCI Rebalancing: impacts global flows in emerging markets including India.
Nifty/Sensex Rebalancing: impacts domestic flows.
Sectoral Index Rebalancing: affects specific industries.
Global indices often cause bigger price swings due to foreign fund flows.
Conclusion
Index rebalancing is a critical process in ensuring that stock market indices remain accurate and relevant. While it may seem purely technical, its impact is widespread—from stock price movements and liquidity changes to investor sentiment and fund flows. For traders, rebalancing events offer opportunities to capitalize on predictable demand patterns, but they also come with significant volatility-related risks. For long-term investors, while the day-to-day swings may not matter much, understanding how rebalancing works can help explain sudden price movements and shifts in market dynamics.
Overall, index rebalancing reinforces the efficiency and representativeness of financial markets, but it also introduces short-term inefficiencies that active participants can exploit.

Option Trading Strategies Put Buyer
Pays premium
Expects price to fall
Risk limited to premium
Profit increases as price goes down
Put Seller
Receives premium
Expects price to stay flat or go up
Risk large if market crashes

Part 1 Intraday Master ClassUnderstanding Options: Basic Terms
Before going into the rules, you must understand the core terms:
a) Call Option
A call option gives the buyer the right, but not the obligation, to buy an asset (like Nifty, Bank Nifty, stocks) at a fixed price.
b) Put Option
A put option gives the buyer the right, but not the obligation, to sell an asset at a fixed price.
c) Strike Price
The price at which the option buyer can buy (call) or sell (put) the underlying asset.
d) Premium
The price paid by the option buyer to the option seller (writer). Premium is non-refundable.
e) Expiry Date
The last date on which the option contract is valid. After expiry, the contract becomes worthless.
f) Lot Size
Each option contract is traded in fixed quantities called “lots.” You cannot buy 1 share in options, only lots.

EURUSD Strong bullish continuation. Buy-side liquidity raided below range; smart money positioned long for markup into premium arrays. Increasing upside volume and reduced sell pressure above
Part 3 Learn Institutional Trading What Are Options?
An option is a contract that gives the buyer the right, but not the obligation, to buy or sell an underlying asset at a predetermined price—known as the strike price—before or on a specific date called the expiry.
There are two types of options:
Call Option – Gives the right to buy an asset.
Put Option – Gives the right to sell an asset.
The buyer of an option pays a fee called the premium, which is the price of the contract.
In India, stock options follow an American-style exercise, allowing early exercise, while index options are European-style, meaning they can only be exercised on expiry day.


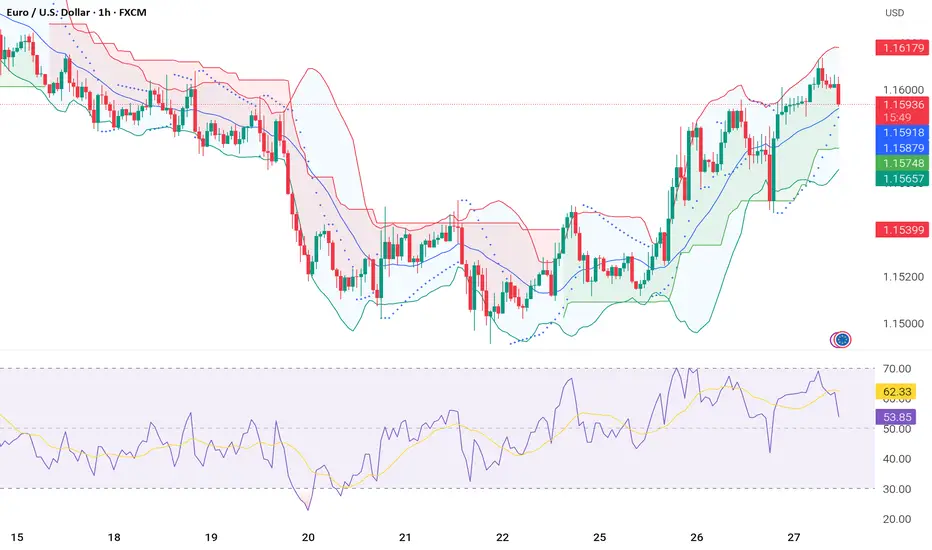
Eurusd technical Analysis EUR/USD is trading in a short-term bullish structure after bouncing from the mid-Bollinger band and holding above the intraday support zone at 1.1575–1.1565. Buyers pushed price toward the upper band, but the pair is now facing strong resistance at 1.1615–1.1620, where recent candles show rejection. RSI is slowing down from the 60+ region, indicating reduced momentum. If price stays above 1.1575, a continuation toward 1.1615 remains possible, offering a 1:1 reward setup. However, a break below 1.1575 may pull the pair back toward the next support at 1.1539, signalling weakening bullish pressure.
EUR/USD Long Term BullishEUR/USD entering the bullish scenario in Long term. A strong impulse is expected in the buyers side.

EURUSD MULTI TIMEFRAME ANALYSIS Hello traders , here is the full multi time frame analysis for this pair, let me know in the comment section below if you have any questions , the entry will be taken only if all rules of the strategies will be satisfied. wait for more price action to develop before taking any position. I suggest you keep this pair on your watchlist and see if the rules of your strategy are satisfied.
Weekly bias: Bearish
Daily bias: Bearish
4H intraday trend: Bearish
I’ll wait for price to reject from my marked zone.
If the rejection holds, I’ll position myself for a short.

LONG EURUSDas i am looking for short covering, i am expecting to bounce from this levels
ENTRY - 1.14945
SL- 1.14845
TP- 1.15400

EURUSDEURUSD, I expect to come down further. This provides a strong risk–reward ratio since the downtrend is intact on 15 min, and market momentum supports continuation toward lower support levels.

EURUSD Trade idea 20/11/2025Namaste everyone 🙏
Eurusd is in a trappy orderflow rightnow, we are in a bullish poi currently that is a daily FVG, and we have a bearish H4 fvg.
This is my plan -
1.Dxy has clear buy side liquidity to take out, so if dxy taps into its FVG on H4 time frame before taking out the buy side liquidity and forms smt with eu, we can look for sells in eu
2. If dxy takes out buyside liquidity and then comes to the H4 fvg, we will let this idea pass.

EURUSD MULTI TIMEFRAME ANALYSIS Hello traders , here is the full multi time frame analysis for this pair, let me know in the comment section below if you have any questions , the entry will be taken only if all rules of the strategies will be satisfied. wait for more price action to develop before taking any position. I suggest you keep this pair on your watchlist and see if the rules of your strategy are satisfied.


EUR/USD Trend Analysis: Will Bulls Take Control?EUR/USD Trend Analysis: Will Bulls Take Control?
EURUSD continues to trade inside a broad descending structure that has been active for several weeks, with repeated breaks of structure marking the gradual weakening of bearish momentum. The pair has shown consistent attempts to reclaim internal structure, revealing that sellers are losing dominance at each successive swing.
The recent price action highlights a slowdown in the bearish cycle, with the pair forming a compressed consolidation near the lower boundary of the channel. This type of price behavior typically represents absorption, where liquidity is collected before a potential directional shift. Multiple bullish breaks within the current leg signal that the market is preparing for a transition phase.
The chart illustrates a clear reaction to the most recent liquidity sweep, followed by a controlled reset in order flow. Buyers have stepped in aggressively in previous cycles after similar setups, suggesting that the market is once again positioning itself for a recovery attempt toward higher inefficiencies.
Volume distribution from the left side of the chart shows earlier institutional engagement, and the current region aligns with historical accumulation behaviors seen in prior EURUSD reversals. If the pair maintains strength within this consolidation pocket, the next move could be a bullish repricing wave targeting unmitigated zones above.
Overall, EURUSD is showing signs of shift and structural recovery, with the current pattern favoring a bullish reaction in the coming sessions.

