EURUSDHello FRIENDS!
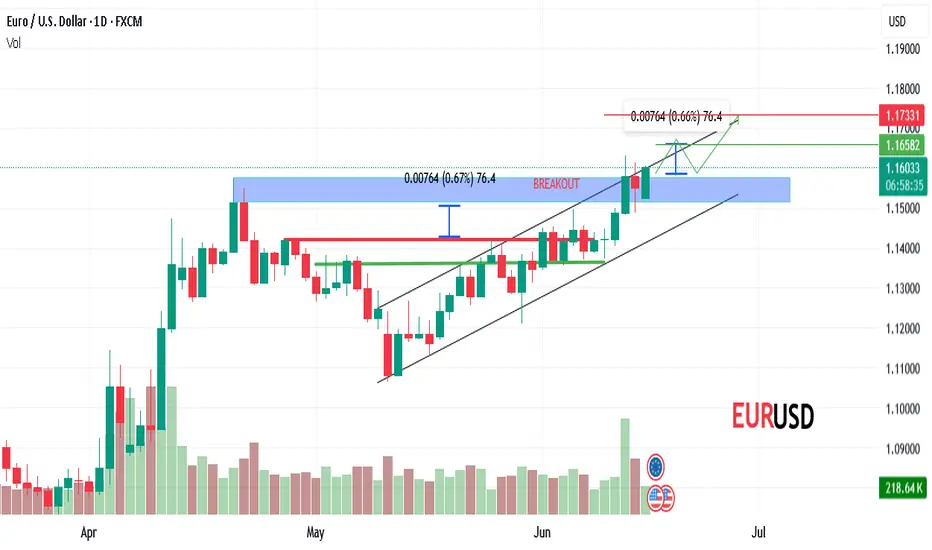
The EURUSD price formed an ascending channel pattern in D. chart
At the moment, Price Break the resistance line lower high & higher high formation.
So, I expect a Bullish move from here.
TG1:- 1.16582
TG2:- 1.17330
Trade ideas
EURUSD 4H ANALYSISEurusd has taken support from ob it's still bullish we can except price to move to weekly target that I have marked.... Follow for more updates


EURUSD – Buyers Remain in Control, Awaiting Confirmation SignalThe EURUSD pair posted a slight pullback after reaching the upper resistance zone of the ascending channel around 1.16130 on June 12. However, the bullish structure remains intact, with higher lows and clear respect for the upward channel on the 8H chart.
Technically, the 1.14590 zone — which aligns with both the trendline and the EMA34 — will act as a key support area. If the price holds this level and rebounds, the likelihood of retesting the 1.16130 high is strong. Conversely, a break below 1.14590 could trigger a deeper correction.
On the fundamental side, the euro is supported by expectations that the ECB will maintain its current interest rates, while cooling U.S. CPI data has weakened the dollar.

EURUSD NEXT POSSIBLE MOVE🔵 EUR/USD | 10 June 2025 | ICT Intraday Outlook
---
🧠 Market Context:
The market opened today below the previous day’s midrange, suggesting a neutral to bearish tone in early sessions.
We are currently within a consolidation between PDH and PDL, and watching for a liquidity sweep + BOS setup in either direction.
📌 Buy Scenario (Bullish Bias):
If price breaks above 1.14312 (previous structure) and sweeps buy-side liquidity, then:
Expect a retracement back into the FVG or OTE zone between 1.14100–1.14200
Confirmation of displacement + bullish order block around this zone could signal a long opportunity.
🎯 Buy Target: Retest of PDH 1.14577, extended target toward 1.14780 and above.
📌 Sell Scenario (Bearish Bias):
If price breaks below 1.13715 (PDL), expect:
Sell-side liquidity sweep, leading to a displacement candle
Wait for price to retest 1.13700–1.13820 area (M15 OB/FVG)
If lower high confirms, watch for short setups
🎯 Sell Target: Drop into the sentimental level of 1.13420
🔑 Summary:
Direction Trigger Break Level Entry Zone Target
Buy Break & sweep 1.14312 1.14100 – 1.14200 (OTE) 1.14577 → 1.14780
Sell Break 1.13715 1.13700 – 1.13820 retest 1.13420 (sentiment)
📊 Market Model: ICT Liquidity Sweep + Displacement + Entry Model (FVG or OB)
📅 Session: London to NY overlap

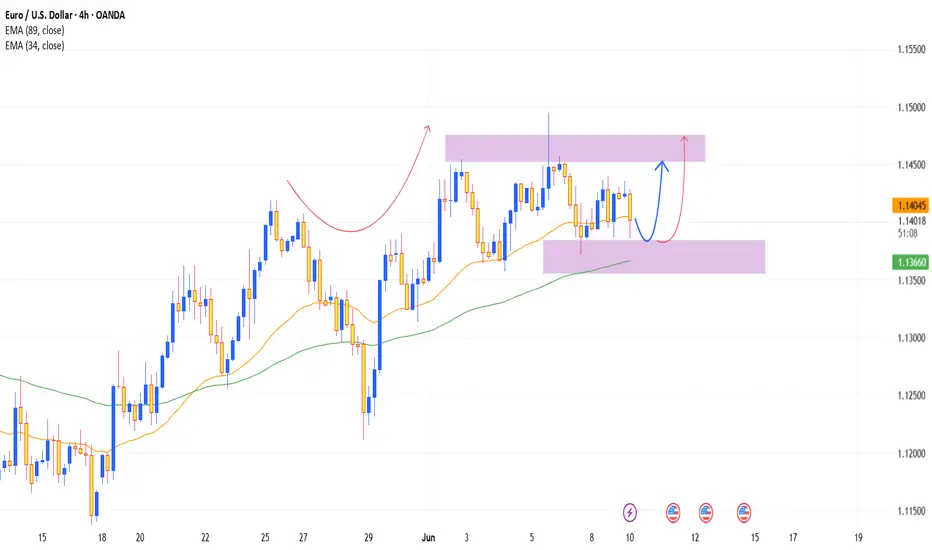
EURUSD – Price Holds Uptrend, 1.145 Zone Is the Key to BreakoutOn the H4 timeframe, EURUSD continues to move within a clearly defined ascending channel, consistently bouncing off the trendline and EMA34–89 cluster. Price is now approaching the 1.14500 resistance zone, which previously rejected bullish attempts twice. However, this time, price is consolidating just below resistance, indicating that buying pressure may be building.
If 1.14500 is breached with strong momentum, the next target will be 1.15000. Conversely, if price gets rejected again, the 1.14100 support zone will be crucial to watch for a reaction.
Meanwhile, news from the ongoing US–China trade talks is keeping gold highly volatile, creating a risk-on sentiment and weakening the USD—this may provide additional support for EUR’s bullish trend.

EURUSD WEEKELY ANALYSISAS we are bullish we can expect price to go more higherr upto the mark i have marked it as a buyside liquidity.....follow for more updates

EURUSD – Pressure at the Top, Correction Likely AheadThe EURUSD pair posted strong gains during the June 11 session, breaking through the 1.1480 resistance zone and reaching the top of the ascending channel near 1.15460. However, price action is showing signs of slowing down as it approaches the upper trendline that previously rejected price on June 3.
Currently, if the price fails to decisively break above the 1.15460 area, a technical correction toward the support zone at 1.14180—where the EMA 34 and lower channel line intersect—is highly likely. This zone will be key to monitor for potential trend-following buy opportunities if a clear recovery signal emerges.
Latest data shows U.S. CPI is easing, putting pressure on the USD. However, markets are now focused on tonight’s FOMC decision, which will play a crucial role in determining the next direction for the dollar.

EURUSD LIQUIDITY AREAS 1HI have mark today's liquidity areas where we can expect market can go.... Follow for today's market review

EURUSD 15 MIN ANALYSISif eurusd makes choch then we can expect it can go upto sellside liquidity area.....

FXHUNTER / EURUSDHello, I'm FXHUNTER. In this post, we will examine the EURUSD symbol. Given that this symbol is forming higher ceilings and floors, the floors are important to us. The indicated block order has the possibility of price support. To enter this position, wait until the price reaches the demand area and enter the trade with the formation of choch or other confirmations.

EURUSD – Steady accumulation, ready for a fresh breakout?After a slight correction, EURUSD is trying to stabilize around the support zone of 1.13840 – which coincides with the EMA89 and a historically strong price reaction area. Although there hasn’t been a clear breakout yet, recent price action still shows an effort to maintain the bullish structure as the higher lows remain intact.
If buyers can take advantage of this support and build momentum, the next target could very well be the 1.14780 zone – an area that has rejected price multiple times and now serves as a key resistance level for the bulls.
Beyond the technical picture, the market is also awaiting this week's CPI, PPI, and NFP data. If these numbers come in weaker than expected, the likelihood of the Fed cutting rates sooner will rise – a positive signal for EURUSD. Moreover, with ongoing geopolitical risks, defensive capital flows may continue to exit the USD, giving the euro an edge in the coming sessions.
EURUSDPrice action trading is a methodology in financial markets where traders make decisions based on the actual price movements of an asset over time, rather than relying heavily on technical indicators or fundamental analysis. It involves observing and interpreting patterns and trends in price charts to predict future price movements.

Eurusd 15 min analysisAs we have taken buyside liquidity ... Now we can go for sellside which I have marked as target

EURUSD 15 min analysisas we have taken internal side liquidity wwe are going for external one i have maked it......for more updates keep following

NY Silver Bullet 📝 Trade Summary – EUR/USD NY Killzone Setup
Strategy: ICT Silver Bullet
Session: New York Killzone (21:00–00:00 IST)
Pair: EUR/USD
Risk: 0.30%
RR: 1:3
📌 Reason for Entry:
Sell-side liquidity engineered above equal highs
Displacement candle confirmed market structure shift
FVG formed inside killzone, aligning with 5-min OB
Entry taken on FVG + mitigation, stop above high
🎯 Bias: Bearish intraday
🧠 Model: Judas + Silver Bullet + Reversal

EURUSD 15 MIN ANALYSISeurues 15 min analysis ....we are going for the buyside liquidity....we can target the buyside liquidty that i have marked ....for more updates follow me

Eurusd 15 min AnalysisAs we have taken buyside liquidity.... We can now go for short in eurusd.... It can reach the target.....

EURUSD NEXT POSSIBLE MOVE🔵 EUR/USD | 10 June 2025 | ICT Intraday Outlook
Market Open: 1.13893
Previous Day High: 1.14577
Previous Day Low: 1.13715
Key Structure Level (PDH BOS Point): 1.14312
Sentimental Range for Sell Target: 1.13420
---
🧠 Market Context:
The market opened today below the previous day’s midrange, suggesting a neutral to bearish tone in early sessions.
We are currently within a consolidation between PDH and PDL, and watching for a liquidity sweep + BOS setup in either direction.
📌 Buy Scenario (Bullish Bias):
If price breaks above 1.14312 (previous structure) and sweeps buy-side liquidity, then:
Expect a retracement back into the FVG or OTE zone between 1.14100–1.14200
Confirmation of displacement + bullish order block around this zone could signal a long opportunity.
🎯 Buy Target : Retest of PDH 1.14577, extended target toward 1.14780 and above.
📌 Sell Scenario (Bearish Bias):
If price breaks below 1.13715 (PDL), expect:
Sell-side liquidity sweep, leading to a displacement candle
Wait for price to retest 1.13700–1.13820 area (M15 OB/FVG)
If lower high confirms, watch for short setups
🎯 Sell Target: Drop into the sentimental level of 1.13420
🔑 Summary:
Direction Trigger Break Level Entry Zone Target
Buy Break & sweep 1.14312 1.14100 – 1.14200 (OTE) 1.14577 → 1.14780
Sell Break 1.13715 1.13700 – 1.13820 retest 1.13420 (sentiment)
📊 Market Model: ICT Liquidity Sweep + Displacement + Entry Model (FVG or OB)
📅 Session: London to NY overlap

Eurusd 15 min monday analysis tomorrow's buyside and selliside liquidity...which you can take as an reference for your trading setups.....for more updates keep following me

EU in selling zoneMonthly and Daily liquidities are taken. Received MS in a daily time frame also. We can take confirmation from lower time frame and go for short.

EURUSDHello, I am BIDISHA. In this post, we will analyze the EURUSD symbol. As you can see, that bullish channel structure from 12 May. In this situation, the prior support level is 1.13597 I have identified as the last a upward move from this level. You can enter here with strict stop loss 1.13597. The target is set on the higher time frame.

EUR USD 15 ANALYSIS AND TARGETAS market have taken all buyside liquiduty it is goignt for sell side....i have marked the todays target .....for more updates follow me
