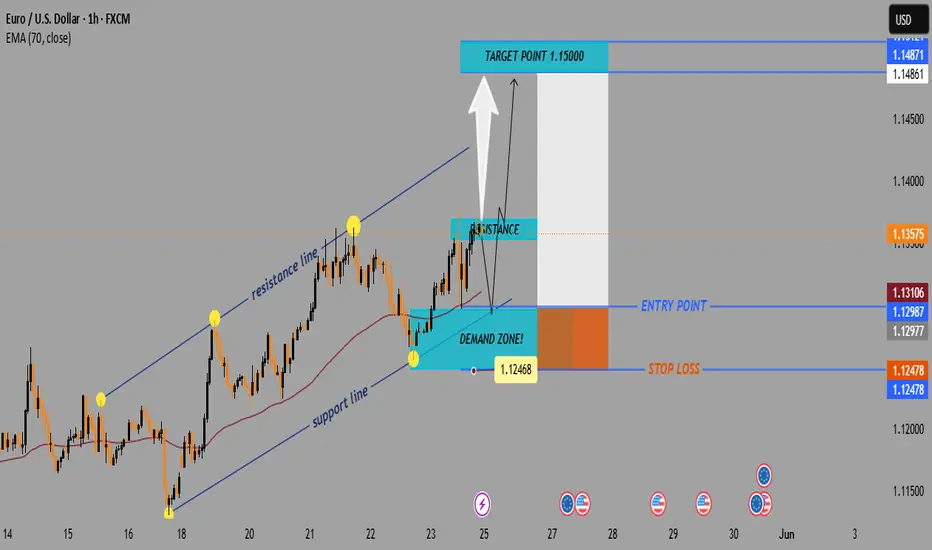
EUR/USD Bullish Trade Setup – Demand Zone to 1.15000 TargetTrend Overview:
↗️ Uptrend Channel
Support Line (Bottom of channel): Holding the upward price movement.
Resistance Line (Top of channel): Price touches and retraces — a key watch level.
Key Zones:
🟦 Demand Zone (BUY Area)
🟢 1.12468 – 1.12987
Strong support.
Price may bounce from here if retested.
Buyers likely to activate here.
🟥 Resistance Zone
🔴 Around 1.13575
Price faces selling pressure.
If broken, could signal a bullish continuation.
Entry & Exit Strategy:
🎯 Target Point: 1.15000 (Marked in blue above)
🚀 Bullish Target
Above the resistance, indicating breakout potential.
📍 Entry Point: 1.12987 – 1.13106
Slightly above the demand zone.
🛑 Stop Loss: 1.12478
Just below the demand zone for risk control.
EMA (70) Line:
📈 Currently at 1.13106
Price is trading above the EMA = bullish signal.
Scenario Summary:
Bullish Setup
✅ Wait for a pullback into the demand zone
✅ Enter near the blue entry area
✅ Target the 1.15000 zone
✅ Risk managed by stop-loss just below demand zone
Trade ideas
EUR USD Weekly analysis (25-05-25 to 31-05-25)Key EUR/USD Levels (4H Chart)
Rejection Zone (Resistance): 1.1400 – 1.1450
Major Supply Zone: 1.1470 – 1.1500
Support Zone: 1.1250 – 1.1204
Target Demand Zone: 1.0980 – 1.0950
🌍 Fundamental Backdrop (as of May 25, 2025)
USD Strength
The Fed remains hawkish, with inflation still sticky above 2%.
Markets are pricing in delayed rate cuts, supporting the USD.
Eurozone Weakness
Slower growth across major Eurozone economies (especially Germany).
ECB is more dovish — already signaling possible rate cuts by Q3.
Bond Yield Divergence
US yields are staying elevated vs. falling EU bond yields — this widens the interest rate differential in favor of USD.
Risk Sentiment
Global markets are shifting toward risk-off due to geopolitical tensions and US-China tech war news — again favoring safe-haven USD.

EURUSD MULTI TIME FRAME ANALYSISHello traders , here is the full multi time frame analysis for this pair, let me know in the comment section below if you have any questions , the entry will be taken only if all rules of the strategies will be satisfied. wait for more price action to develop before taking any position. I suggest you keep this pair on your watchlist and see if the rules of your strategy are satisfied.
🧠💡 Share your unique analysis, thoughts, and ideas in the comments section below. I'm excited to hear your perspective on this pair .
💭🔍 Don't hesitate to comment if you have any questions or queries regarding this analysis.

EUR/USD Forming Double Top –Bearish Reversal Toward Key Support?📉 EUR/USD Technical Outlook – Bearish Bias Developing 🔍
🟪 Key Resistance Zone:
📍 1.1350 – 1.1450
Price has tested this resistance zone multiple times, forming a double-top pattern (🔄) within the highlighted circle. This signals buying exhaustion and potential reversal pressure. The recent failure to break above confirms the zone’s strength.
🔴 EMA Confluence:
🧭 50 EMA (red): ~1.1242
🧭 200 EMA (blue): ~1.0961
The price is currently hovering just above the 50 EMA but well above the 200 EMA, which is acting as a dynamic support. The crossover has already occurred, so if price breaks below the 50 EMA decisively, momentum could shift bearish.
🔻 Support Breakdown Risk:
A breakdown from the 1.1200 neckline area (highlighted in red oval) would confirm the double-top pattern 🎯. That opens downside potential toward the strong demand zone below.
🟪 Strong Support Zone:
📍 1.0700 – 1.0800
This area aligns with prior consolidation (March lows) and the 200 EMA, making it a high-probability reversal zone 📈 if the bearish scenario plays out.
📌 Trade Setup Insight:
✅ Bearish confirmation below 1.1200 neckline 📉
🎯 Target: 1.0800 zone
❌ Invalidation: Break above 1.1350 resistance
🔵 Summary:
The chart is hinting at a classic double-top reversal below a key resistance zone. If price breaks the neckline, sellers are likely to gain control, targeting the strong support near the 200 EMA.
📊 Bias: Bearish 👇
📅 Timeframe: Daily
🛑 Risk Management: Watch for fake-outs near neckline; volume confirmation preferred.

Eurusd remains bullish in the 2hr time frameMy analysis has triggered my position exactly at the price .
Started making a reversal in smaller timeframe
You know, it's always the big frame which comes to play
#eurusd #xauusd #btc #forex #equity

What is Moving Average Convergence Divergence (MACD) ?The Moving Average Convergence Divergence (MACD) is a momentum indicator used in technical analysis to identify changes in the strength, direction, momentum, and duration of a trend in a stock or other asset's price. It's essentially a bar chart that visually displays the relationship between two moving averages of a price series.

eurusd next movei assume today eurusd my trendline chart is go upside diercrion.its swing trading anaysis,all the best

EURUSD Chart Analysis : An Elliott Wave Approach Hello friends, welcome to RK Charts!
Today, we'll analyse the EURUSD chart using Elliot Waves. This study is based on Elliot Wave theory and structure, which enables multiple possibilities. Please note that the possibilities outlined here are not definitive predictions, but rather potential scenarios.
The provided information is for educational purposes only and should not be considered trading advice. There is a risk of being completely wrong, and users are warned not to trade or invest solely based on this study.
We are not responsible for any profits or losses incurred. Individuals should consult a financial advisor before making any trading or investment decisions.
Now, let's dive into the analysis. According to Elliot Wave principles, we're currently in a corrective pattern, which consists of ((A)), ((B)) and ((C)) patterns. We've completed ((A)) and ((B)) and are now unfolding ((C)).
Within ((C)) we expect five sub-divisions, labeled as intermediate waves (blue bracketed): blue (1), (2), (3), (4) & (5). Almost four of these sub-divisions are completed, and we've just begun the (5).
We've set an invalidation point at 1.1065, which is the recent low. If this low is not breached, we'll likely continue unfolding the (5) wave of ((C)), which should break above the high of wave (3).
However, if the low is breached, it's possible that wave (4) is undergoing a double correction.
Both scenarios are possible, and we'll continue to monitor the market's unfold.
Scenario 1
Scenario 2
This study is a deep dive into Elliot Wave counts, aligned with the rules and principles of Elliot Wave theory, as well as higher time frame and higher degree analysis.
I hope this analysis based on Elliot Wave theory has helped you understand the chart better and learn something new. Please keep in mind that this is for educational purposes only.
I am not Sebi registered analyst.
My studies are for educational purpose only.
Please Consult your financial advisor before trading or investing.
I am not responsible for any kinds of your profits and your losses.
Most investors treat trading as a hobby because they have a full-time job doing something else.
However, If you treat trading like a business, it will pay you like a business.
If you treat like a hobby, hobbies don't pay, they cost you...!
Hope this post is helpful to community
Thanks
RK💕
Disclaimer and Risk Warning.
The analysis and discussion provided on in.tradingview.com/u/RK_Charts/ is intended for educational purposes only and should not be relied upon for trading decisions. RK_Charts is not an investment adviser and the information provided here should not be taken as professional investment advice. Before buying or selling any investments, securities, or precious metals, it is recommended that you conduct your own due diligence. RK_Charts does not share in your profits and will not take responsibility for any losses you may incur. So Please Consult your financial advisor before trading or investing.

ICTHello, I'm FXHUNTER. Analysis of the EURUSD symbol. We have a downtrend in this symbol. According to ICT, the last bullish candlestick, after which a strong decline was formed and was able to break the previous low, is a powerful block order and can be a strong supply range.

EURUSD MULTI TIME FRAME ANALYSISHello traders , here is the full multi time frame analysis for this pair, let me know in the comment section below if you have any questions , the entry will be taken only if all rules of the strategies will be satisfied. wait for more price action to develop before taking any position. I suggest you keep this pair on your watchlist and see if the rules of your strategy are satisfied.
🧠💡 Share your unique analysis, thoughts, and ideas in the comments section below. I'm excited to hear your perspective on this pair .
💭🔍 Don't hesitate to comment if you have any questions or queries regarding this analysis.

EUR USD Weekly analysis (18-05-25 to 24-05-25)📊 Technical Analysis (4H Chart – EUR/USD)
Current Price: ~1.1163
EUR/USD attempted a short-term bounce post-retail sales data but failed to break structure. The chart suggests potential downside continuation after a minor retracement.
🔍 Key Technical Observations:
Resistance Zone:
• 1.1340 – 1.1370 (highlighted zone, likely invalid unless major reversal happens)
Support Zones:
• 1.1100 (intermediate)
• 1.1050 – 1.1020 (strong demand zone from early May)
A clean lower high setup is forming. If the pair fails to break above 1.1200, expect downward continuation.
🔴 Bias:
Bearish unless the price breaks above 1.1200 with strong momentum. Expect continuation toward 1.1100 and possibly 1.1050.
🌍 Fundamental Outlook for the Week (13–17 May 2025)
🏦 1. Divergence in ECB vs. Fed Policy
ECB is more dovish, signaling readiness to cut rates by June.
Fed remains on hold due to sticky inflation and strong labor data.
This divergence supports USD strength and EUR weakness.
💼 2. Key EU & US Events This Week
Germany ZEW Survey (Tue): If weaker, it could reinforce bearish pressure.
Eurozone CPI (Thu): Could increase volatility—lower print may trigger deeper selling.
US Retail Sales (Fri): If strong (as the chart timing suggests), it justifies the bearish continuation.
🌐 3. Risk Sentiment
Stable for now, but any deterioration in global sentiment could further weigh on EUR/USD due to its risk-sensitive nature.
✅ Conclusion
EUR/USD outlook remains bearish on both technical and fundamental fronts.
Expect price to struggle below 1.1200, and move lower toward 1.1100, possibly 1.1050, if momentum follows through.

EURUSD - May 3rd WeekOnly sell.
There is no plan to buy
every timeframe is downtrend after rejected by strong resistance

ictHello, I'm Forex Hunter. Our analysis of the EURUSD symbol in this chart is the last bullish candle, after which a strong downward movement has formed.

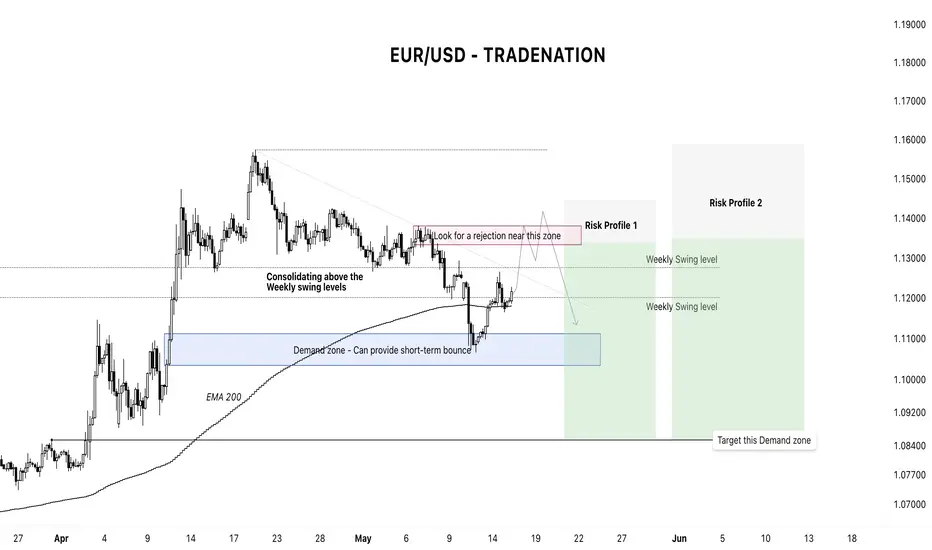
EUR/USD Outlook – Potential Short SetupsHi everyone,
In today’s post, let’s break down the current market structure and potential opportunities in the EUR/USD pair.
🔍 Market Context
After nearly a month of consolidation, EUR/USD appears to have stalled around the previous weekly swing highs . Despite several attempts to hold above this level, the price eventually broke down, signalling a shift in structure on the 4-hour (4H) timeframe.
This short-term breakdown could be an early sign of a l arger structural shift on the daily chart , and it’s something I’m keeping a close eye on.
🧭 Key Levels & Price Behaviour
At the moment, price action is bouncing from a demand zone , which might provide a short-lived relief rally . However, this bounce may only be temporary.
In my humble opinion, bullish momentum is fading , and we could be entering a trap zone for late buyers . I’m watching the 1.132–1.138 region , just above the short-term downtrend line, as a potential resistance zone and an ideal area to consider shorts.
🎯 Trade Ideas
I’ve marked two trade setups on the chart, catering to different risk profiles:
1. Aggressive Trade – For traders willing to enter closer to resistance with tighter stop losses.
2. Conservative Trade – For those who prefer more confirmation before entry.
You can treat these setups independently or combine them into a single strategy depending on your trading style and risk tolerance.
⚠️ Disclaimer
This post is purely for educational purposes . I am not a financial advisor , and nothing here should be taken as financial advice. Always consult your financial advisor before making any investment or trading decisions.
RSI Divergence part 2RSI Divergence is among technical analyses allowing traders to discover a possible market reversal by comparing price movements with the Relative Strength Index. The RSI tool measures how fast and strong price movements are, ranging between 0 and 100. Typically, when the RSI is below 30, the asset is considered oversold; when it's above 70, it's seen as overbought.

RSI Divergence part 2The relative strength index (RSI) is calculated using the following formula: RSI = 100 – 100 / (1 + RS) Where RS = Average gain of up periods during the specified time frame / Average loss of down periods during the specified time frame asset price is considered overbought (due for a correction) when RSI is above 70, and oversold (due for a rebound) when it is below 30. Some traders use more extreme levels (80/20) to reduce false readings.
In a strong uptrend, RSI will often reach 70 and beyond for sustained periods, and downtrends can stay at 30 or below for a long time. While general overbought and oversold levels can be accurate, they may not provide the most timely signals for trend traders.

ictHello, the analysis of the EURUSD symbol shows that the price has formed a supply block order in a downward trend that could pull the price down.

RSI Divergence RSI: Divergence appears when the RSI's highs or lows diverge from price. For example, if the price makes new lows but the RSI bottoms at higher levels, it signals bullish divergence; if the price makes new highs but the RSI peaks at lower levels, it signals bearish divergence.

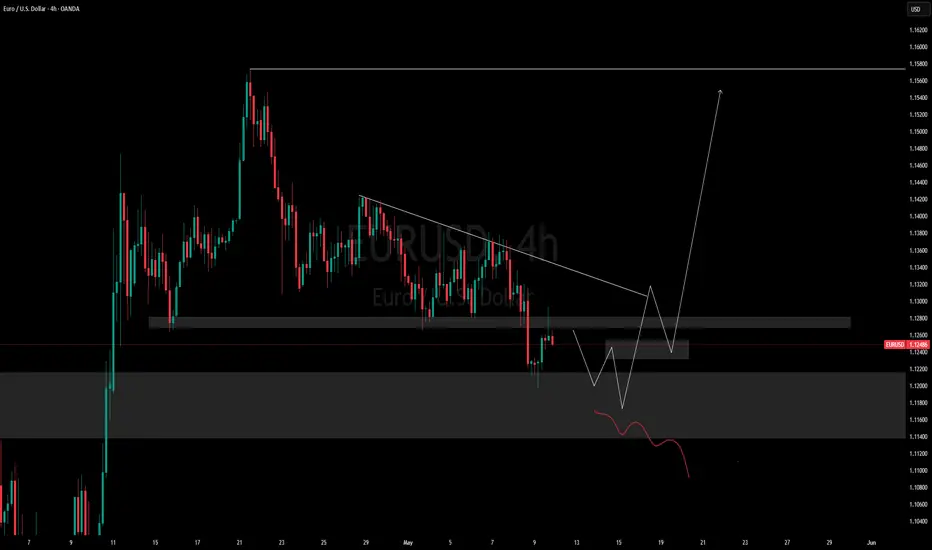
EURUSD buy to sell setup?EURUSD has already played out as anticipated in Sunday’s analysis. Price reached the target for shorts and is now retracing from the first point of interest — a larger demand zone.
The 4H structure remains bearish, so in line with the trend, I expect price to drop further into the lower interest area around 1.1000. That’s where buyers could start stepping in, adding liquidity to the market.
I’ll be watching for a buy-to-sell setup to position myself accordingly.
Interesting setup overall — let’s see how it plays out.

EUR/USD Bearish Setup: Supply Zone Rejection Toward1.0900 Target(Swing Trade Setup)
📉 Trendline + CHoCH Confirmation
🔻 Downtrend marked by a falling blue trendline.
🔄 CHoCH (Change of Character) shows a bearish market structure shift, confirmed by a lower low.
🟦 Supply Zone (Sell Zone)
💥 Strong seller reaction previously occurred between:
1.12956 – 1.13896
🔹 Wait for price to retrace into this zone.
🎯 Ideal for short entries.
🎯 Entry & Stop-Loss
🔵 Entry Point: Around 1.12956 – 1.13005
(below supply zone and EMA)
🛑 Stop Loss: 1.13896 – 1.13929
(above the last high + supply zone)
🟦 EMA 70 (Purple Line)
📈 Currently at 1.13051
Acts as dynamic resistance — strengthening the short setup.
🏁 Target Zone
🎯 Main Target: 1.09000
Marked as TARGET POINT 1.0900
🟦 Support Levels Inside Target Zone:
1.09229
1.09150
1.08814
✅ Summary of Trade Idea
📍 Short Position
⬆️ Entry: ~1.13000
🛑 Stop Loss: ~1.13900
⬇️ Take Profit: ~1.09000
⚖️ Risk-to-Reward: ~1:3+ potential

EUR/USD Buy Setup1. Entry Point:
Marked at: 1.12243
This is the suggested price level to enter a long (buy) trade.
2. Stop Loss:
Set at: 1.11542
Placed below a support zone, it limits the downside risk if the trade moves against the position.
3. Target Points:
EA Target Point One: 1.13891
EA Target Point (Final): 1.15929
These levels are profit-taking zones, with the first being a conservative target and the second being a more extended move.
4. Technical Indicators:
Moving Averages:
A red shorter-term moving average (possibly 20 EMA)
A blue longer-term moving average (possibly 200 EMA)
Price is currently below both, indicating bearish momentum, though the long setup is anticipating a reversal.
5. Support/Resistance Zones:
Purple Zones: Highlighted as key demand and supply areas.
The lower purple zone supports the entry and stop-loss area.
The upper purple zones mark resistance areas aligning with the target levels.
6. Current Price:
Around 1.12459, slightly above the entry zone.
Conclusion:
This setup is a bullish trade idea with a clearly defined:
Entry (1.12243),
Stop-loss (1.11542), and
Two take-profit levels (1.13891 and 1.15929).

EURUSD MULTI TIME FRAME ANALYSISHello traders , here is the full multi time frame analysis for this pair, let me know in the comment section below if you have any questions , the entry will be taken only if all rules of the strategies will be satisfied. wait for more price action to develop before taking any position. I suggest you keep this pair on your watchlist and see if the rules of your strategy are satisfied.
🧠💡 Share your unique analysis, thoughts, and ideas in the comments section below. I'm excited to hear your perspective on this pair .
💭🔍 Don't hesitate to comment if you have any questions or queries regarding this analysis.
EURUSD BEARISHFinally after a big time consolidation USD becomes bullish. And now we can see dollar pairs to get strength . are you guys with this EU bearish trade idea
