EURUSD MULTI TIMEFRAME ANALYSIS Hello traders , here is the full multi time frame analysis for this pair, let me know in the comment section below if you have any questions , the entry will be taken only if all rules of the strategies will be satisfied. wait for more price action to develop before taking any position. I suggest you keep this pair on your watchlist and see if the rules of your strategy are satisfied.
Trade ideas


EURUSD Trade Idea Shorts Tuesday/Wednesday WASUPPP LADSSS!
Yeah EU/GU are in a bhllish orderflow, I'm expecting them to continue higher but not before retracing back into the daily bullish Fair Value gap. So GU has printed a H4 Bearish FVG and there's smt between EU and GU on the Daily Time Frame. I'm expecting a second smt to push price lower into the daily fair value gap before continuing upwards, so short term i would be looking for sells.
So this is the plan, in London -
If price creates an smt divergence with DXY/GBP/USDCHF I would look for shorts to the daily bullish fair value gap, this is basically an ERL to IRL play.
This is just an idea, it has necessary conditions which need to be met to be acted upon, like smt and a bearish orderflow on the 15m timeframe. If these two conditions are met I would look for shorts, unless price decides to continue going higher. Thank you and keep winning!!!

Private vs Public Banks in the Indian Market1. Ownership and Management Structure
The fundamental difference between public and private banks lies in ownership.
Public Sector Banks (PSBs) are majority-owned by the Government of India, which holds more than 50% of their equity. The government plays a key role in appointing top executives and formulating policy directions. Examples include State Bank of India (SBI), Punjab National Bank (PNB), Bank of Baroda (BoB), and Canara Bank.
Private Sector Banks (PVBs), on the other hand, are owned and managed by private entities or individuals, with the government having little or no control. The management is typically professional, and boards are accountable to private shareholders. Major private banks include HDFC Bank, ICICI Bank, Axis Bank, Kotak Mahindra Bank, and IndusInd Bank.
This difference in ownership affects how both types of banks operate, their decision-making processes, and their responsiveness to market conditions.
2. Historical Background
Public sector banks form the backbone of India’s traditional banking system. They gained prominence after bank nationalization in 1969 and 1980, which brought 20 major banks under government control. The aim was to ensure that banking services reached rural and underbanked areas, supporting agriculture, small industries, and social development.
Private banks, however, emerged in two waves:
The first phase included old private banks such as Karur Vysya Bank, South Indian Bank, and Federal Bank, which were regional and limited in scale.
The second phase, or the “new generation” private banks, began after the economic liberalization of 1991, when the Reserve Bank of India (RBI) allowed new private players to enter. Banks like HDFC Bank, ICICI Bank, and Axis Bank brought innovation, technology, and competition to the market.
3. Operational Efficiency and Technology
Private sector banks are widely recognized for their efficiency and technological advancement. They were pioneers in introducing digital banking, internet and mobile apps, ATMs, 24/7 customer service, and AI-based financial solutions. Their focus on automation and quick service appeals especially to urban customers.
Public banks, though initially slower to adopt technology, have made significant progress in recent years. Initiatives like YONO by SBI, Bank of Baroda’s digital transformation, and PSB Alliance have modernized public banking. However, public banks still face challenges due to their vast legacy systems and bureaucratic procedures.
4. Customer Service and Experience
Private banks are often perceived as offering superior customer service, with faster processing times, personalized products, and proactive relationship management. Their staff is trained to focus on efficiency and customer satisfaction.
Public banks, however, have traditionally been known for longer processing times and formal procedures. Yet, they provide an essential service to a larger section of society, especially in rural and semi-urban areas where private banks may not have strong penetration. PSBs are more committed to social welfare schemes such as Jan Dhan Yojana, Mudra loans, and agricultural credit programs.
5. Market Reach and Financial Inclusion
In terms of reach, public sector banks hold a dominant position. They have thousands of branches across rural India, ensuring that even remote populations have access to banking facilities. For instance, SBI alone accounts for more than 20% of India’s total banking network.
Private banks, conversely, focus primarily on urban and metropolitan regions where customers demand faster, technology-driven services. However, they are now expanding into Tier 2 and Tier 3 cities to capture a growing middle-class market.
6. Profitability and Performance
Private banks usually exhibit higher profitability, better asset quality, and more stable returns. Their operational flexibility, low non-performing asset (NPA) ratios, and efficiency in cost management contribute to superior financial performance. For instance, banks like HDFC and ICICI consistently report high return on assets (ROA) and return on equity (ROE).
Public banks, due to their social obligations and exposure to priority sectors, often face higher NPAs and lower profitability. Lending to agriculture, infrastructure, and small enterprises—though socially vital—sometimes leads to defaults. However, government support through recapitalization and mergers (like SBI with its associate banks) helps maintain their financial stability.
7. Lending Patterns and Risk Management
Public banks prioritize social and developmental objectives, lending to priority sectors such as agriculture, small industries, and low-income groups. They are also instrumental in implementing government schemes like PMEGP, Stand-Up India, and PM Kisan.
Private banks focus more on profitable segments such as retail loans, home loans, credit cards, and wealth management. They employ advanced risk assessment tools, AI-driven credit scoring, and market-based pricing, which help reduce bad loans and maintain better credit discipline.
8. Employment and Work Culture
Public sector banks provide job security, stable career paths, and government-linked benefits. They attract candidates through national-level exams conducted by IBPS or SBI. However, the work culture can be bureaucratic, hierarchical, and slower in decision-making.
Private banks offer performance-based incentives, faster promotions, and modern work environments, but job security is lower. They emphasize productivity, targets, and results, often leading to higher stress levels but better pay for top performers.
9. Regulatory Environment
Both public and private banks are regulated by the Reserve Bank of India (RBI) and governed by the Banking Regulation Act, 1949. However, PSBs are also accountable to the Ministry of Finance and the Parliament of India, which increases oversight but sometimes limits autonomy. Private banks enjoy greater independence in policy decisions but must adhere strictly to RBI norms.
10. Public Trust and Perception
Public banks enjoy a high level of trust among citizens, especially older generations and rural populations, because of government backing. Depositors believe their money is safe, even if the bank faces trouble, as the government is expected to intervene.
Private banks are viewed as modern, efficient, and customer-friendly, but public confidence fluctuates based on market performance. However, strong brands like HDFC Bank and ICICI Bank have built reputations rivaling public banks in reliability.
11. Future Trends and Outlook
The future of India’s banking sector lies in coexistence and collaboration between public and private players.
Public banks are likely to focus on financial inclusion, rural expansion, and implementation of government initiatives.
Private banks will continue to drive technological innovation, digital lending, and customer-centric growth.
Additionally, the rise of fintech companies, digital payments platforms (like Paytm and PhonePe), and neo-banks is pushing both sectors toward modernization and customer-focused strategies.
Government-led reforms such as bank mergers, recapitalization packages, and privatization plans indicate an evolving structure aimed at improving competitiveness and efficiency. As India’s economy grows, both public and private banks will play complementary roles in supporting national development and financial stability.
Conclusion
In summary, public sector banks represent the traditional, inclusive, and socially driven side of Indian banking, while private sector banks symbolize innovation, efficiency, and profit-oriented growth. Each has its strengths: public banks bring trust, accessibility, and social responsibility, while private banks bring technology, speed, and superior service quality.
The Indian market thrives on this balance — where government-backed institutions ensure inclusive development and private banks drive modernization and competition. Together, they form a robust dual system that continues to evolve, reflecting the dynamic needs of a rapidly developing economy.

Trade Journal 4th trade -:10/11/25 - GBP SellWassup Lads!
So this was a trade I took which I exited at B.E., it was a risky sell - basically a counter trade in a bullish orderflow. I took it but exited it on a small profit because I was not feeling confident.
Anyway talking about the trade, this was totally a time based setup -
The reason for the trade -
1. SMT Divergence between EU and GU on the daily time frame
2. Second Stage SMT between EU and GU (London highs)
Two stage SMT confirmed the reversal but I didn't have much confidence considering the overall bullish orderflow.
Keep winning bois!

EURUSD LONG my entry @ 1.15570
Stop: 1.15416 (days low)
Target: 1.16042 ( pdh and a little higher)
I’m aware price may dip deeper and potentially take out today’s low before pushing higher, but this setup fits my plan. My target is the previous day’s high and slightly above. Executing the trade and letting it play out. Let's see how it unfolds.

EURUSD MULTI TIMEFRAME ANALYSIS Hello traders , here is the full multi time frame analysis for this pair, let me know in the comment section below if you have any questions , the entry will be taken only if all rules of the strategies will be satisfied. wait for more price action to develop before taking any position. I suggest you keep this pair on your watchlist and see if the rules of your strategy are satisfied.

EURUSD Weekly Outlook - 10/11/205 to 14/11/2025Wassup Lads!
So this week we can see that EU closed sharply into the week rejecting the lows, there's a strong rejection candle on the weekly time frame and price has displaced higher forming a daily swing point and a daily fair value gap as well, so what I would be looking for price is to do this -
1. Price range on Monday
2. Manipulte into the daily fair value gap.
3. Look for smt divergence during key times
4. Would look for longs
This is my plan for EU this coming week.
Do your own research, manga risk and stay disciplined bois.
Let's win this week!

Expected eurusd sell upto April 2026Long term expectations for eurusd
Forecasts suggest the EUR/USD pair is likely to remain under selling pressure until April 2026, with projections showing declines toward the 1.06–1.09 range before a potential rebound later in 2026.
TICKMILL:EURUSD
---
EUR/USD Sell Outlook up to April 2026
📌 Introduction
The EUR/USD currency pair, often called the “fiber,” is the most traded forex pair globally. Its movements reflect the balance of power between the Eurozone economy and the United States economy. Traders, investors, and policymakers closely monitor this pair because it influences global capital flows, trade balances, and risk sentiment.
As we look ahead to April 2026, multiple forecasts from financial analysts and institutions indicate a bearish trend for EUR/USD. This article provides a comprehensive 1500-word analysis of why the euro is expected to weaken against the dollar, the fundamental and technical drivers behind this outlook, and what traders should anticipate in the months leading up to April 2026.
---
📉 Forecast Data: EUR/USD Until April 2026
According to long-term projections:
- December 2025: EUR/USD expected around 1.1207, down nearly 3% from earlier levels.
- January 2026: Forecast at 1.0866, marking a 5.9% decline.
- February 2026: Projected at 1.0673, continuing the bearish momentum.
- March 2026: Expected to fall further to 1.0569, the lowest in this cycle.
- April 2026: Slight recovery to 1.0698, but still well below 2025 highs.
This data suggests a clear sell bias until at least April 2026, with EUR/USD struggling to hold above the 1.07 level.
---
⚖️ Fundamental Drivers of EUR/USD Weakness
1. Divergence in Monetary Policy
- Federal Reserve (Fed): The Fed is expected to maintain a relatively hawkish stance, keeping interest rates higher for longer to combat inflation. Higher U.S. yields attract global capital, strengthening the dollar.
- European Central Bank (ECB): The ECB faces slower growth and weaker inflationary pressures compared to the U.S. This limits its ability to raise rates aggressively, leaving the euro vulnerable.
2. Economic Growth Gap
- U.S. Economy: Resilient consumer spending, strong labor markets, and technological investment continue to support growth.
- Eurozone: Struggles with energy costs, sluggish industrial output, and geopolitical risks (e.g., Ukraine conflict) weigh on growth.
3. Energy Dependence
The Eurozone remains heavily dependent on imported energy, particularly natural gas. Any supply disruptions or price spikes disproportionately hurt the euro compared to the dollar.
4. Safe-Haven Flows
In times of global uncertainty, investors flock to the U.S. dollar as a safe-haven asset. This dynamic further pressures EUR/USD lower.
---
📊 Technical Analysis Outlook
Long-Term Trend
- Resistance Levels: 1.12 (December 2025), 1.10 (January 2026).
- Support Levels: 1.06 (February–March 2026).
- Trend Bias: Downward channel until April 2026.
Indicators
- Moving Averages: 200-day MA trending downward, confirming bearish sentiment.
- RSI (Relative Strength Index): Hovering near oversold territory, suggesting persistent selling pressure but potential for short-term corrections.
- Fibonacci Retracements: Key retracement levels point to 1.056–1.07 as critical support zones.
---
🌍 Geopolitical and Macro Risks
- U.S. Elections (2024 aftermath): Policy uncertainty may briefly weaken the dollar, but long-term fundamentals favor USD strength.
- Eurozone Debt Concerns: Rising debt levels in Italy and Spain could undermine investor confidence in the euro.
- Global Trade Tensions: Any escalation in trade disputes tends to benefit the dollar as a safe haven.
---
📈 Trading Strategies for EUR/USD Sell Bias
1. Short Positions:
- Enter near resistance levels (1.11–1.12).
- Target support zones (1.06–1.07).
2. Risk Management:
- Use tight stop-losses above 1.13.
- Diversify with other USD pairs (USD/JPY, USD/CHF).
3. Hedging:
- Consider long positions in commodities (gold, oil) to offset euro weakness.
4. Scalping Opportunities:
- Intraday volatility around ECB/Fed announcements offers short-term sell trades.
---
📌 Outlook Beyond April 2026
While EUR/USD is expected to remain weak until April 2026, forecasts suggest a gradual recovery starting mid-2026:
- May–July 2026: EUR/USD projected to rebound toward 1.16–1.17.
- August–October 2026: Further recovery to 1.19–1.21, signaling a shift in sentiment.
This indicates that the sell bias is temporary, and traders should prepare for a potential trend reversal after April 2026.
---
📝 Conclusion
The EUR/USD pair is forecasted to remain under selling pressure until April 2026, with levels dropping toward 1.06–1.09. The bearish outlook is driven by monetary policy divergence, economic growth disparities, energy vulnerabilities, and safe-haven flows favoring the dollar.
For traders, this period offers opportunities to capitalize on short positions, but risk management is crucial given pote TICKMILL:EURUSD ntial volatility. Beyond April 2026, a gradual recovery is expected, marking a shift from bearish to bullish sentiment.
---
✅
---

Algorithmic and High-Frequency Trading (HFT) in India1. Understanding Algorithmic Trading
Algorithmic trading refers to the use of computer programs and mathematical models to automate the process of trading financial instruments such as equities, derivatives, currencies, and commodities. Instead of manual execution by human traders, algorithms follow predefined instructions based on time, price, quantity, and other market parameters.
In India, algorithmic trading gained momentum after the Securities and Exchange Board of India (SEBI) permitted it in 2008 for institutional investors. Since then, it has grown exponentially with the adoption of advanced technologies such as Artificial Intelligence (AI), Machine Learning (ML), and Big Data analytics.
Algorithmic trading strategies are typically designed to:
Reduce transaction costs
Minimize human emotions in trading
Execute large orders without disrupting market prices
Capitalize on small, short-lived price inefficiencies
Common strategies include trend-following, statistical arbitrage, mean reversion, market making, and pairs trading.
2. High-Frequency Trading (HFT) Explained
High-Frequency Trading (HFT) is a specialized subset of algorithmic trading characterized by extremely high-speed trade execution, large volumes of orders, and very short holding periods. HFT firms rely on:
Ultra-low latency networks
Co-location facilities (where trading servers are placed near exchange servers)
Advanced algorithms capable of executing thousands of trades per second
The goal of HFT is to profit from microsecond-level market inefficiencies—such as differences in bid-ask spreads, arbitrage opportunities between exchanges, or momentary price dislocations.
In India, HFT is primarily used by institutional investors, proprietary trading firms, and hedge funds that have access to advanced infrastructure and regulatory approvals.
3. Evolution of Algo and HFT in India
India’s journey toward algorithmic and HFT trading began in the late 2000s. The National Stock Exchange (NSE) was among the first to offer Direct Market Access (DMA) and co-location services, enabling institutional participants to connect directly to the exchange infrastructure with minimal latency.
2008: SEBI allowed institutional investors to use algorithmic trading.
2010-2012: Exchanges introduced co-location services and low-latency networks.
2013 onwards: Rapid growth in automated order flow; by some estimates, over 40% of equity and derivatives trades were algorithmically driven.
2020s: Integration of AI, ML, and predictive analytics in trading algorithms.
With rising competition among institutional players, Indian exchanges have continuously upgraded their technology to handle high message traffic, ensuring fairness and stability in automated markets.
4. Key Participants in Indian Algo and HFT Ecosystem
Institutional Investors: Mutual funds, pension funds, and insurance companies use algorithmic systems to execute large orders efficiently.
Proprietary Trading Firms: They rely heavily on HFT and statistical arbitrage strategies to exploit microsecond-level opportunities.
Foreign Institutional Investors (FIIs): Many global firms deploy HFT strategies in Indian markets through subsidiaries or partnerships.
Retail Traders: Although limited, retail participation is increasing through brokers offering API-based trading platforms and algorithmic bots.
Exchanges and Brokers: NSE and BSE provide the technological backbone with co-location and data feed services, while brokers offer execution APIs and backtesting tools.
5. Technological Infrastructure Supporting HFT
The success of algorithmic and HFT trading depends on speed, precision, and data quality. Indian exchanges have developed world-class infrastructure that supports high-frequency trading through:
Co-location facilities for ultra-low latency trading
High-speed fiber-optic and microwave communication networks
Real-time market data feeds with millisecond granularity
Application Programming Interfaces (APIs) for automated order routing
Advanced risk management systems to monitor orders and prevent errors
Additionally, the rise of cloud computing and AI-driven analytics allows traders to process vast volumes of tick-level data and develop predictive models for future price movements.
6. Popular Algorithmic Trading Strategies in India
Several algorithmic strategies are widely employed in Indian markets, including:
Arbitrage Strategies: Exploiting price differences between cash and futures, or across exchanges (NSE vs. BSE).
Market Making: Providing liquidity by continuously quoting buy and sell prices.
Momentum and Trend Following: Identifying and riding price trends using moving averages or momentum indicators.
Statistical Arbitrage: Using quantitative models to exploit temporary price inefficiencies between correlated assets.
News-Based Trading: Using natural language processing (NLP) to react instantly to news or corporate announcements.
7. Regulatory Framework by SEBI
Given the complexity and speed of algorithmic and HFT activity, SEBI plays a critical role in ensuring market integrity and fairness. The regulator has introduced several guidelines, including:
Pre-trade risk checks: To prevent erroneous or large orders that could disrupt markets.
Order-to-trade ratio limits: To control excessive order cancellations by HFT firms.
Unique Algo IDs: Each algorithm must be registered and tested before deployment.
Latency equalization measures: SEBI proposed “random speed bumps” to reduce unfair advantages from co-location.
Surveillance systems: Exchanges continuously monitor unusual order patterns or spoofing activities.
These measures ensure that algorithmic and HFT activities enhance liquidity without introducing instability or manipulation.
8. Benefits of Algorithmic and HFT in Indian Markets
Algorithmic and high-frequency trading have brought several benefits to the Indian financial ecosystem:
Increased Market Liquidity: Continuous order flow ensures tighter bid-ask spreads and efficient execution.
Improved Price Discovery: Algorithms react quickly to new information, making prices more reflective of true value.
Reduced Transaction Costs: Automated execution minimizes human errors and slippage.
Enhanced Market Efficiency: Rapid arbitrage eliminates temporary price discrepancies.
Accessibility for Retail Traders: With new APIs and algo platforms, small traders can deploy systematic strategies.
9. Challenges and Criticisms
Despite its advantages, algo and HFT trading come with significant challenges:
Market Fairness: HFT firms with superior technology can gain an unfair advantage over smaller participants.
Flash Crashes: Erroneous algorithms or feedback loops can cause sudden market volatility.
Systemic Risks: High interconnectivity among automated systems may amplify shocks.
Regulatory Complexity: Constant innovation in trading algorithms challenges regulators to keep up.
Infrastructure Costs: Access to co-location and high-speed data remains expensive, creating barriers for smaller firms.
10. Future Outlook of Algo and HFT Trading in India
The future of algorithmic and HFT trading in India is poised for robust growth, driven by advancements in AI, machine learning, and big data analytics.
Key emerging trends include:
AI-driven Predictive Models: Algorithms capable of learning from historical and real-time data to make adaptive trading decisions.
Blockchain Integration: Transparent and secure transaction systems reducing latency and settlement risk.
API Democratization: Greater access for retail traders through open APIs and low-cost algo platforms.
Smart Regulation: SEBI’s proactive stance on monitoring algorithmic activity while encouraging innovation.
Cross-Asset Automation: Expansion of algorithms to currencies, commodities, and fixed-income markets.
With India’s rapidly digitalizing financial ecosystem and growing participation from domestic and global investors, algorithmic and HFT trading will continue to play a pivotal role in shaping the country’s capital markets.
Conclusion
Algorithmic and High-Frequency Trading represent the cutting edge of financial market evolution in India. They have transformed the landscape of stock trading from human-driven judgment to machine-driven precision and speed. While challenges related to fairness, systemic risk, and infrastructure persist, regulatory oversight by SEBI and technological innovation continue to balance growth with stability.
As India’s markets mature, algorithmic and HFT trading will not only enhance liquidity and efficiency but also position the country as a leading global hub for financial technology innovation—marking a new era of smart, data-driven, and automated trading.
EURUSD for next month.-> 7 NovPrice is reacting and seeing some `upward` moment before reaching to our `demand` zone.
Expecting a bull in next few week.

EURUSD Buying Scalp Level 15Min Level Buying
1 Min Good Green Candle Confirmation to Enter
Risk Free at 1:1
Hold for 1:3 Full Booked
EUR/USD Outlook: Buyers Regain ControlThe EUR/USD market is beginning to show early signs of recovery momentum as sentiment gradually turns constructive. After an extended period of controlled weakness, the pair is attracting renewed interest from institutional participants positioning for a potential upward rotation in the coming sessions.
Market tone has shifted from defensive to cautiously optimistic. Liquidity distribution across recent sessions indicates accumulation behavior at lower price zones, often a precursor to a bullish transition. Traders appear to be building exposure in anticipation of improved Euro-area sentiment and potential easing of dollar strength, both of which may provide the foundation for a broader corrective advance.
Price action suggests that selling pressure is losing effectiveness as downside extensions are quickly absorbed. The slowdown in bearish momentum combined with increased buying participation signals a developing phase of re-accumulation, where stronger hands begin to dominate short-term flows.
Confidence is gradually improving, supported by expectations that market equilibrium is tilting back toward Euro favor. While volatility remains moderate, structural patterns imply that the market may be preparing for a sentiment-driven expansion to the upside. The tone of order flow has shifted toward buy-side liquidity, pointing to a constructive environment for continuation of the upward phase once momentum fully confirms.
In summary, EUR/USD appears to be entering the early stage of a bullish rotation characterized by accumulation, strengthening sentiment, and declining downside conviction. The pair is poised for potential medium-term appreciation as market positioning aligns with renewed optimism toward the Euro’s relative outlook.

EUR/USD | Institutional Demand RejectionPrice action shows a clean liquidity sweep below the prior session’s low, tapping into a well-defined 5-min demand zone aligned with the 1H structural pivot. Orderflow shift confirmed as buy-side momentum emerged with displacement and follow-through above short-term structure.
Position initiated post-confirmation close, with risk anchored below the sweep low. Upside targets set near 1.1510–1.1520, aligning with local liquidity cluster and FVG mitigation zone.
Market Context:
• EUR/USD rebounded after liquidity grab under 1.1480 support.
• Short-term orderflow flipped bullish following imbalance recovery.
• Targeting return to equilibrium near 1.1510 zone before reassessment.
Trade Parameters:
• Entry: 1.1489
• Stop Loss: 1.1477
• Take Profit: 1.1513

(EUR/USD, 2-hour timeframe...(EUR/USD, 2-hour timeframe, with Ichimoku Cloud and descending channel):
The price is currently breaking below the lower channel boundary and the Ichimoku Cloud is fully bearish — both strong continuation signals.
The chart shows a projected “Target Point” zone around 1.1415, which seems to be the first target area marked.
If bearish momentum continues below 1.1415, the next extended downside targets can be:
TP1: 1.1415 (already shown on my chart)
TP2: 1.1380 (next support zone from previous swing)
TP3: 1.1350 (major channel base & psychological support)
📉 Summary:
Trend: Bearish
Immediate Target: 1.1415
Next Targets (if breakdown continues): 1.1380 → 1.1350
Stop-loss (for shorts): Above 1.1485–1.1500 (upper channel resistance)

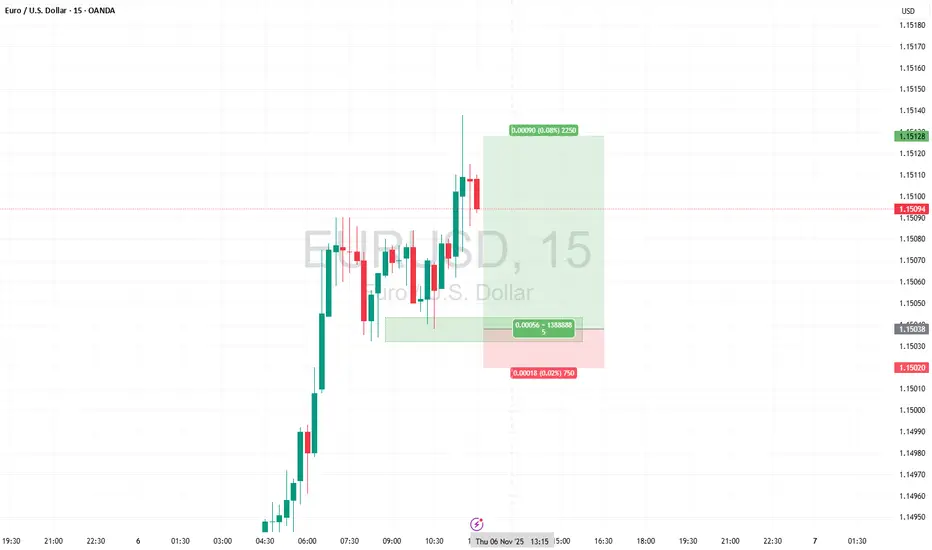
EUR/USD – Long SetupPrice swept liquidity below intraday low and tapped into demand zone. Strong bullish reaction confirms short-term reversal probability.
Entry taken on confirmation candle with tight invalidation and clear liquidity target above 1.1520.
Bias: Bullish (Scalp to Intraday)
Entry: 1.1509
SL: 1.1505
TP: 1.1519
RR: 2.5R
YCGH Capital | Precision over prediction.

Trade Analysis: EUR/USDPair: EUR/USD
Entry: 1.15310
Stop Loss: 1.15547
Take Profit: 1.14801
EUR/USD is showing a short-term bearish structure with lower highs forming under resistance near 1.1550.
I’m watching for a continuation of the downtrend after a corrective pullback.
The entry is planned at 1.15310 with a stop loss above resistance at 1.15547 and a target toward 1.14801 support.
This trade offers a solid 2:1 risk–reward setup, aligning with the prevailing momentum

Trading Secrets in the Indian Market1. Understanding the Indian Market Dynamics
The first secret to successful trading in India is understanding the unique nature of its markets. The National Stock Exchange (NSE) and the Bombay Stock Exchange (BSE) dominate equity trading, while commodity and currency markets are handled by exchanges like the Multi Commodity Exchange (MCX) and NSE Currency Derivatives.
India’s markets are driven by a mix of domestic and foreign institutional investors (FIIs), retail investors, and algorithmic traders. Each group behaves differently, creating distinct patterns of price movement. For example, FIIs are often influenced by global macroeconomic trends, while retail investors react to domestic news and momentum. Recognizing which group is driving the market at any given moment helps traders align with the prevailing force rather than fight it.
2. Timing is Everything
In Indian trading, timing plays a crucial role. Unlike Western markets, Indian markets operate from 9:15 AM to 3:30 PM, with distinct phases:
Opening volatility (9:15–9:45 AM): News adjustments and overnight developments cause sharp movements.
Mid-session stability (11 AM–2 PM): Institutional participation increases, offering trend clarity.
Closing action (2:45–3:30 PM): Day traders square off positions, and short-term volatility often spikes.
Smart traders avoid jumping in at the opening frenzy unless they’re skilled scalpers. Instead, they wait for confirmation of trends in mid-session before entering trades. Many successful traders also track pre-open market data and FII-DII activity reports to anticipate the day’s direction.
3. The Secret of Volume Analysis
Volume is the footprint of smart money. In India, large institutions often accumulate or distribute shares quietly before big moves. Monitoring unusual volume spikes in less popular stocks can reveal where institutional money is flowing. Tools like the Volume Weighted Average Price (VWAP) and On-Balance Volume (OBV) help traders identify genuine accumulation versus false breakouts.
For example, if a mid-cap stock consistently trades with increasing volume and stable prices, it often signals stealth buying. Conversely, sudden volume surges after a long rally might indicate distribution — a cue for traders to be cautious.
4. News and Event Trading
The Indian market is highly news-sensitive. Announcements such as RBI policy decisions, GDP releases, corporate earnings, or even political events can cause dramatic swings. Experienced traders prepare in advance by maintaining an economic calendar and building strategies around volatility events.
For instance:
Before budget sessions, traders often position themselves in infrastructure and PSU stocks.
Before RBI rate announcements, banking and NBFC stocks are watched closely.
During election periods, volatility surges across indices, creating short-term trading opportunities.
A key secret is not to chase prices after the news breaks but to anticipate how the news will impact sentiment and position early with proper stop-losses.
5. The Role of Technical Analysis
While fundamental analysis explains why a stock should move, technical analysis shows when it will move. In India, many traders rely on technical tools like moving averages, RSI (Relative Strength Index), MACD (Moving Average Convergence Divergence), and Bollinger Bands.
However, the secret lies not in using too many indicators but in mastering a few. Seasoned traders combine price action with volume, trendlines, and support-resistance zones to create high-probability setups. The Indian market often respects round numbers and psychological levels — for example, Nifty 20,000 or Bank Nifty 45,000 — as traders set key positions there.
6. Institutional and FII Tracking
Foreign Institutional Investors (FIIs) play a massive role in market trends. When FIIs buy heavily, the market tends to rally; when they sell, corrections follow. Daily FII-DII data published by the NSE can reveal institutional sentiment.
The secret? Don’t react to one-day flows. Look for multi-day patterns. If FIIs have been net buyers for several sessions, it usually signals a bullish undertone. Retail traders can ride these institutional waves instead of betting against them.
7. Risk Management — The Hidden Power
No trading secret is more powerful than risk control. Even the best analysis fails without discipline. The Indian market, with its high intraday volatility, can wipe out profits quickly if traders neglect stop-losses.
Professional traders follow the 2% rule — never risk more than 2% of total capital on a single trade. They also use trailing stops to lock in profits as the market moves in their favor. Furthermore, diversification across sectors — IT, banking, energy, and FMCG — helps manage risk exposure during sector rotations.
8. Behavioral and Psychological Edge
Trading success in India is as much about psychology as analysis. The market thrives on fear and greed — both of which trap retail traders. The secret is to cultivate emotional discipline:
Don’t chase momentum after large moves.
Don’t panic sell during temporary dips.
Accept losses gracefully and learn from them.
Smart traders treat trading like a business — with records, reviews, and strategy adjustments. Maintaining a trading journal helps identify emotional biases and recurring mistakes.
9. Using Derivatives and Options Smartly
The derivatives segment — especially options trading — has exploded in India. Yet most retail traders lose money because they speculate without understanding volatility and time decay.
The secret is to use derivatives for hedging and strategic advantage. For example:
Buying calls on strong stocks before earnings.
Selling options in range-bound markets to earn premium decay.
Using spreads to limit risk while maintaining directional exposure.
Experienced traders track open interest (OI) data on NSE to gauge market sentiment. Rising OI with price increases signals bullish positions; falling OI indicates unwinding.
10. Learning from Market Leaders and Technology
The final secret is continuous learning and adaptation. India’s trading ecosystem evolves rapidly — with algo trading, smart order routing, and artificial intelligence now influencing prices. Staying updated with market trends, following top investors, and learning from their strategies gives traders a competitive edge.
Platforms like Zerodha Varsity, TradingView, and NSE Smart Trader offer resources to refine trading skills. Moreover, using algorithmic backtesting tools can help validate strategies before risking real capital.
Conclusion: Mastering the Indian Trading Arena
The Indian market offers immense opportunity — from booming IPOs to active derivatives and commodity trading. However, success isn’t about having inside information; it’s about mastering market behavior, timing, discipline, and strategy.
To summarize the secrets:
Study market dynamics and participant behavior.
Perfect your timing based on market phases.
Use volume to detect smart money.
Trade news with preparation, not emotion.
Keep technical analysis simple but effective.
Follow FII-DII data for institutional direction.
Protect your capital through strict risk management.
Develop emotional discipline and patience.
Use derivatives wisely for hedging and leverage.
Keep learning and adapt to technological advances.
Trading in the Indian market isn’t just about buying low and selling high — it’s about understanding why, when, and how prices move. Those who combine knowledge, discipline, and adaptability turn the market’s volatility into opportunity.
In the end, the greatest trading secret is simple: Consistency beats intensity. Small, disciplined wins every day compound into long-term success in India’s dynamic financial markets.

Intraday EURUSD Selling Levels EURUSD available at Daily Support become resistance zone so at H1 two key levels available that may do continuation of trend till bigger supports


Top Big Tech Stocks Leading the Rebound1. Understanding the Big Tech Rebound
The Big Tech rebound can be attributed to a mix of macroeconomic stability, improving corporate earnings, and renewed investor appetite for growth-oriented stocks. Over the past year, inflation has started cooling, and the U.S. Federal Reserve has signaled a pause or potential cuts in interest rates, which directly benefits technology stocks. Lower interest rates make future earnings more attractive in discounted cash flow models, leading investors to reallocate funds toward growth sectors like technology.
Moreover, strong quarterly earnings and improved forward guidance from top tech firms have reinforced faith in their long-term profitability. The adoption of Artificial Intelligence (AI), cloud computing, and digital transformation across industries has provided these companies with new growth engines that extend beyond their traditional business models.
2. Key Factors Fueling the Rally
Several fundamental and structural factors are driving the Big Tech rebound:
Artificial Intelligence Boom:
AI remains the central growth story. Companies integrating AI tools into their ecosystems — from data analytics to automation — are seeing exponential growth in demand. Nvidia’s dominance in AI chips and Microsoft’s integration of AI into its software suite are prime examples.
Easing Interest Rate Pressure:
With inflation moderating, investors expect the U.S. Federal Reserve to adopt a less aggressive stance on rate hikes. This environment favors high-growth tech firms, as it lowers borrowing costs and supports capital investments.
Resilient Earnings Performance:
Despite macro challenges, Big Tech firms have maintained strong profit margins through cost optimization, efficient operations, and diversification of revenue streams.
Massive Cash Reserves and Buybacks:
Big Tech companies hold enormous cash reserves, allowing them to fund innovation, make acquisitions, and repurchase shares — all of which support stock prices.
Digital Transformation Trends:
Enterprises worldwide continue to migrate to cloud-based systems and AI-enhanced tools, reinforcing demand for services offered by Big Tech leaders.
3. Top Big Tech Stocks Leading the Rebound
Let’s explore the key players spearheading this resurgence:
a. Apple Inc. (AAPL)
Apple remains a cornerstone of the global technology market. Despite slower iPhone sales in certain regions, the company’s growing ecosystem of services — including Apple Music, iCloud, and Apple TV+ — has provided stable recurring revenue. The tech giant is also expanding into wearable devices and exploring opportunities in AI and mixed reality through its Vision Pro headset.
Apple’s share repurchase programs and strong brand loyalty continue to attract investors seeking stability and consistent returns. As supply chains normalize and product innovation continues, Apple’s long-term growth outlook remains robust.
b. Microsoft Corporation (MSFT)
Microsoft is arguably the biggest beneficiary of the AI revolution. Through its partnership with OpenAI, Microsoft has embedded AI capabilities into its Office 365 and Azure Cloud platforms, transforming productivity tools and enterprise software. Azure continues to be a major growth driver, accounting for a significant portion of revenue expansion.
The company’s diversification — spanning gaming (Xbox and Activision Blizzard acquisition), enterprise software, and AI-driven applications — provides resilience against economic cycles. Microsoft’s consistent earnings growth and forward-looking AI strategy have made it a market leader in the current rebound.
c. Alphabet Inc. (GOOGL)
Alphabet, Google’s parent company, has also staged a strong comeback. Its core advertising business, powered by YouTube and Search, remains highly profitable, while its Google Cloud segment continues to grow rapidly. The company is leveraging AI to enhance ad efficiency, content moderation, and user personalization.
Alphabet’s AI model, Gemini, positions it as a key player in the race for generative AI dominance. Additionally, Alphabet’s investments in autonomous driving (Waymo) and quantum computing illustrate its long-term innovation strategy.
d. Amazon.com Inc. (AMZN)
Amazon has rebounded strongly on the back of its cloud computing arm, Amazon Web Services (AWS), which remains a market leader. The company’s focus on cost optimization and automation has improved profit margins across its e-commerce operations. Amazon’s AI integration — from logistics and inventory management to Alexa’s generative capabilities — underscores its adaptability.
Additionally, Amazon’s ventures into advertising and streaming (Prime Video) provide new avenues for revenue growth. With the company returning to strong earnings growth, investors see Amazon as a key pillar of the Big Tech rally.
e. Nvidia Corporation (NVDA)
No discussion of the Big Tech rebound is complete without Nvidia. As the world’s leading designer of AI chips and GPUs, Nvidia is the driving force behind the current AI revolution. Its chips power data centers, machine learning models, and autonomous systems globally.
Nvidia’s market capitalization has skyrocketed as demand for AI accelerators from companies like Microsoft, Meta, and Amazon continues to soar. With expanding product lines and leadership in semiconductor innovation, Nvidia is arguably the biggest winner of the current tech boom.
f. Meta Platforms Inc. (META)
Meta has undergone a remarkable transformation. After facing challenges related to advertising slowdown and regulatory scrutiny, the company refocused its strategy under the “Year of Efficiency” initiative. Cost reductions, AI-driven advertising tools, and enhanced engagement on platforms like Instagram and Threads have reignited investor confidence.
While Meta continues to invest heavily in the metaverse and augmented reality, its near-term growth is largely driven by AI-powered ad targeting and short-form video content. The company’s improved margins and strategic execution have made it one of the best-performing Big Tech stocks this year.
g. Tesla Inc. (TSLA)
Tesla’s inclusion in the Big Tech narrative reflects its position at the intersection of technology and mobility. The company’s leadership in electric vehicles (EVs) and advancements in autonomous driving and AI-based energy solutions have made it a market disruptor.
Despite facing margin pressures due to global EV competition, Tesla’s focus on innovation, cost reduction, and energy storage diversification keeps it a critical component of the tech-driven growth story. With new product lines and expansion into energy grids, Tesla remains a vital part of the rebound theme.
4. Broader Market Impact
The Big Tech rally has far-reaching implications. These companies collectively represent over 25% of the S&P 500’s market capitalization, meaning their performance significantly influences the overall index movement. The rebound has restored investor confidence, leading to capital inflows not only into tech ETFs but also into sectors that benefit indirectly — such as semiconductors, software, and digital infrastructure.
Furthermore, global markets are mirroring the U.S. trend, with Asian and European tech firms also witnessing renewed demand as investors bet on the global AI and digitalization wave.
5. Risks and Considerations
While the Big Tech rebound is promising, investors should remain mindful of potential risks:
Regulatory Challenges: Governments worldwide are tightening scrutiny on data privacy, competition, and AI ethics.
Valuation Concerns: Elevated valuations may lead to volatility if earnings growth slows.
Global Supply Chain Risks: Semiconductor supply constraints and geopolitical tensions can impact operations.
Economic Slowdowns: Any resurgence in inflation or aggressive rate hikes could dampen tech valuations.
6. Conclusion
The rebound of Big Tech stocks marks a renewed era of innovation-driven growth. Companies like Microsoft, Nvidia, Apple, Amazon, and Alphabet are not just bouncing back — they are leading the world into the next phase of technological evolution powered by AI, cloud computing, and digital ecosystems.
For investors and learners alike, this rebound offers an important lesson: long-term technological innovation tends to prevail over short-term market fluctuations. As Big Tech continues to shape industries, drive productivity, and redefine the global economy, their leadership in this market rebound underscores their enduring influence in the financial and technological landscape.

Options Trading StrategiesIntroduction
Options trading has evolved into one of the most dynamic and flexible segments of the financial markets. Unlike straightforward stock trading, where you buy or sell shares, options trading gives traders the ability to structure positions that benefit from different market conditions — bullish, bearish, neutral, or volatile.
An option is a derivative contract that gives the holder the right, but not the obligation, to buy or sell an underlying asset (such as a stock, index, or commodity) at a specified price (called the strike price) before or on a particular date (called the expiry date).
Understanding and applying options trading strategies can allow traders to control risk, enhance returns, and profit even when the market moves sideways — a flexibility unmatched in other financial instruments.
1. Understanding the Basics of Options
Before diving into strategies, it’s crucial to grasp the fundamentals.
a. Types of Options
There are two main types of options:
Call Option: Gives the buyer the right to buy the underlying asset.
Put Option: Gives the buyer the right to sell the underlying asset.
b. Key Terminologies
Premium: The price paid for the option.
Strike Price: The price at which the holder can buy or sell.
Expiration Date: The date when the option contract expires.
In-the-Money (ITM): When exercising the option is profitable.
Out-of-the-Money (OTM): When exercising the option would result in a loss.
At-the-Money (ATM): When the strike price equals the market price.
c. Participants in Options Market
Buyers (Holders): Have limited risk (premium paid) but unlimited profit potential (for calls).
Sellers (Writers): Have limited profit (premium received) but potentially unlimited risk.
2. Why Use Options?
Options offer multiple strategic advantages:
Hedging: Protect an existing position against adverse price moves.
Speculation: Profit from market direction or volatility.
Income Generation: Earn premiums through writing options.
Leverage: Control a large position with limited capital.
Portfolio Flexibility: Create payoff structures that match specific market views.
3. Classification of Options Trading Strategies
Options strategies can be broadly divided based on market outlook and complexity.
A. Based on Market View
Bullish Strategies – Expecting prices to rise.
Bearish Strategies – Expecting prices to fall.
Neutral Strategies – Expecting limited price movement.
Volatility Strategies – Expecting large or small market swings.
B. Based on Construction
Single-Leg Strategies: Using one option (e.g., Buy Call).
Multi-Leg Strategies: Combining multiple options to shape risk and reward (e.g., Bull Spread, Iron Condor).
4. Popular Bullish Option Strategies
When a trader expects the underlying asset to rise in price, these strategies can be used:
a. Long Call
Structure: Buy a Call Option.
Objective: Profit from a strong upward move.
Risk: Limited to the premium paid.
Reward: Unlimited upside potential.
Example: Buy 1 NIFTY 22,000 Call at ₹100 when NIFTY = 21,800.
If NIFTY rises to 22,500, the call becomes worth ₹500 — a significant gain.
b. Bull Call Spread
Structure: Buy one Call (lower strike) and Sell one Call (higher strike).
Objective: Profit from a moderate rise in the underlying.
Risk: Limited to net premium paid.
Reward: Capped at the difference between strikes minus premium.
Example:
Buy 22,000 Call @ ₹100
Sell 22,200 Call @ ₹50
Net Cost = ₹50
Max Profit = ₹150 – ₹50 = ₹100
c. Bull Put Spread
Structure: Sell a Put (higher strike) and Buy a Put (lower strike).
Objective: Earn income with limited risk if prices rise or stay stable.
Risk: Difference in strike prices minus premium received.
Reward: Limited to net premium received.
5. Popular Bearish Option Strategies
These are used when expecting prices to decline.
a. Long Put
Structure: Buy a Put Option.
Objective: Profit from a fall in the underlying.
Risk: Limited to premium paid.
Reward: Substantial, as the price can fall sharply.
Example: Buy NIFTY 22,000 Put at ₹120.
If NIFTY falls to 21,500, the Put’s value jumps to ₹500.
b. Bear Put Spread
Structure: Buy a Put (higher strike) and Sell a Put (lower strike).
Objective: Profit from a moderate price decline.
Risk: Limited to net premium paid.
Reward: Limited to the difference in strike prices minus premium.
c. Bear Call Spread
Structure: Sell a Call (lower strike) and Buy a Call (higher strike).
Objective: Earn premium when expecting limited or downward movement.
Risk: Limited; capped by the spread between strikes.
Reward: Limited to premium received.
6. Neutral or Range-Bound Strategies
When the trader expects the market to stay within a range, the goal is to profit from time decay or lack of volatility.
a. Iron Condor
Structure: Combine a Bull Put Spread and a Bear Call Spread.
Objective: Profit if the price remains within a defined range.
Risk: Limited to the width of spreads minus total premium received.
Reward: Limited to the total premium collected.
This is a popular non-directional strategy among experienced traders.
b. Butterfly Spread
Structure: Combination of three strike prices — Buy 1 ITM option, Sell 2 ATM options, Buy 1 OTM option.
Objective: Profit from minimal price movement around a central strike.
Risk: Limited to premium paid.
Reward: Limited but high if price closes near middle strike.
c. Calendar (Time) Spread
Structure: Buy a long-term option and sell a short-term option at the same strike.
Objective: Profit from time decay and stability in price.
Risk: Limited to net debit.
Reward: Moderate, depending on volatility and expiry behavior.
7. Volatility-Based Strategies
These strategies are not focused on direction but rather on how much the market moves.
a. Long Straddle
Structure: Buy 1 Call + 1 Put at the same strike and expiry.
Objective: Profit from large movements in either direction.
Risk: Limited to total premium paid.
Reward: Unlimited on upside or significant downside.
Ideal during major announcements or earnings results.
b. Long Strangle
Structure: Buy 1 OTM Call and 1 OTM Put.
Objective: Profit from high volatility or large price swings.
Risk: Lower cost than Straddle, but needs bigger move to profit.
Reward: Unlimited upside and substantial downside potential.
c. Short Straddle / Short Strangle
Structure: Sell both options (Call and Put).
Objective: Profit from low volatility and time decay.
Risk: Unlimited if market breaks out sharply.
Reward: Limited to premium received.
Used primarily by experienced traders who can manage risk closely.
8. Advanced Multi-Leg and Professional Strategies
a. Iron Butterfly
Structure: Combines aspects of Butterfly and Iron Condor.
Objective: Profit from minimal movement with higher premium capture.
Reward/Risk: Both limited; works best in stable markets.
b. Ratio Spreads
Structure: Buy 1 option and Sell multiple options of another strike.
Objective: Earn higher returns in mildly trending markets.
Risk: Can become unlimited if price moves sharply beyond expected range.
c. Covered Call
Structure: Own the underlying stock + Sell a Call Option on it.
Objective: Generate steady income from held positions.
Risk: Limited downside from stock, capped upside.
Best For: Long-term investors seeking extra yield.
d. Protective Put
Structure: Buy a Put while holding the stock.
Objective: Hedge downside risk (like an insurance policy).
Risk: Premium cost, but protection against steep losses.
9. Risk Management in Options Trading
Even the best strategy can fail without proper risk control.
Follow these golden principles:
Use position sizing – Don’t allocate more than 2–5% of capital per trade.
Set stop-loss levels – Define exit levels before entering.
Avoid over-leverage – Options are leveraged instruments; misuse can lead to rapid losses.
Monitor volatility – Volatility spikes can distort premiums.
Backtest and paper trade before going live.
Use hedging to balance directional exposure.
10. Choosing the Right Strategy
Selecting an options strategy depends on:
Market View: Bullish, Bearish, Neutral, or Volatile.
Risk Appetite: Conservative vs. Aggressive.
Time Horizon: Short-term trades vs. longer-term positions.
Volatility Levels: High volatility favors selling; low volatility favors buying.
For example:
Expecting big move? → Long Straddle or Strangle.
Expecting stability? → Iron Condor or Butterfly.
Expecting a mild uptrend? → Bull Call Spread.
Expecting moderate decline? → Bear Put Spread.
11. Common Mistakes to Avoid
Ignoring implied volatility before trading.
Using naked options without capital cushion.
Overtrading during volatile sessions.
Holding OTM options till expiry hoping for miracle moves.
Not considering time decay.
Skipping risk-reward calculations.
12. Practical Application and Example
Imagine NIFTY is at 22,000, and you expect a modest rise in two weeks.
You buy 22,000 Call @ ₹100
You sell 22,200 Call @ ₹50
→ Bull Call Spread.
If NIFTY closes at 22,300, your profit = ₹150 – ₹50 = ₹100 per unit.
If it falls, your loss = ₹50 (the premium net paid).
Thus, a defined risk and reward structure makes this strategy ideal for disciplined traders.
Conclusion
Options Trading Strategies open a vast field of opportunities for traders to profit from every kind of market — up, down, or sideways. What makes options powerful is their flexibility, limited-risk nature, and ability to hedge existing portfolios.
However, success in options trading doesn’t come from luck; it arises from understanding market structure, volatility, time decay, and disciplined execution. Traders who master both the art and science of strategy selection, risk management, and psychology can turn options into a consistent and powerful trading edge.
In essence, options trading is not about predicting the market but preparing for it.

Update on EUR-USD H& S PatternThe updated analysis is with more detailed analysis for Trade Plan.
The Levels I have marked for tentative Reversal as 50% area and consolidation area at .618 & .382 and Target 3 may be the 1.618 Level.
