EURUSD 1H - LONGFX:EURUSD
Hello traders , here is the full multi time frame analysis for this pair, let me know in the comment section below if you have any questions, the entry will be taken only if all rules of the strategies will be satisfied. wait for more Smart Money to develop before taking any position . I suggest you keep this pair on your watchlist and see if the rules of your strategy are satisfied...
Keep trading
Hustle hard
Markets can be Unpredictable, research before trading.
Disclaimer: This trade idea is based on Smart money concept and is for informational purposes only. Trading involves risks; seek professional advice before making any financial decisions. Informational only!!!
Trade ideas

EUR-USD - Pattern EUR-USD is repeating a Pattern . So in 30 Min TF it is Showing Bullish with a Target as mentioned.

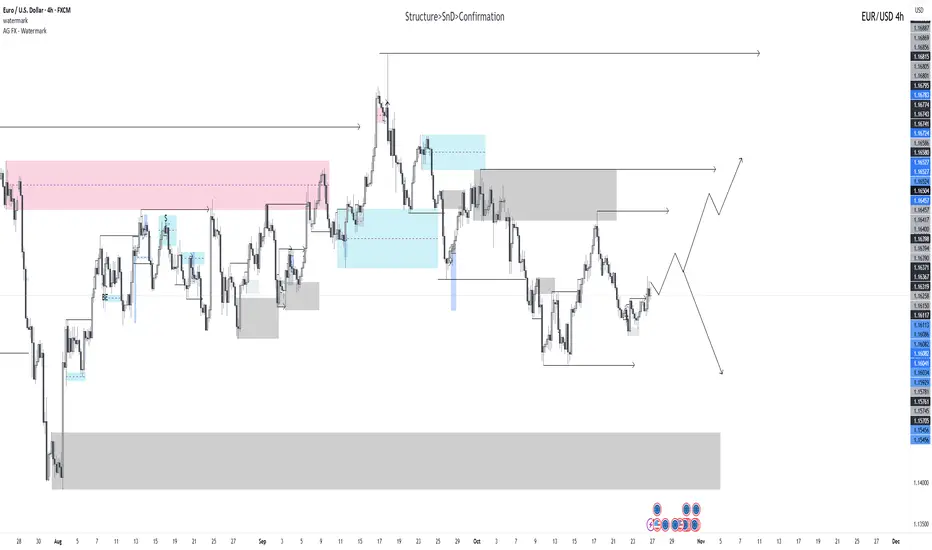
EURUSD - SELL TRADE ON 4 HR TFEURUSD – SELL Setup Loading 🚨📉
📍 Pair: EUR/USD
🕒 Timeframe: 4H | 1H | 15M
🎯 Bias: Short
---
🔍 Market Context
EURUSD has officially broken the key 4H structure level at 1.16635, confirming a bearish shift in market sentiment.
With this clean break, the next step is to wait for a proper retest before executing short entries — patience here will make all the difference.
---
💡 Sell Setup Details
The best opportunity will come from the 1.16454 zone, where a strong Order Block (OB) aligns perfectly with an FVG (Fair Value Gap) — a high-probability confluence zone for institutional reaction.
📌 Ideal Confirmation:
Look for a liquidity sweep on the 1H timeframe before price rejects this zone.
Once the sweep and bearish confirmation candle appear, that’s your cue.
---
🎯 Trade Plan
Entry Zone: 1.16454 (OB + FVG confluence)
Stop Loss: 1.16720
Target: Open space towards 1.16000 and below (watch liquidity pools)
> The key is not just entering — it’s waiting for the liquidity trap to trigger before pulling the trigger.
---
⚙️ Execution Flow
1️⃣ Wait for EURUSD to retest 1.16454 after the breakdown.
2️⃣ Monitor Any zone for liquidity sweep + bearish confirmation.
3️⃣ Place short entry only after rejection candle confirms structure shift.
4️⃣ Manage the trade based on 1H–15M fractal flow and trailing structure.
---
🧠 Pro Tip
The best trades are caught, not chased.
Let the retest complete — once sellers step back in, you’ll ride the move from precision, not prediction.
---
#EURUSD #ForexTrading #SmartMoneyConcepts #OrderBlock #LiquiditySweep #FVG #PriceAction #TradingView

Euro Under Pressure from Strong USDThe euro continues to show weakness against the dollar as global risk sentiment cools and investors shift toward safer assets. Market participants remain cautious ahead of key inflation data from the Eurozone and upcoming comments from Federal Reserve officials, which could clarify the next phase of U.S. monetary policy.
The recent euro recovery attempts have met consistent supply, reflecting pressure from subdued European growth and stronger U.S. economic resilience. The dollar remains supported by robust labor market conditions and persistent inflation expectations, which sustain demand for U.S. yields and Treasury assets.
Liquidity patterns suggest that institutions are still offloading positions near recent highs, keeping EUR/USD confined within a broader corrective cycle. Energy price fluctuations and diverging rate expectations between the ECB and the Fed continue to weigh on sentiment.
Overall, the pair remains under macroeconomic strain, with capital flows favoring the dollar as global markets seek stability am

EUR/USD chart...EUR/USD chart:
Chart timeframe: 2H (2-hour chart)
Pattern: It looks like a descending trendline breakout from a consolidation (range) zone, confirmed by Ichimoku signals and upward momentum.
Indicators: Ichimoku Cloud shows price breaking above the cloud — a bullish sign.
Target zone: my marked two “target points” with arrows on my chart.
---
To estimate the target price, let’s infer it based on the chart:
1. Current price (breakout point): ≈ 1.1667
2. Height of the range (pink box): roughly from 1.1520 to 1.1670
→ Range height ≈ 150 pips (0.0150)
If this is a range breakout, then:
Target 1 (conservative): 1.1667 + 0.0150 = 1.1817
Target 2 (extended): another projection from that = 1.1967
---
✅ Targets Summary:
🎯 Target 1: 1.1817
🎯 Target 2: 1.1967
These align with my chart’s two “target point” lines visually.

EURUSD for next week -> 27 OctExpecting a bullish trend on Monday. There is Liquidity on both side but expecting a continuation of structural trend.
---> - Liquidity.
--- - BOS
Pair Trading and Statistical ArbitrageIntroduction
In the modern world of financial markets, trading strategies have evolved beyond mere speculation to include sophisticated mathematical and statistical methods. Two such strategies—pair trading and statistical arbitrage—have gained significant traction among institutional traders, hedge funds, and quantitative analysts. Both methods rely on identifying price relationships and exploiting short-term inefficiencies, offering traders the potential to earn profits regardless of market direction. These strategies are categorized under market-neutral trading, meaning they aim to minimize market exposure while profiting from relative price movements.
Pair Trading: Concept and Fundamentals
Pair trading is a market-neutral strategy that involves trading two historically correlated assets, usually stocks, such that when the price of one asset deviates from the other, traders take positions expecting a reversion to the mean. This approach was popularized by Nunzio Tartaglia and the quantitative team at Morgan Stanley in the 1980s and has since become a staple in quantitative trading.
Key Principles of Pair Trading:
Correlation Analysis:
The first step is to identify two assets with historically high correlation. This means that their prices generally move in tandem due to common economic, sectoral, or company-specific factors. For example, Coca-Cola and Pepsi, being major competitors in the beverage sector, often exhibit high correlation.
Price Divergence Detection:
Once a pair is selected, traders monitor for deviations from their historical price ratio. If one asset significantly outperforms the other, a trading opportunity arises.
Market-Neutral Positioning:
In a typical pair trade, traders buy the underperforming asset and short-sell the outperforming asset, expecting the spread to converge back to historical norms.
Mean Reversion Hypothesis:
Pair trading relies on the assumption of mean reversion—that asset prices will revert to their historical relationship over time. This principle differentiates pair trading from trend-following strategies, which assume that asset prices will continue in the same direction.
Example of a Pair Trade:
Selection: Consider stocks A and B, which normally maintain a 1:1 price ratio.
Divergence: Stock A rises by 10% while Stock B remains unchanged.
Trade Setup: Trader shorts Stock A and goes long on Stock B.
Outcome: If the prices converge (Stock A falls or Stock B rises), the trader profits from the spread rather than the absolute price movement.
Advantages of Pair Trading:
Market Neutrality: Profits can be made in bullish, bearish, or sideways markets.
Risk Reduction: Diversification across two correlated assets reduces exposure to overall market risk.
Quantitative Precision: Historical data allows statistical modeling to optimize entry and exit points.
Limitations:
Model Risk: Historical correlations may break due to structural market changes.
Execution Costs: Frequent trades may incur transaction costs and slippage, affecting profitability.
Tail Risk: Extreme market events can disrupt correlations, leading to significant losses.
Statistical Arbitrage: Advanced Quantitative Strategy
Statistical arbitrage (or stat arb) is a broader, more sophisticated trading strategy that extends the principles of pair trading to multiple assets, sectors, or even markets. It uses advanced statistical and mathematical models to exploit short-term mispricings across securities. Unlike pair trading, which focuses on a single pair, statistical arbitrage often involves portfolios of hundreds of assets, dynamically adjusting positions based on predictive models.
Core Components of Statistical Arbitrage:
Quantitative Modeling:
Stat arb relies on rigorous quantitative techniques such as cointegration analysis, principal component analysis (PCA), and machine learning algorithms to identify relationships among assets and forecast price deviations.
High-Frequency and Low-Latency Trading:
Many stat arb strategies operate in high-frequency trading (HFT) environments, capitalizing on price inefficiencies that exist for milliseconds or seconds. Advanced infrastructure is critical to minimize latency and maximize profits.
Mean Reversion and Momentum Models:
While pair trading primarily depends on mean reversion, stat arb strategies can integrate momentum signals, volatility adjustments, and cross-asset relationships, making them more adaptive to changing market conditions.
Portfolio Diversification:
Statistical arbitrage typically constructs a market-neutral portfolio where the combined long and short positions are balanced. This diversification reduces idiosyncratic risk and enhances the stability of returns.
Steps in Statistical Arbitrage:
Data Collection: Gather historical prices, volumes, fundamental data, and macroeconomic indicators.
Signal Generation: Use statistical methods to identify mispricings or anomalies.
Position Sizing: Optimize weights of long and short positions using risk-adjusted metrics like Sharpe ratios or Value at Risk (VaR).
Execution: Employ automated trading systems to enter and exit positions efficiently.
Monitoring and Adjustment: Continuously recalibrate models to adapt to market changes.
Example of Stat Arb:
Universe Selection: 100 tech stocks listed on the NASDAQ.
Signal Identification: PCA reveals that three stocks deviate significantly from their predicted factor loadings.
Trade Execution: Short the overperforming stocks and go long on underperforming ones, with hedging adjustments to maintain market neutrality.
Profit Realization: Gains come from convergence toward predicted statistical relationships rather than the absolute market movement.
Advantages of Statistical Arbitrage:
High Return Potential: Exploiting numerous minor mispricings across assets can compound into substantial profits.
Robust Risk Management: Diversification across multiple positions reduces the impact of single-event risks.
Algorithmic Precision: Automated systems allow for consistent application of complex models without emotional bias.
Limitations:
Model Complexity: Requires sophisticated mathematical knowledge and programming expertise.
Data Dependency: Reliance on historical patterns may fail in new market regimes or during structural breaks.
Competition and Crowding: High adoption among hedge funds can reduce alpha generation and compress profits.
Transaction Costs: Frequent trading can significantly erode net returns if not carefully managed.
Applications in Modern Markets
Equity Markets:
Both strategies are extensively used in stock markets. Pair trading is popular among retail and hedge fund traders, while stat arb dominates quantitative hedge funds like Renaissance Technologies and Two Sigma.
Forex Markets:
Currency pairs offer excellent opportunities for pair trading due to their inherent correlation, especially in major currency crosses like EUR/USD and GBP/USD.
Commodity Markets:
Related commodities such as crude oil and natural gas, or gold and silver, can be traded using mean reversion-based strategies.
Derivatives:
Options and futures can be incorporated in statistical arbitrage models to hedge volatility and leverage complex payoffs.
Cross-Market Arbitrage:
Advanced stat arb strategies may exploit mispricings between equities, bonds, commodities, and currencies, often using global market data for predictive modeling.
Risk Management Considerations
Even market-neutral strategies are not risk-free. Key considerations include:
Correlation Breakdown: Assets that were historically correlated may diverge due to sectoral shocks or macroeconomic events.
Execution Risk: Delays, slippage, and partial fills can reduce expected profits.
Model Risk: Overfitting historical data may generate false signals.
Liquidity Risk: Some stocks or assets may lack sufficient volume to execute large positions without impacting price.
Tail Risk Events: Extreme market events, like the 2008 financial crisis, can overwhelm statistical relationships.
Effective risk management involves:
Position limits
Stop-loss mechanisms
Diversification across multiple pairs or portfolios
Continuous model recalibration
Technological Requirements
Both pair trading and statistical arbitrage benefit from technology:
Data Infrastructure: Access to high-quality historical and real-time data is critical.
Algorithmic Trading Platforms: Automatic order placement reduces latency and improves execution efficiency.
Statistical Software: Tools like Python, R, MATLAB, and machine learning frameworks enable modeling of complex relationships.
Backtesting Capabilities: Simulating strategies on historical data helps identify weaknesses before deploying capital.
Conclusion
Pair trading and statistical arbitrage represent the pinnacle of quantitative, market-neutral trading strategies. Pair trading offers a straightforward approach based on relative price movements between two correlated assets, while statistical arbitrage scales this concept to multiple securities, employing complex models to exploit small inefficiencies. Both approaches underscore the importance of data-driven decision-making, risk management, and technological sophistication in modern financial markets.
While these strategies can generate consistent returns with reduced exposure to market direction, they are not without challenges. Market structural changes, execution costs, and model risk can erode profitability if not carefully managed. Therefore, success in pair trading and statistical arbitrage requires a combination of statistical expertise, trading discipline, and continuous adaptation to evolving market conditions.
Ultimately, these strategies exemplify how modern finance increasingly relies on quantitative methods, automation, and statistical reasoning to navigate complex markets and extract alpha in a competitive, high-speed trading environment.

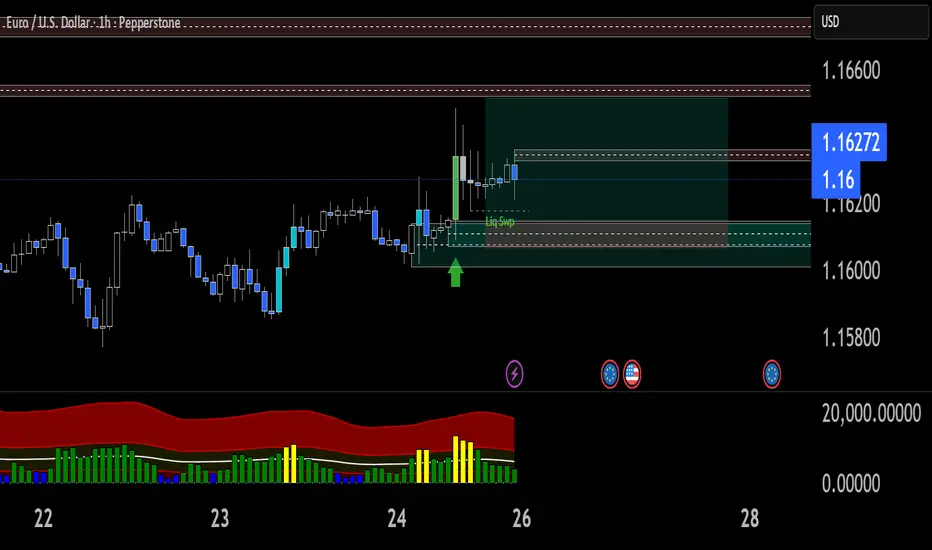
EUR/USD Bullish Setup – Liquidity Sweep & Break of StructureI’m sharing a long trade setup on EUR/USD based on a liquidity sweep and bullish market structure shift.
Price swept liquidity below the recent swing low and immediately showed strong bullish reaction, indicating absorption of sell-side liquidity. Following the sweep, price broke above short-term structure and retested the demand zone, confirming bullish intent.
I entered long at the retest of the demand area, with my stop-loss placed just below the liquidity sweep low to protect against invalidation. The take-profit target aligns with the next major supply zone / equal highs.
Trade Details:
Entry: 1.16147
Stop-Loss: 1.16066 (below liquidity sweep area)
Take-Profit: 1.16515 (major resistance/target zone)
Risk-to-Reward Ratio: 1:4.5+
Why this trade?
Liquidity sweep below previous lows (manipulation phase)
Break of structure to the upside confirming bullish momentum
Retest of demand zone with bullish candle confirmation
Volume spike supporting buyers entering the market
If price holds above the retest zone, I expect continuation to the upside toward the marked target area.
Part 9 Trading Master ClassHow Option Trading Works
Let’s take an example:
You buy a call option for a stock at a strike price of ₹100 for a premium of ₹5.
If the stock price rises to ₹120 before expiry, you can exercise your right to buy at ₹100 and sell at ₹120, earning ₹20 profit per share (minus ₹5 premium = ₹15 net profit).
If the price remains below ₹100, you simply let the option expire and lose only the premium paid (₹5).
This flexibility — limited loss and unlimited profit potential for buyers — is what makes option trading so attractive.

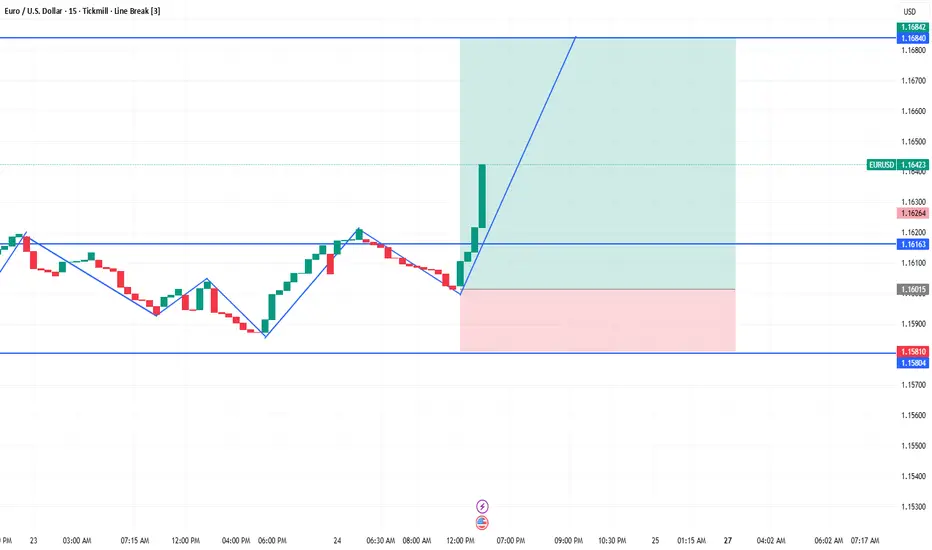
Bullish Setup – Planning the Trade Before It Plays OutEntry – 1.16116
This is where I’m interested in buying. I want to see price confirm momentum — maybe a bullish engulfing candle or a clean breakout and retest.
Stop Loss – 1.15804
If price drops back below that level, it’s a clear sign my idea isn’t playing out — and I’d rather take a small loss than hold and hope.
🎯 Take Profit – 1.16840
My target is set around the next resistance zone, where price might start slowing down or meeting sellers.
That gives me a solid risk-to-reward ratio of about 1:2.3, meaning I’m risking 1% to aim for roughly 2.3% profit.
I’ll be patient for confirmation before entering — no rush.
The goal isn’t just to catch a move; it’s to take a high-probability trade where risk is clearly defined.
Part 9 Trading Master ClassThe Role of Time Decay (Theta)
One of the most crucial aspects of options is time decay, or Theta. Every day that passes reduces the time left for an option to become profitable. This means option buyers are fighting against time, while sellers benefit from it.
For example, an option worth ₹10 today may be worth only ₹5 a week later — even if the stock price hasn’t changed — because its time value has decayed.
This is why experienced traders say, “Options are wasting assets.”
Option sellers often use this decay to their advantage, designing trades that profit as time passes, provided the market doesn’t move too sharply.

How to Avoid Breakout Traps in the Trading Market1. Understanding Breakout Traps
A breakout trap occurs when the price of an asset moves beyond a key technical level, such as support, resistance, or a trendline, but fails to sustain the breakout. This leads to a reversal in the opposite direction, often catching traders who entered the trade on the initial breakout off guard.
Breakout traps can be classified into:
Bullish traps: Price breaks above resistance but then reverses downward. Traders buying on the breakout suffer losses.
Bearish traps: Price breaks below support but then reverses upward. Traders selling or shorting the market face losses.
Why Breakout Traps Happen
Breakout traps often occur due to:
Market manipulation: Large institutional traders sometimes push prices beyond levels to trigger stop-loss orders or attract retail traders.
Lack of volume confirmation: A breakout with weak volume is more likely to fail. Genuine breakouts are usually accompanied by high trading volume.
Overextended markets: When prices are already in an overbought or oversold condition, breakouts are prone to failure.
False news or rumors: Sudden news events can cause price spikes that quickly reverse once the market digests the information.
2. Key Technical Levels and Breakout Identification
To avoid breakout traps, traders must accurately identify key levels where breakouts are likely.
Support and Resistance
Support: The price level where demand is strong enough to prevent the price from falling further.
Resistance: The price level where selling pressure overcomes buying interest, preventing the price from rising.
Breakouts are confirmed when the price closes beyond these levels with sustained momentum. A breakout that does not close beyond these levels or lacks follow-through can be a trap.
Trendlines and Channels
Uptrend: Connecting higher lows provides support levels.
Downtrend: Connecting lower highs provides resistance levels.
Breakouts through trendlines are particularly prone to traps if the move is shallow or lacks momentum.
Chart Patterns
Patterns like triangles, rectangles, and flags often produce breakouts. However, these patterns can also generate false signals if the breakout is not supported by volume or broader market conditions.
3. Strategies to Avoid Breakout Traps
Avoiding breakout traps requires a combination of technical analysis, risk management, and patience. Here are key strategies:
a. Confirm with Volume
A strong breakout is often accompanied by high trading volume. Low-volume breakouts are suspicious and may indicate a lack of conviction.
Practical Tip:
Look for a volume increase of at least 30–50% above average on breakout days.
In the absence of significant volume, wait for confirmation before entering.
b. Wait for a Retest
One of the most reliable ways to avoid a trap is to wait for the price to retest the breakout level:
After breaking resistance, the price often returns to test the previous resistance as support.
After breaking support, the price may retest it as resistance.
Entering on the retest increases the probability that the breakout is genuine.
c. Use Multiple Timeframes
Breakouts are more reliable when confirmed across multiple timeframes:
Short-term breakouts on a 5-minute chart may be traps if the daily chart does not confirm the trend.
Combine long-term and short-term charts to filter false signals.
d. Analyze Market Context
Understanding the broader market trend is critical:
Breakouts aligned with the overall trend have a higher success rate.
Breakouts against the major trend are often traps.
For example, in a strong uptrend, bullish breakouts are more reliable; bearish breakouts may be false signals.
e. Use Indicators to Confirm Breakouts
Certain technical indicators can help confirm breakout strength:
Relative Strength Index (RSI): Avoid breakouts when RSI is in extreme overbought/oversold conditions.
Moving Averages (MA): Look for breakouts above key moving averages (e.g., 50-day, 200-day) as confirmation.
MACD: Positive MACD crossovers can support bullish breakout validity, while negative crossovers support bearish breakout strength.
f. Monitor Order Flow and Liquidity
Institutional traders often influence breakout behavior:
Watch the order book for large sell or buy orders near key levels.
Low liquidity levels can exaggerate price spikes and cause traps.
g. Set Proper Risk Management
Even with all precautions, false breakouts can occur. Proper risk management is essential:
Use stop-loss orders just below the breakout support (for bullish trades) or above resistance (for bearish trades).
Consider position sizing carefully to limit losses if the breakout fails.
h. Beware of News and Events
Major news, earnings, or geopolitical events can trigger spikes that appear as breakouts. These are often volatile and short-lived.
Avoid trading breakouts immediately after major news releases unless you have a clear strategy.
4. Common Patterns of Breakout Traps
Understanding typical breakout trap patterns can help traders recognize potential risks:
Fake Break Above Resistance
Price temporarily rises above resistance.
Reverses quickly, trapping traders who entered long.
Often occurs when the market is overextended or volume is weak.
Bear Trap
Price breaks below support briefly.
Reverses upward, catching short sellers.
Common near trend reversals or in strong uptrends.
False Breakout in Ranges
In range-bound markets, price may briefly cross support/resistance without forming a trend.
Traders often mistake this for a breakout, leading to losses.
5. Psychological Factors Behind Breakout Traps
Trader psychology plays a crucial role in breakout traps:
Fear of Missing Out (FOMO): Traders rush into breakouts without confirmation, increasing the likelihood of entering a trap.
Overconfidence in Patterns: Over-reliance on chart patterns without considering market context can lead to false trades.
Herd Behavior: Following mass trades without independent analysis often results in being trapped in false breakouts.
Being aware of these psychological pitfalls can improve discipline and reduce susceptibility to traps.
6. Examples of Avoiding Breakout Traps
Example 1: Bullish Breakout with Low Volume
Resistance at ₹100
Price moves to ₹102 on low volume
Price quickly falls back to ₹98
Lesson: Wait for volume confirmation or retest before buying
Example 2: Bear Trap in an Uptrend
Support at ₹150
Price breaks ₹148 briefly, triggering short positions
Price rebounds to ₹155
Lesson: Trade with the trend and confirm with higher timeframes
7. Combining Strategies for Maximum Safety
Avoiding breakout traps is most effective when combining multiple strategies:
Confirm breakout with volume and indicators.
Check the trend and multiple timeframes.
Wait for retests or consolidation after the breakout.
Implement strict risk management with stop-losses and position sizing.
Avoid trading purely based on news spikes.
By layering these techniques, traders can significantly reduce the risk of being caught in a false breakout.
8. Conclusion
Breakout trading offers substantial profit opportunities, but false breakouts or breakout traps remain a persistent challenge. Avoiding these traps requires a combination of technical analysis, market awareness, and disciplined trading psychology. Key steps include:
Confirming breakouts with volume and indicators.
Waiting for retests before entering trades.
Aligning trades with the broader market trend.
Using multiple timeframes for confirmation.
Applying proper risk management with stop-losses.
Ultimately, avoiding breakout traps is less about finding perfect signals and more about reducing risk, being patient, and trading with discipline. By following these strategies, traders can improve their success rate, protect their capital, and build confidence in breakout trading strategies.
EUR/USD (Euro vs US Dollar) chart on the 2-hour timeframe...EUR/USD (Euro vs US Dollar) chart on the 2-hour timeframe, here’s a detailed breakdown of what my setup is showing and the likely target levels 👇
---
🧭 Chart Overview:
Current price: ≈ 1.1608
My using Ichimoku Cloud, trendlines, and measured move projections.
The chart shows a breakout from a falling channel, with two marked target points above.
---
🎯 Target Points (as per my chart):
1. First Target (Short-term):
Roughly around 1.1680 – 1.1700
This level aligns with the top of the Ichimoku Cloud and previous structure resistance.
It’s my initial profit zone after confirmation of breakout continuation.
2. Second Target (Extended):
Roughly around 1.1780 – 1.1800
This level is derived from the measured move (height of previous range projected upward).
It represents the full bullish objective if momentum sustains.
---
⚙ Trading Logic (Example):
Buy Entry: After breakout retest near 1.1600 – 1.1620
Target 1: 1.1680 – 1.1700
Target 2: 1.1780 – 1.1800
Stop Loss: Below 1.1550 (previous swing low / lower cloud boundary)
---
📊 Potential Gain:
From 1.1600:
Target 1: ≈ +80 pips
Target 2: ≈ +180–200 pips

EURUSD MULTI TIME FRAME ANALYSISHello traders , here is the full multi time frame analysis for this pair, let me know in the comment section below if you have any questions , the entry will be taken only if all rules of the strategies will be satisfied. wait for more price action to develop before taking any position. I suggest you keep this pair on your watchlist and see if the rules of your strategy are satisfied.
🧠💡 Share your unique analysis, thoughts, and ideas in the comments section below. I'm excited to hear your perspective on this pair .
💭🔍 Don't hesitate to comment if you have any questions or queries regarding this analysis.

Buy Trade - EUR/USDGreetings to everyone!
You can place a buy trade on EUR/USD and check out my chart for the ideal entry, stop-loss & target placement.
Remember :-
* Move your SL to breakeven once the trade reaches 1:1 R.
* Aim for a minimum reward of 1:1.5 R.
* Don't risk more than 3% of your total margin.
Let's execute this trade smartly! 🚀
💬 About Me:
I am a professional trader with over four years of experience in the markets. I focus on swing trading using the 4H timeframe, mainly in the forex space. The trades I share here are the actual positions I’m executing. I post them as a small gesture to give back to the trading community that’s been a big part of my journey.
Cheers! 🙏


EURUSD is in H & S PatternEUR-USD is trading in H & S Pattern in 30Min TF. If it breaks then, it may achieve the Target Supply.

EURUSD for Next Week ->13 OCTLooking for some sell from first zone of supply but clearly we might running out of liquidity. Might grab some liquidity on Top of first supply zone to go lower.

EURUSD - BEARS BACK IN CONTROL?Symbol - EURUSD
EURUSD continues to extend its downward trajectory, maintaining a locally bearish market structure. A decisive breakdown of the nearest support level could accelerate the sell-off, paving the way for fresh lows.
The US dollar remains firm, while the pair shifts its medium-term direction following a breakout from consolidation. The overall structure remains weak, and the decline may extend toward the 1.1400 region.
The primary focus remains on the ongoing consolidation forming within the broader downtrend. Sustained trading below 1.1588 and a daily close beneath 1.1557 would reinforce bearish sentiment, potentially triggering a move toward the liquidity zone at 1.1460 – 1.1400
Resistance levels: 1.1588, 1.1630
Support levels: 1.1557, 1.1461
On the daily timeframe, the market has confirmed a reversal in trend, with a local bearish distribution phase developing. The area of liquidity that may attract price activity lies below 1.1400, suggesting that a medium-term decline remains probable if the price closes beneath 1.1557

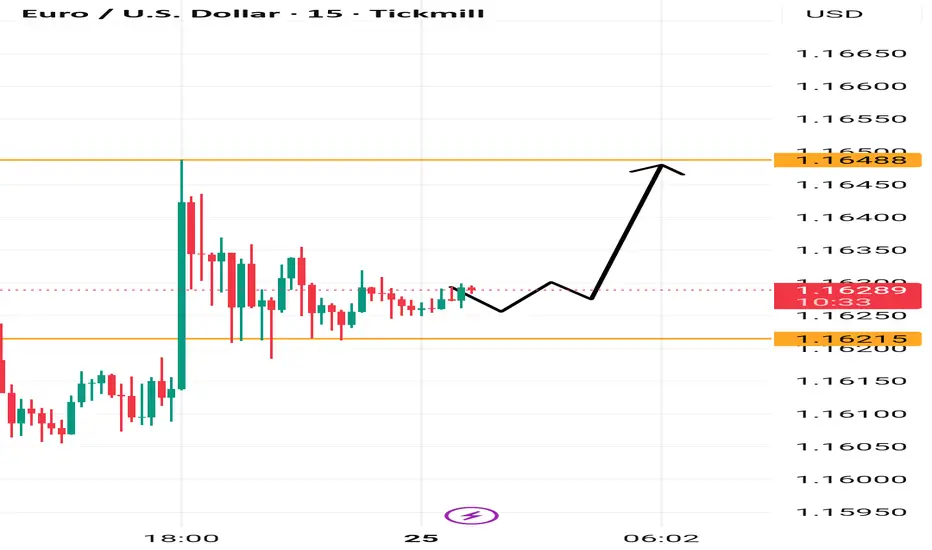
EUR/USD buy-side setupEUR/USD is holding strong near support at 1.1663.
Expecting a bullish move towards 1.1693 as long as price sustains above the buy zone.

EURUSD MULTI TIME FRAME ANALYSISHello traders , here is the full multi time frame analysis for this pair, let me know in the comment section below if you have any questions , the entry will be taken only if all rules of the strategies will be satisfied. wait for more price action to develop before taking any position. I suggest you keep this pair on your watchlist and see if the rules of your strategy are satisfied.
🧠💡 Share your unique analysis, thoughts, and ideas in the comments section below. I'm excited to hear your perspective on this pair .
💭🔍 Don't hesitate to comment if you have any questions or queries regarding this analysis.

Will crude move north?EUR/USD vs crude
Eur/usd and crude have a positive correlation. Here crude is a laggard. In the current scenario if u look at the charts, EUR has been advancing for quite some time while crude is still correcting. Its a clear indication to the sleeping bear that things can change for crude anytime.
Fib - On the right chart the pair is at an imp resistance of 1.1777 with next crucial resistance at 1.2228. This zone has not been crossed since 2014 now. Hence to me this is the most zone going ahead and above that will be a breakout.
MA- the two faster MA's will cross the slower one after a decade. This is very bullish.
Conclusion - hence to me it is just a matter of time that crude will also begin its upward journey. Its positive for Equity mkts and positive for Oil and Gas stocks
