LONG OPPORTUNITY ON EURUSDThere is a buying opportunity available on eurusd as the market structure is bullish for now but there is two probability available for long which I have mark the levels with black zone if Market comes to the second black zone then that would be a good buy as there is also the fib 61.8% level note only trade on zone when the trendline is break+retest here retest is imp while retesting ensure that market must failed to break the previous low and enter on a buying green healthy candle.
Trade ideas

EUR/USD Elliott Wave Update –Classic Wave 5 Breakout Opportunity
This chart of the EUR/USD pair shows a well-structured Elliott Wave impulse pattern unfolding on the 4-hour timeframe. The price action is currently progressing in the final Wave (5) of the impulse cycle, which typically represents the last bullish leg before a larger correction begins.
Wave (1): The initial move up from the bottom (early May), showing a clean 5-wave internal structure.
Wave (2): A healthy retracement after Wave 1, forming a base for further upside.
Wave (3): The strongest and steepest rally, as expected in Elliott theory. It broke past previous highs and extended sharply.
Wave (4): A corrective phase that formed a falling wedge pattern — typically a bullish continuation pattern.
Wave (5): Currently in progress. The wedge has broken to the upside, confirming the potential start of Wave 5.
Target 1 (T1): 1.18306
Target 2 (T2): 1.19012
Stop Loss (SL): 1.16600
After a strong uptrend, the market went sideways in a wedge pattern (a typical wave 4 behavior). It has now broken out, signaling the start of the final wave 5 move. This is often a strong and sharp push. Since the breakout is clean and the Elliott wave count aligns well, this creates a favorable long opportunity.

EUR/USD breaks key trendline – Is a bearish reversal underway?At the start of the week, the EUR/USD pair has officially broken its months-long upward trendline, signaling a potential short-term bearish reversal.
As of now, EUR/USD is trading around 1.169, performing a retest of the broken trendline. If the pair closes below this key level, it may confirm the breakout and open the door for a deeper decline.
Do you agree with my view?

FED CHAIR POWELL SPEECH EURUSD 15 ANALYSISTodays fed chair speech our target for eurusd is marked on the chart as a buyside liquidity , as we are bullish in eurusd and we have buyside liquidity we are targeting that it may go lower to take some liquidity and then go for the buyside....keep following me for more updates.

EUR/USD Trading Towards Previous Weekly High?Hello traders , here is the full multi time frame analysis for this pair, let me know in the comment section below if you have any questions , the entry will be taken only if all rules of the strategies will be satisfied. wait for more price action to develop before taking any position. I suggest you keep this pair on your watchlist and see if the rules of your strategy are satisfied.
🧠💡 Share your unique analysis, thoughts, and ideas in the comments section below. I'm excited to hear your perspective on this pair .
💭🔍 Don't hesitate to comment if you have any questions or queries regarding this analysis.

my view on EURUSD bullish ...hey guys am expecting EURUSD to be bullish as of right now as it is in bullish trend. but still if it breaks some structure to downside we may be bearish for some time . lets see

EURUSD Analysis on(21/07/2025)#EURUSD UPDATEDE
Current price - 1.16900
If price stay above 1.16300 then next target 1.17800,1.18300 and below that 1.15600

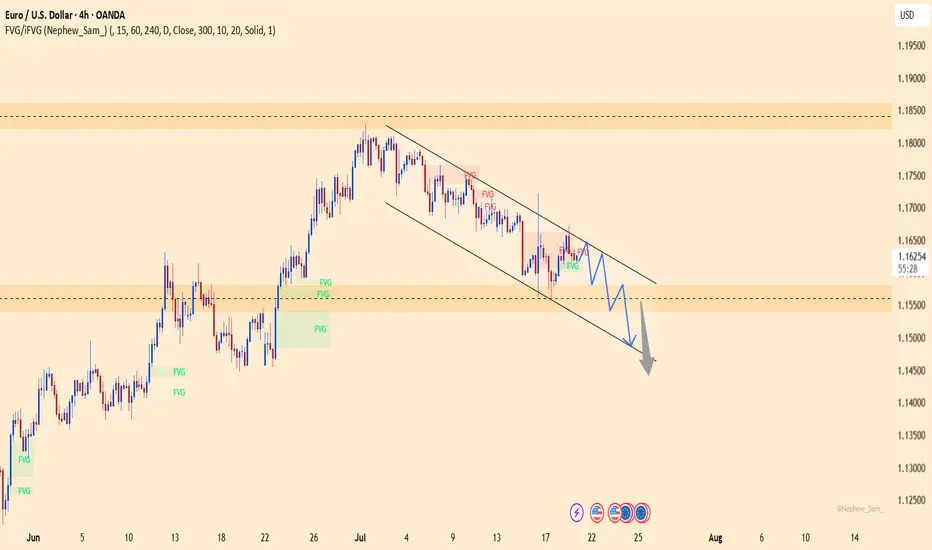
EURUSD – Trend broken, bearish momentum accelerating!EURUSD is maintaining a clear downtrend structure within a well-defined descending channel, with consistently lower highs forming. Fair Value Gaps (FVGs) keep getting rejected, signaling that sellers are firmly in control. The current scenario points to a technical bounce toward the 1.164 zone, followed by a likely rejection back down to the lower boundary near 1.148.
Technical signals confirm the bearish bias as price respects both the trendline and the supply zones, failing to break above recent resistance levels.
On the fundamental side, the ECB has recently struck a more dovish tone due to cooling inflation, while the USD is regaining strength amid expectations that the Fed will keep rates elevated longer — all of which continue to pressure the euro lower.
EURUSD 1H ANALYSIS (ICT MARKET STRUCTURE)As we have taken support form 1h fvg and the bias is bearish , when the take supprt from fvg we make a swing high as itm(intermediate high)and his left and right side we make short term high (STH),we are expecting to reach the target that i have marked but if we break sth then we will close the trade ....for more update keep following me.

Dollar is about to strengthen again EURUSD 1.1625
Elliott - this rally is done and now a three wave correction should start from here. I have divided the C waves into its own 5 waves on the weekly charts on the right. Hence the rally is done.
RSI - the RSI continues to oscillate in the bear zone indicating the long term trend is still down. Composite is giving a negative divergence at resistance which is trend reversal.
Conclusion - this is in particular very imp to us as the change in trend first happens in the currency mkt. Weak EUR against dollar means weakness for the Equity mkt.

EURUSD on the verge – a trap waiting for the carelessThis pair has just completed a classic rounding top, with a sharp rejection near 1.16500. Buying momentum is fading, RSI is dropping, and the recent retest of the broken trendline might have been the final warning – the “kiss of death” could already be in play.
On the fundamental side, the U.S. keeps fueling the dollar: consumer spending is rising, jobless claims are falling, and the Fed shows no sign of easing up. Meanwhile, the ECB is still searching for direction, leaving the euro exposed and vulnerable.
If the current support level breaks, EURUSD could slide quickly to lower zones. This is no longer a time for hope – it’s time to choose a side and act.

EURUSD under pressureEURUSD is moving within a well-defined descending channel, forming consistent lower highs and lower lows. The price has recently rejected the resistance zone near 1.16100, showing signs of continued bearish momentum.
On the fundamental side, stronger-than-expected U.S. retail sales—especially in the core figure—have boosted the U.S. dollar, putting downward pressure on the euro. Coupled with ongoing concerns about Eurozone economic growth, the pair is likely to continue its decline toward the 1.15400 support area. RSI remains below the neutral zone, confirming short-term bearish bias.
Traders should watch closely for reactions at support to assess further short opportunities.

EUR/USD: Continuing Downtrend and Key Levels to WatchHello traders, what are your thoughts on EUR/USD?
Today, EUR/USD continues its strong downtrend, currently trading around 1.161. One of the key factors driving this decline is the strong recovery of the USD. Following the release of positive data from the US, especially the unemployment report, the market has reinforced expectations that the Fed will maintain high interest rates for a longer period. This has reduced the appeal of the euro, putting significant pressure on EUR/USD.
From a technical perspective, the price is approaching the trendline's lower limit, and a breakout at this point could push EUR/USD further down. Personally, I expect the EMA 89 area to be an ideal target for this strategy.
What about you, do you agree with my outlook? Feel free to share your thoughts, and let’s discuss!

EURUSD 15 MIN ANALYSIS HOUSING STARTS NEWSAs we have taken buyside liquidity of the previous day we can expec to mov downword at sharp 8:30 new york session timing. so keep your eyes on chart at 8:30 economic event news we can see a bearish move.keep following for more updates.

LONG OPPORTUNITY ON EURUSD 1.16048 LEVELOn 1hr time frame market is bullish and a pull back is remaining for a market to move upside as soon as we shift to 15 min time-frame we can see a level of resistance become support on 1.16048 zone level and also there is a Fibonacci retracement 61.8% golden ratio ONLY ENTER WHEN MARKET TAP AT THAT ZONE AND A HEALTHY BULLISH BAR CANDLE CLOSE.

"Big Move Loading on EUR/USD! 🔥 "Big Move Loading on EUR/USD! 🚨"perfect Elliott Wave trap is forming – will you catch the fall or get caught at the top? 📉📈
Future Projection (Right Side Drawing)
You have projected a Bearish 5-Wave Impulse (Elliott Wave):
1. The market is expected to reverse from the C wave top (around 1.16023 - 1.16294).
2. After this, a 5-wave bearish pattern may unfold.
3. Target: Down to the 1.16017 → 1.15449 zone.
---
📌 Key Levels to Watch:
Level Significance
1.16294 Strong resistance (Wave C potential top)
1.16023 Minor resistance
1.16022 Price is near this resistance zone
1.16017 Break of this confirms bearish impulse
1.15937 Minor support
1.15449 Major support / Final target
---
🧠 Trading Insight:
If you're trading this:
✅ Sell Setup Activation: Wait for rejection in the C zone (1.16022–1.16294).
📉 Short Entry: After confirmation (bearish engulfing, trendline break, etc.).
🎯 Targets: 1.16017 → 1.15937 → final target 1.15449.
🛑 Stop Loss: Above 1.16300 ideally
Falling Wedge Pattern
ABC Zigzag Correction
Elliott Wave (5-wave bearish projection)
Supply & Demand Zones
Price Action Confirmation
---

Euro Slips Further as Safe-Haven Demand for USD GrowsThe EUR/USD pair is facing strong selling pressure as global financial markets continue to reel from geopolitical and trade-related tensions. The Euro is weakening as investors increasingly turn to the U.S. Dollar as a safe haven, following a series of aggressive tariff policies announced by the United States.
Adding to the Euro’s struggles is the lack of positive economic data from the Eurozone, which has further diminished hopes for a meaningful recovery. Traders are now closely watching for monetary policy signals from both the ECB and the Federal Reserve, but so far, the bearish trend remains firmly in place.
On the technical front, EUR/USD continues to move within a descending channel, while the bearish crossover of the EMA 34 and 89 keeps sellers in control. With risk sentiment leaning defensive and capital flowing toward safe-haven assets, the pair may see further downside unless surprise bullish catalysts emerge from upcoming data or central bank remarks.

EUR/USD Under Pressure: Will the Downtrend Continue?The EUR/USD exchange rate remains under pressure today, fluctuating below the 1.1700 level as the U.S. dollar gains strength following President Trump's announcement of new tariff letters directed at his two largest trade partners, boosting demand for safe-haven assets.
The downtrend may be further reinforced in the near term, if not in the short run. On the chart, a wedge pattern is forming, and breaking this pattern could add fresh momentum to EUR/USD.
Do you agree with my view?
Leave your comments below and don’t forget to like the post for extra luck!

EUR/USD Faces Strong Sell-off, Is a Deeper Correction Coming?The FX:EURUSD pair continued its sharp decline this morning, currently trading around 1.161, after breaking through the bullish wedge pattern on the daily chart. This key technical signal suggests that the previous uptrend has ended, opening the possibility for a deeper correction in the short term. The inability to hold the 1.171 resistance after two attempts further confirms the ongoing downtrend.
The selling pressure is driven by the strong recovery of the USD, as investors seek refuge in safe-haven assets amid concerns about global growth and geopolitical instability. Additionally, U.S. bond yields have rebounded following strong economic data, reducing the appeal of the euro. The expectation that the Fed will maintain high interest rates for a longer period also contributes to the downward pressure on EUR/USD.
In the short term, if EUR/USD fails to hold the 1.158 support, there is a high likelihood of a drop towards 1.140, a level that acted as strong support in the past. Traders should closely monitor signals from the Fed and the upcoming PMI data for the Eurozone to assess the next trend direction.

EURUSD SELL TARGET HITEurusd comepltes its target mapped on chart and 1:2 Risk Reward Ration is earned by me and my Community members

EURUSD SELL IDEA FOR DAY TRADINGHere We Could Sell On Trendling and Immediate resistance basis for EURUSD to gain 1:2 RR Ratio

EUR/USD Weakens Amid Trade Tensions and Fed OutlookThe EUR/USD pair continues to decline under the pressure of trade tensions and expectations surrounding the U.S. Federal Reserve's monetary policy. This week, the U.S. decision to impose new tariffs on certain products has heightened market uncertainty, weakening the euro and pushing the price lower.
On the other hand, the continued strength of the U.S. dollar, supported by solid economic data and expectations of a restrictive Fed policy, has worsened the decline of the European currency.
Technically, EUR/USD appears to be breaking through support levels, with the risk of further declines if the current trend continues.

EUR/USD Technical Breakdown – Bearish Structure Confirmed🔍 EUR/USD Technical Breakdown – Bearish Structure Confirmed
The EUR/USD pair has officially broken below a well-established ascending trendline that supported the bullish structure since early May. This technical break is a strong bearish signal, suggesting a potential shift in market sentiment as the pair loses upward momentum.
The pair is now trading around 1.16760, with sellers gaining control after failing to sustain above the 1.1700 region. The breakdown aligns with classic market structure principles, where a clean trendline violation often leads to a continuation move toward the next key support zone.
📍 Target Zone:
The identified downside target is around 1.1500, a critical demand zone that aligns with previous consolidation and potential liquidity pools. This area may act as a magnet for price before any significant reversal occurs.
📘 Trader's Insight:
This setup presents a clear example of a trendline break leading to a bearish continuation pattern. Professional traders may look for retests of the broken trendline for confirmation entries, or short-term rallies to add positions, while maintaining disciplined risk management.
✅ Technical Summary:
Structure: Bearish Breakout
Resistance: 1.1700
Support/Target: 1.1500
Bias: Bearish below trendline
