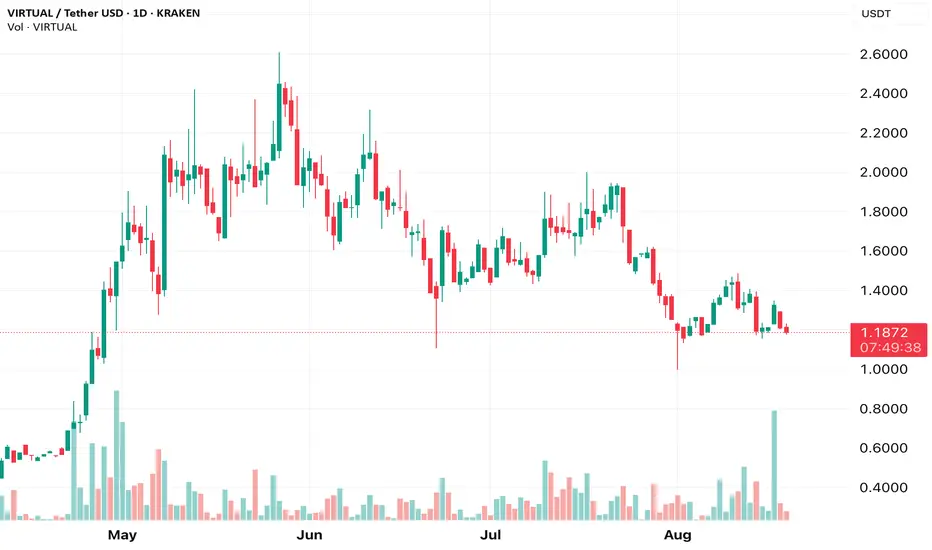
<VIRTUAL> – H1/H4/D1 Map | Key Levels, OI/Funding Context*Thesis (1–6 weeks):** Tactical map for . I use H1/H4 for execution, D1 for structure. Only trade when price + OI/funding confirm.
**Setup:**
– Structure: .
– Key support: , .
– Key resistance: , .
– Momentum trigger: H4 close > with rising volume.
**Derivatives checks (context, not signals):
VIRTUALDiscover your next crypto opportunity on TradingView. Our platform provides comprehensive charts, real-time market data, and powerful analytical tools for a vast array of cryptocurrencies. Explore a vibrant community of traders, share insights, and track coin performance with custom indicators and w

$VIRTUAL Gaining strength- hold above $1.30 could send it to $5$VIRTUAL/USDT: SPARKS:VIRTUAL is Gaining strength- hold above $1.30 could send it to $5+
Price is respecting the accumulation range between $1.30–$1.60 with multiple successful retests of the demand zone at the base.
🔹 Structure: Accumulation phase within a descending triangle
🔹 Support: Strong
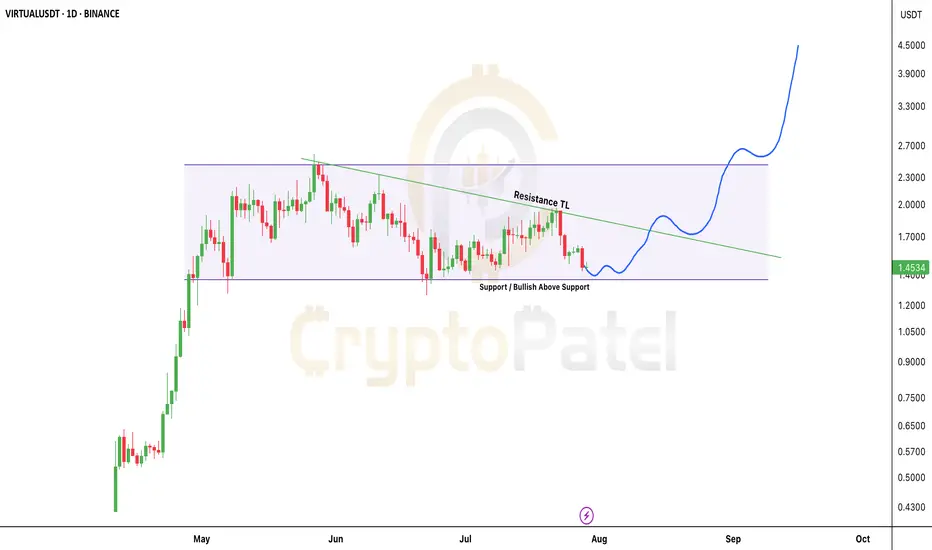
is $VIRTUAL about to fly to $8?Don’t ignore this setup – is SPARKS:VIRTUAL about to fly to $8?
Price action is currently displaying a bullish flag structure on the daily chart — a continuation pattern following a strong impulse leg.
🔸 Impulse Move (Flagpole): +335% vertical rally
🔸 Consolidation Phase: Descending parallel cha

VIRTUAL Long Setup – Watching Key Support with BTC CorrelationVIRTUAL is approaching a major support zone, with a potential long spot entry dependent on Bitcoin stability. We’ll be looking to enter around the $1.50 level, provided it holds as support.
📌 Trade Setup:
• Entry Zone: Conditional on $1.50 holding as support
• Take Profit Targets:
o 🥇 $2.15 – $2.6
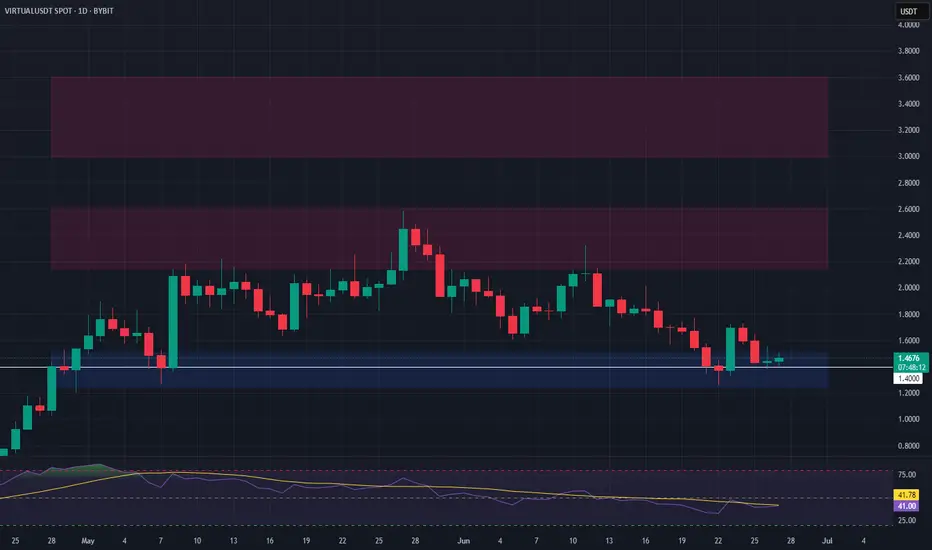
VIRTUALUSDT SHOWDOWN - SUPPORT TESTED, BREAKDOWN AHEAD?Symbol - VIRTUALUSDT
CMP - 1.6620
VIRTUALUSDT is currently consolidating within the context of a broader uptrend, forming a defined trading range. However, emerging technical signals within this range suggest the potential for a trend reversal and subsequent decline.
Bitcoin, meanwhile, appears t

See all ideas
Summarizing what the indicators are suggesting.
Oscillators
Neutral
SellBuy
Strong sellStrong buy
Strong sellSellNeutralBuyStrong buy
Oscillators
Neutral
SellBuy
Strong sellStrong buy
Strong sellSellNeutralBuyStrong buy
Summary
Neutral
SellBuy
Strong sellStrong buy
Strong sellSellNeutralBuyStrong buy
Summary
Neutral
SellBuy
Strong sellStrong buy
Strong sellSellNeutralBuyStrong buy
Summary
Neutral
SellBuy
Strong sellStrong buy
Strong sellSellNeutralBuyStrong buy
Moving Averages
Neutral
SellBuy
Strong sellStrong buy
Strong sellSellNeutralBuyStrong buy
Moving Averages
Neutral
SellBuy
Strong sellStrong buy
Strong sellSellNeutralBuyStrong buy
Displays a symbol's price movements over previous years to identify recurring trends.