NAS100 Preparing for Wave 3 Rally After Healthy PullbackThe NAS100 chart shows that a larger corrective move has likely finished at the (Y) / C low, after which price started a new upward impulsive structure. The recent decline looks like a normal Wave 2 pullback, which has already reacted from the 0.5–0.618 Fibonacci support zone, a common area for corr

Can expect a deep retracement in NQ till daily volume imbalance End of the year. The last week of volatile session, expecting a deep retracement to daily volume imbalance and bullish continuation

Nasdaq currently at avoid zome wait for fed event buy on dip Parameter Data Data
Asset Name Nasdaq 100 E-Mini Futures (NQ)
Last Traded Price (LTP) 🟡 25,780.75 (Reference: Dec 8, 2025)
Price Movement 🟢 Positive (+48.75 points / +0.19%)
Current Trade 🟡 Contraction/Range-Bound Active
SMC Structure 🟡 Indecisive/Compressing (Price consolidating between major Suppl
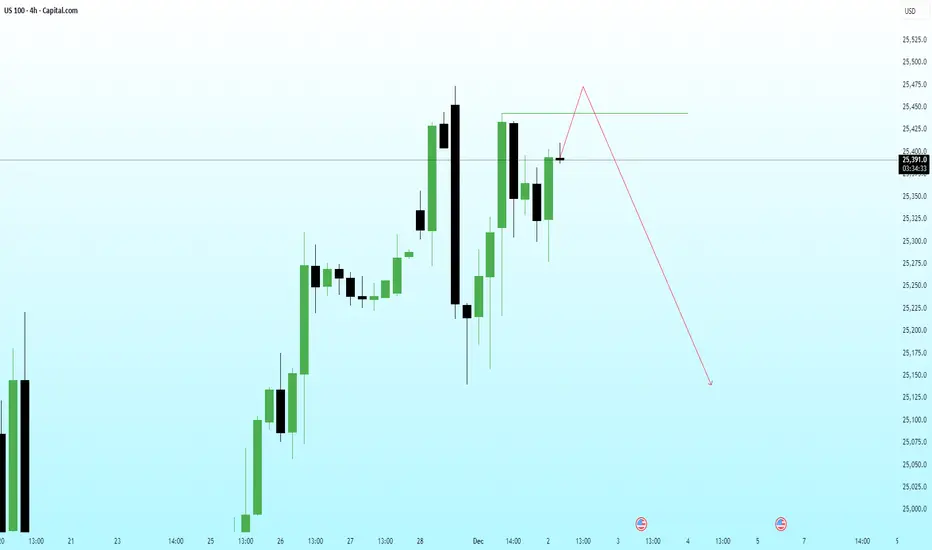
NAS100 – Anticipating a Liquidity Grab Before a Deeper CorrectioPrice is currently hovering just below the short-term resistance, displaying signs of exhaustion. I’m expecting one final push to sweep the liquidity sitting above the recent high (marked zone).
Once that engineered high is taken, a sharp reversal remains the highest-probability path—supported by h
Nasdaq 100 under pressureAfter the Nasdaq 100 fell by more than 3% in the week ending Friday 21 November, the index may extend those losses in the coming days. Recently, the Nasdaq 100 has been trading in a downtrend. Momentum has weakened, as indicated by the relative strength index (RSI), which formed a bearish divergence

Nasdaq Nasdaq is now scenario is sell buy trend change may take more then year let's wait and see let's share u r ideas

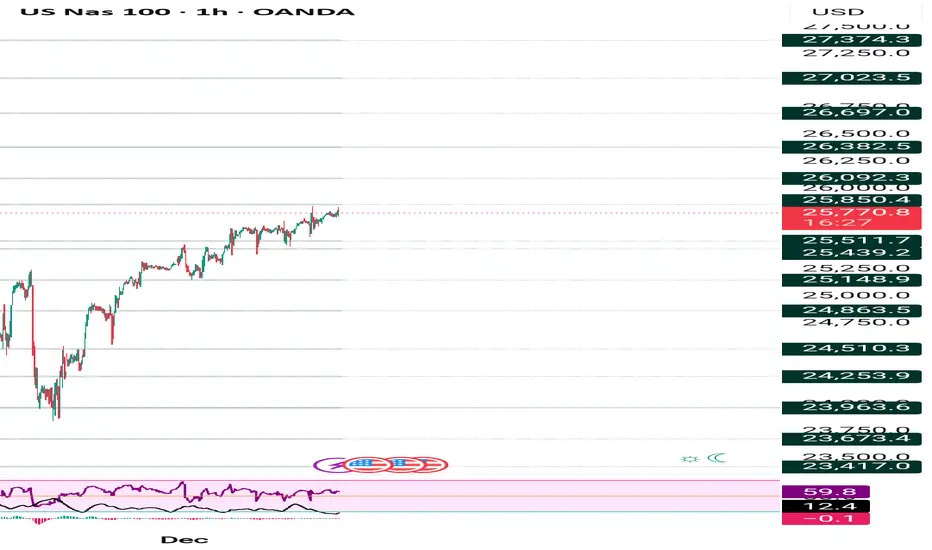
NAS100 Squeeze High on hourly Timeframe possible sharp fall downNAS100 is currently in a squeeze-high zone on the hourly timeframe, which often signals a potential sharp move down, especially with upcoming Fed news. This squeeze-high pattern typically represents an accumulation phase before smart money decides to make a significant move. In this case, it indicat

NASDAQ - Possible moves [Wave Theory]I'm not an expert of wave theory but I have an inclination towards it. Wave theory is nothing short of brilliance!
NASDAQ seem to have completed its 5 waves and now following the ABC retracement wave.
NASDAQ:NDX should now move to its B wave and show some bounce. It should be followed by furt

NASDAQ 100 : This is going to hurt Chart is self explanatory. Refer to marked S/R Zones
- Divergent RSI
- NNH (Net new highs) dropping fast
- Anticipatory shorts are riskier but can give a great entry.
Stop Loss - 25200 DCB

buybuy ideaPirce trend go up long term and short term last week 1h break structure pirce pull back go to 1h poi then buy

See all ideas
Displays a symbol's value movements over previous years to identify recurring trends.