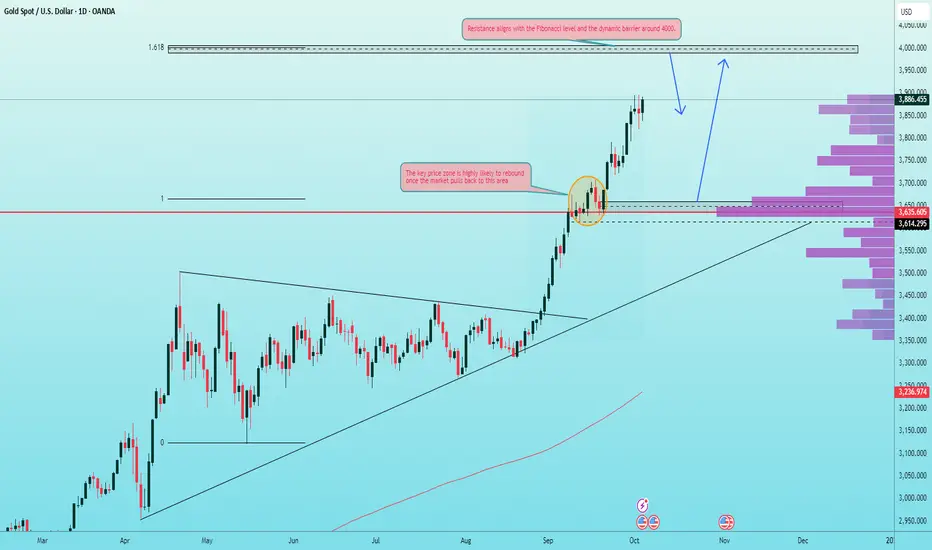
Gold Price Analysis — XAU/USD (Daily)Overview:
Gold has staged an impressive rally, climbing from the 3,200–3,300 area to the 3,870 region within a strong bullish structure. Price action shows higher highs and higher lows, signaling continued demand from buyers. 🚀
Technical Outlook:
• Trend: Both the medium- and long-term trends remain bullish, with price above the 50-day and 200-day moving averages.
• Momentum: Strong upward momentum confirmed by MACD histogram expansion and RSI hovering near overbought territory (~70).
• Key Levels:
⚠️ Resistance: ~3,900 (psychological & structural level).
✅ Support: 3,400–3,600 zone.
Trading Scenarios:
1️⃣ Bullish Continuation:
• Enter on pullbacks to support (3,600–3,700).
• Targets: 3,950–4,000.
• Use trailing stop to secure profits.
2️⃣ Rejection at Resistance (~3,900):
• Look for bearish candlestick patterns (pin bar, engulfing).
• Short-term correction toward 3,400–3,200.
• Stop-loss above 3,920 to manage risk.
3️⃣ Breakout Play:
• If price closes above 3,900 decisively with volume, expect continuation toward 4,100+.
• Ideal for breakout traders with risk managed via tight SL below breakout candle.
Risk Management:
⚠️ Do not risk more than 1–2% per trade.
✅ Use trailing stops to lock in gains.
💡 Accept losing trades early; capital preservation is priority.
Conclusion:
🎯 Bias remains bullish while above 3,600. Traders should monitor the 3,900 level closely — a breakout could extend the rally, while rejection could trigger a corrective pullback.
XAUUSD trade ideas

New ATH: Shutdown Fuels Gold's Seventh Straight WinHello, traders!
Gold just sealed its seventh consecutive weekly gain, boss, with futures hitting a whopping $3,908.9/oz. This rally is powered by growing tension over the US Government Shutdown and the solid expectation of a Fed rate cut (97% chance in October, no less!).
Fundamentals & Outlook: Pure Safe-Haven Rally
Political Instability: The prolonged Shutdown is a proper bullish driver now. It's delaying key economic reports, creating huge uncertainty, and attracting big safe-haven capital flows.
Rate Cut Certainty: The market is absolutely banking on a Fed rate cut, giving massive support to non-yielding Gold.
Technicals & Trading Strategy: Focus on $3867
The weekly buying power is super strong. Gold is holding steady near the $3900 mark. The $3867 level is our critical line, bhai; if the price stays above it, the potential for new ATHs remains very high.
Key Price Levels:
Resistance: $3902, $3912, $3922, $3942
Support: $3867, $3855, $3839, $3792
Trading Strategy (Absolute Risk Management):
BUY ZONE 1: $3867 - $3865
SL: $3857
TPs: $3875, $3885, $3895, $3905, $3915
BUY ZONE 2: $3839 - $3827
SL: $3824
TPs: $3847, $3857, $3867, $3877, $3887
SELL ZONE 1: $3902 - $3904
SL: $3912
TPs: $3894, $3884, $3874, $3864
SELL ZONE 2: $3942 - $3944
SL: $3952
TPs: $3934, $3924, $3914, $3904
What's your view? Will the US political drama help Gold finally break past $3900 next week? Tell me below! 👇
#Gold #XAUUSD #ATH #Shutdown #Fed #TradingView #MarketAnalysis #GoldRush

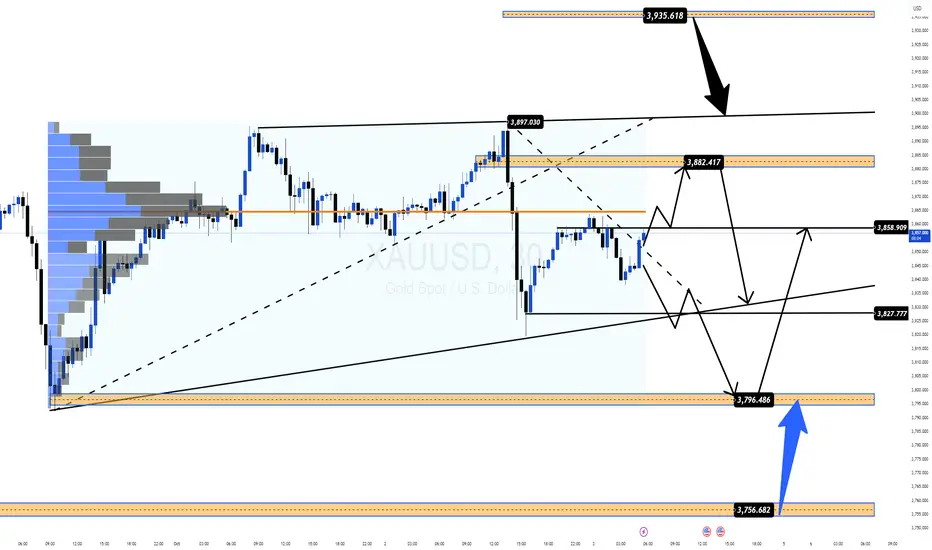
GOLD DAILY – MACRO VIEW FOR LONG-TERM GOLD
Hello everyone 👋
Today is the weekend, let's review the gold movements to gain insights for the upcoming trading week.
The weekly candle closed at 3,886.5 – a high level that most investors did not anticipate. The daily candle, almost fully bullish, has strongly reinforced the main bullish trend of gold in the medium and long term.
🔎 Technical View
Analyzing through Fibonacci extension, the next target for gold lies at the 4,000 mark, coinciding with the Fibo 1.618 level and a significant psychological resistance zone.
This is a confluence zone between technical and psychological factors, expected to have a strong reaction when the price approaches this area.
The current upward trend is almost unwavering, bolstered by macro factors – US political instability is causing uncertainty for the USD.
💡 Macro View
The US government shutdown is indefinite, economic data is delayed, causing market confusion.
The USD is weakening, while gold becomes a safe haven.
This scenario continues to reinforce the long-term upward trend of gold, especially as investors seek assets that preserve value.
⚖️ Long-term Scenarios and Strategies
1️⃣ Long-term Buy Scenario:
Entry: around 3,640 – 3,650
Reason: This is a strong support area on the Volume Profile chart, where large liquidity is concentrated.
When the price returns to this area, the pressure to take profits and release sell positions from trapped traders will create a strong price rebound effect.
This is the most potential buying zone in the medium term.
2️⃣ Short/Medium-term Reaction Sell Scenario:
Entry: around 4,000
Reason: This is a confluence resistance zone of technical (Fibo 1.618) and psychological (round number) factors.
Prioritize short-term reaction sells, capturing the pullback if gold hits the peak.
⚠️ Risk Management Note
Trading on larger time frames requires good capital and management skills, as the stop-loss range is higher compared to shorter frames.
Do not enter trades too early without confirmation signals from the price zone.
Always clearly define the time frame and profit expectations before entering a trade.
📈 Summary:
The long-term trend of gold remains upward, with a medium-term target towards $4,000.
Buying around 3,640 is an attractive price zone for accumulating long-term positions.
Sell reactions around 4,000 if there are clear reversal signals.
👉 If you want to follow daily updated scenarios, please follow me
Gold Outlook: Eyeing $4,000 – Fibo Expansion Zones in PlayGold continues to benefit from safe-haven demand as political risks in Washington and mixed U.S. data keep investors cautious. The metal is trading inside a clear bullish channel, with Fibonacci projections suggesting further upside before any major correction.
📊 Technical Deep Dive – H4 Structure
🔹 Fibonacci Confluence
The current rally respects 0.618 retracement at $3,820 and 0.786 retracement near $3,872, confirming algorithmic order flow.
Next expansion points are sitting at Fibo 1.5 – 1.618 ($3,995 – $4,003), a major liquidity target where reactions are likely.
🔹 Liquidity Pockets
$3,820 – $3,828: Historical demand block + Fibo 0.618, strong buy reaction zone.
$3,860 – $3,872: Active reaction layer, intraday support if retested.
$3,995 – $4,003: Key sell reaction zone, a liquidity grab area before possible retracement.
🔹 Candle & Flow
Breakout candles show strong momentum, pushing price toward untested liquidity.
However, multiple tests of $3,895 signal distribution pressure ahead of the $4,000 test.
🎯 Trade Playbook
🟢 Bullish Setup (Main Play)
Entry: $3,860 – $3,872
Targets: $3,895 → $3,995 → $4,003
Stop: Below $3,850
🔵 Deep Buy Setup (Aggressive)
Entry: $3,820 – $3,828
Targets: $3,872 → $3,895
Stop: Below $3,808
🔴 Countertrend Short (Scalp)
Entry: $3,995 – $4,003
Targets: $3,970 → $3,950
Stop: Above $4,010
⚡ Key Insights
Watch for a $4,000 liquidity sweep – could trigger either breakout continuation or sharp pullback.
If $3,860 support fails, deeper correction into $3,820 is expected before next rally.
H4 close above $3,895 strengthens bullish bias toward $4,003+.
📌 Question for traders: Will Gold break $4,000 and run, or is this a setup for a liquidity trap before correction? Share your view 👇

Daily Plan: Gold Targets 7th Straight Weekly Gain |MMFLOWTRADING📊 Market Context
Gold holds firm above $3,850, aiming for its 7th consecutive weekly gain.
🔥 Main driver: Risks from a prolonged U.S. government shutdown.
📉 54% probability of the shutdown lasting 29 days (Polymarket) → directly impacting gold sentiment.
🛡 Safe-haven demand & BUY-side FOMO keep fueling momentum.
⚖️ Still, profit-taking at higher resistance zones could trigger sharp swings before the next directional move.
🔎 Technical Analysis (H1/H4)
📈 Main trend: Bullish, but consolidating near 3,850.
🚧 Key Resistances: 3882–3884 & 3934–3936 (Liquidity Sell Zones).
🏦 Key Supports: 3797–3795 & 3756–3754 (Buy Zones).
🎯 Key Levels: 3850 – 3880 – 3900.
📈 Trading Scenarios & Plan
✅ SELL ZONE 1: 3882–3884
SL: 3890
TP: 3878 – 3874 – 3870 – 3865 – 3860 – 3850 – 3840 – ???
✅ SELL ZONE 2: 3934–3936
SL: 3940
TP: 3930 – 3925 – 3920 – 3910 – 3900 – ???
✅ BUY ZONE 1: 3797–3795
SL: 3790
TP: 3800 – 3810 – 3820 – 3830 – 3840 – ???
✅ BUY ZONE 2: 3756–3754
SL: 3750
TP: 3760 – 3770 – 3780 – 3790 – 3800 – ???
⚠️ Risk Management Notes
🌀 U.S. shutdown headlines may spark unexpected volatility.
🕵️♂️ Focus on BUY setups at support, avoid chasing FOMO at highs.
❌ Consider SELL only if clear rejection signals form at resistance zones.
✅ Summary
Gold remains supported by safe-haven flows, eyeing a 7-week winning streak.
🎯 Strategy:
BUY setups: 3797–3795 & 3756–3754.
SELL setups: 3882–3884 & 3934–3936.
📢 Follow MMFLOW TRADING for real-time updates & BIGWIN setups!
Cross-Market Arbitrage Opportunities1. Understanding Cross-Market Arbitrage
Arbitrage is the simultaneous buying and selling of an asset to profit from price differences in different markets or forms. Cross-market arbitrage occurs when an asset, security, or derivative is traded across two or more markets (such as stock exchanges, commodity markets, or currency markets), and a trader exploits the temporary price mismatch.
1.1 Basic Concept
Imagine a stock listed on two exchanges—say, Exchange A and Exchange B. If the stock trades at $100 on Exchange A but $102 on Exchange B, a trader could theoretically buy at $100 on Exchange A and sell at $102 on Exchange B, locking in a risk-free profit of $2 per share (ignoring transaction costs). This opportunity exists because markets are not perfectly efficient at all times. Cross-market arbitrage seeks to exploit such temporary inefficiencies.
1.2 Importance in Financial Markets
Cross-market arbitrage contributes to:
Market efficiency: By exploiting price differences, arbitrageurs help align prices across markets.
Liquidity enhancement: Arbitrage strategies increase trading activity and liquidity.
Risk management: Investors use cross-market arbitrage in hedging strategies to manage exposure to price fluctuations.
2. Types of Cross-Market Arbitrage
Cross-market arbitrage can be categorized based on the types of assets, markets, and instruments involved. Below are the most common types:
2.1 Stock Arbitrage Across Exchanges
Stocks listed on multiple exchanges often exhibit price discrepancies due to differences in trading hours, liquidity, and investor behavior.
Example: An Indian company’s stock listed both on the NSE (National Stock Exchange) and BSE (Bombay Stock Exchange). If NSE trades at ₹1,000 and BSE at ₹1,005, arbitrageurs can buy on NSE and sell on BSE simultaneously.
2.2 Currency Arbitrage
Foreign exchange markets provide cross-market opportunities when the same currency pair trades at slightly different rates in different markets.
Triangular arbitrage is a common method, where traders exploit discrepancies among three currencies in different forex markets.
Example: USD/INR trades at 83.50 in New York and 83.60 in London. Buying USD in New York and selling in London can yield a profit.
2.3 Commodity Arbitrage
Commodities like gold, oil, and agricultural products are often traded in multiple markets. Price differences can arise due to storage costs, transportation costs, and market demand.
Example: Gold trades at $1,900 per ounce on the London Bullion Market and $1,905 in Mumbai. Traders can buy in London and sell in Mumbai after accounting for transaction costs.
2.4 Derivative and Futures Arbitrage
Arbitrage opportunities exist between the spot market and the futures market or across derivative exchanges.
Cash-and-carry arbitrage is a common example where traders buy an underlying asset in the spot market and sell futures contracts if the futures price is overpriced relative to the spot price.
Reverse cash-and-carry occurs when futures are underpriced.
3. Mechanics of Cross-Market Arbitrage
To execute a cross-market arbitrage strategy, traders follow these steps:
3.1 Identify Price Discrepancies
The first step is to monitor multiple markets and identify assets trading at different prices. Sophisticated traders use algorithmic systems, real-time data feeds, and market scanners to detect these differences within milliseconds.
3.3 Simultaneous Execution
Cross-market arbitrage requires executing buy and sell orders almost simultaneously to avoid market risk (the risk of prices changing before both trades are completed). This is often achieved through:
High-frequency trading (HFT) algorithms
Direct market access (DMA) platforms
Automated trading bots
3.4 Risk Management
Even “risk-free” arbitrage carries risks such as:
Execution risk
Liquidity risk
Regulatory restrictions
Currency or settlement risk in international markets
Professional arbitrageurs hedge these risks using derivatives or diversification strategies.
4. Popular Cross-Market Arbitrage Strategies
4.1 Dual-Listed Stock Arbitrage
Concept: Exploit price differences in a stock listed on two exchanges.
Example: Infosys Ltd., dual-listed in India and the US as ADRs (American Depository Receipts). Traders can arbitrage price differences between NSE/BSE and NYSE markets.
4.2 Index Arbitrage
Concept: Exploit differences between a stock index and its futures contract.
Mechanism: If the futures price is higher than the fair value implied by the index, traders buy the index components and sell futures simultaneously.
4.3 Cross-Currency Arbitrage
Triangular arbitrage involves three currencies. For instance, if USD/INR, USD/EUR, and EUR/INR exchange rates are misaligned, traders can make a profit by converting currencies sequentially.
4.4 Commodity Arbitrage
Traders exploit price discrepancies in commodities across global exchanges, often factoring in shipping, storage, and hedging costs.
Example: Oil traded in NYMEX versus Brent crude in ICE Europe.
4.5 Derivative Arbitrage
Exploiting differences between options, futures, and underlying assets.
Example: Convertible bond arbitrage, where traders hedge the bond portion and speculate on the stock portion to lock profits.
5. Advantages of Cross-Market Arbitrage
Risk-Adjusted Returns: Offers relatively low-risk profits when executed correctly.
Market Efficiency: Aligns prices across markets, reducing mispricing.
Liquidity Generation: Arbitrage trading increases market depth.
Diversification: Arbitrage can diversify an investor’s portfolio by introducing trades that are market-neutral.
Predictability: Unlike directional trades, arbitrage profits rely on price discrepancies rather than market trends.
6. Challenges and Risks
Despite being considered “low-risk,” cross-market arbitrage has challenges:
6.1 Execution Risk
Delays in order execution can erase profits. Markets move quickly, so any lag can turn an arbitrage opportunity into a loss.
6.2 Transaction Costs
Trading fees, broker commissions, and taxes can reduce or nullify arbitrage gains.
6.3 Liquidity Risk
Insufficient market liquidity can prevent traders from executing trades at desired prices.
6.4 Regulatory Risk
Different countries have distinct trading rules and capital controls, especially for cross-border arbitrage.
6.5 Currency Risk
For international arbitrage, fluctuations in exchange rates can impact profits.
6.6 Competition
High-frequency trading firms and institutional players dominate cross-market arbitrage, making it less accessible for retail traders.
7. Future Trends
AI-Powered Arbitrage: AI models will identify patterns and predict mispricings with greater accuracy.
Blockchain and Cryptocurrencies: Cross-exchange crypto arbitrage is gaining traction due to high volatility and fragmented exchanges.
Global Market Integration: Increased connectivity may reduce arbitrage opportunities but also create short-lived micro-opportunities.
Retail Access: As technology becomes more accessible, retail investors may participate in smaller-scale arbitrage.
8. Conclusion
Cross-market arbitrage is a sophisticated, yet fundamentally simple, trading strategy that capitalizes on temporary price discrepancies across markets. It requires speed, precision, and careful risk management. While large institutional players dominate this space, technology is gradually enabling wider participation.
Arbitrage benefits markets by enhancing efficiency, improving liquidity, and contributing to price discovery. However, it is not without risks. Transaction costs, execution delays, and regulatory hurdles are significant challenges. Understanding the mechanics, types, and tools of cross-market arbitrage is essential for traders seeking to profit in an increasingly competitive global market.
Ultimately, successful cross-market arbitrage combines market insight, technological proficiency, and disciplined execution, making it a cornerstone strategy for risk-conscious investors in the 21st century.

Gold Trading Plan | Limited Downside, Key Fibo Zones in Play🌍 Market Context
Gold is facing renewed selling pressure after yesterday’s bounce from the $3,820 area.
Risk-on sentiment and fresh USD buying are weighing on XAU/USD.
However, expectations of Fed rate cuts later this year and geopolitical tensions remain supportive, limiting deeper downside moves.
📊 Technical Analysis – Fibo Matrix Setup
🔴 SELL Reaction Zones
386x – 388x (Fibo retracement 0.5 – 0.618 + 0.786 confluence)
→ Intraday SELL scalp zone with strong rejection probability.
3881 – 3892 (Fibo 1.5 – 1.618 downtrend extension)
→ Key SELL liquidity zone for deeper rejection.
🟢 BUY Support Zones
3820 – 3819 (short-term recovery base) → Initial intraday support.
3795 – 3793 (Fibo 1.5 – 1.618 recovery zone) → Major liquidity pocket, ideal for BUY setups if tested.
🎯 Trading Scenarios
1️⃣ SELL Setup
Entry: 386x – 388x (watch rejection candlesticks).
Target: 3820 → 3795.
Stop Loss: Above 3892.
2️⃣ BUY Setup
Entry: 3795 – 3793 with bullish confirmation.
Target: 3860 → 3880.
Stop Loss: Below 3785.
⚡ Key Notes
USD momentum is crucial – if dollar strength continues, Gold may retest 379x zones.
Fed’s rate cut outlook and geopolitical headlines remain the “floor” for Gold.
Stick to clear Fibo reaction zones for best risk-to-reward setups.
💬 Community Insight:
Do you expect Gold to hold 3820 before bouncing, or will we see a flush into 379x liquidity?
Drop your setups below 👇

XAUUSD – Prioritise Sell After Breaking Trendline
Hello Traders,
Gold has experienced a strong upward movement for several consecutive days, but currently, the market is showing significant reversal signals. The upward trendline on H4 has been broken, confirming the weakening buying momentum. In the medium term, the preferred scenario will be selling rather than continuing to chase buys.
Basic Context
The US Treasury has just repurchased an additional 2 billion USD in bonds, raising the total repurchase this week to 4.9 billion USD. This move indicates an effort to stabilise the bond market but also reflects significant pressure on the USD and the US financial situation.
In the short term, the injection of additional bond liquidity makes gold's movement more unpredictable, and the trendline break at this time is an important warning signal.
Technical Perspective
Breaking the upward trendline → confirms a structural change.
MACD signals weakening, with buyers losing clear strength.
The 3865 – 3868 zone is a beautiful resistance retest point to Sell.
If the price falls deeply, the support zones around 3830 – 3810 – 3790 will be the next targets.
Today's Trading Scenario
Sell (main priority):
Entry: 3865 – 3868
SL: 3875
TP: 3855 – 3832 – 3810 – 3790
Buy Scalping (counter-trend – high risk):
Entry: 3803 – 3805
SL: 3795
TP: 3822 – 3835 – 3850
Conclusion
Gold has broken the trendline, prioritising Sell in the short and medium term.
News from the US bond market further emphasises the risk of instability, making counter-trend Buy moves suitable only for short-term Scalping.
Follow me for the earliest updates on scenarios as price paths change.

(XAU/USD) – Gold likely to touch $4,000/oz: Ideal buying levels?1. Market Structure & Trend Outlook
On the H1 chart, gold is sustaining its bullish structure with higher highs and higher lows.
After the BoS (Break of Structure), price retraced near 3,862 Buy Zone and bounced upward.
At present, price trades above EMA34 and EMA89, keeping bullish bias intact.
2. Important Levels
Buy Zone: 3,862 – 3,865. Acts as short-term support. Holding above strengthens the bullish case.
OB1: 3,806 – 3,810. Next support in case Buy Zone breaks.
OB2: 3,763 – 3,770. Deeper support, triggered only if market corrects heavily.
Sell Scalping Zone (Fibo): 3,912. A short-term resistance, profit booking expected.
Sell Zone / ATH: 3,933 – 3,935. Breakout here may lead to fresh record highs.
3. Trade Setups
Bullish Setup: Buy on retest of 3,862 – 3,865.
SL: Below 3,850.
TP1: 3,912.
TP2: 3,933 – 3,935.
Bearish Setup (Defensive): If below 3,860, expect test of 3,806 – 3,810.
If this fails, price may decline towards 3,763 – 3,770.
4. Conclusion
Trend remains positive on H1. Best strategy: Buy on dips near support, manage SLs carefully, and book partial profits near resistances. Sustaining above 3,933 may open doors for new highs.

Gold Record: Shutdown 'Blinds' the Fed Hello, traders!
Gold shows absolutely no sign of slowing down, closing the October 1st session at $3,866.66/oz, while futures contracts hit a record high of $3,897.50/oz. The precious metal has climbed nearly 50% year-to-date and just set its 39th record high this year!
Fundamental Analysis: Shutdown Risk Hits at the Worst Time
While government shutdowns usually have a minor impact, the timing of this one is critical:
Delayed Jobs Data: The crucial jobs report (scheduled for Oct 3rd) will be postponed. This uncertainty will leave the market and the Fed 'blind' regarding the economy's health just weeks before the next policy meeting, triggering strong demand for safe-haven assets (Gold).
Threat of Staff Cuts: President Trump threatened to use the shutdown to cut "a lot of" federal employees, escalating tensions beyond typical closures and increasing political instability.
Technical Analysis & Trading Strategy
Gold accelerated past the $387x region during the US session, confirming the upward momentum is still very strong. However, the market is prone to more "Stop Loss hunting" (liquidity sweeps). Continue to Prioritize Buy, but manage SL carefully due to wider price swings.
Resistance: $3887, $3895, $3904
Support: $3870, $3854, $3843
Suggested Trading Strategy (Absolute Risk Management):
BUY ZONE
Zone: $3870 - $3868 / SL: $3860
TP: $3878 - $3888 - $3898 - $3908
SELL ZONE (High Risk)
Zone: $3903 - $3905 / SL: $3913
TP: $3895 - $3885 - $3875
Gold is running on a foundation of fear. Do you think the $3900 mark will be breached this session? 👇
#Gold #XAUUSD #ATH #Fed #GovernmentShutdown #TradingView #FinancialMarkets #RecordHigh

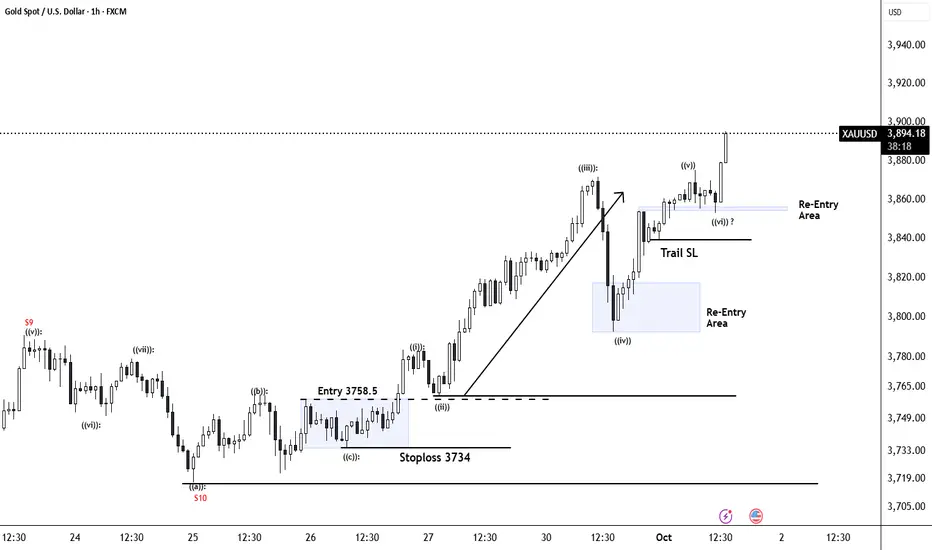
Buy gold time frame 15Good day everyone. My long position, which I expect to reach yesterday's high, is currently likely to form a bullish cup pattern. With a break of the 3880 level and a pullback to the same level, it could be a re-entry point. Be sure to observe risk management.

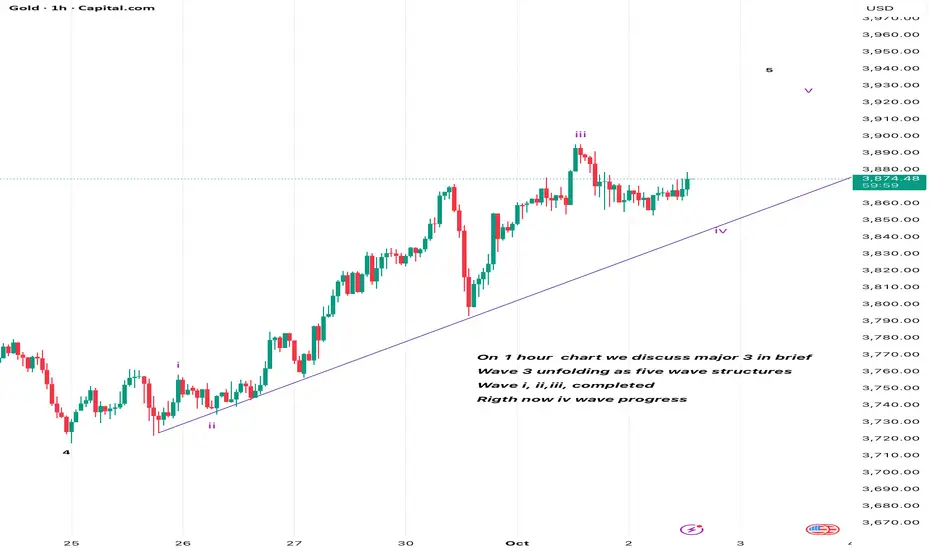
GoldOn 1 hour chart we discuss major 3 in brief
Wave 3 unfolding as five wave structures
Wave i, ii,iii, completed
Rigth now iv wave progress
Disclaimer : do research before before investing / do trade at your own risk
GoldOn Daily chart we discuss major (v) in brief Right
Wave (v) unfolding as five wave structures
Wave (1)and (2)completed
Rigth now (3) wave progress
Let’s discuss major (3) wave in brief on 4 hour time frame
Disclaimer : do research before investing / do trade at your own risk

GoldOn weekly chart we discuss major (3) wave in brief
Major (3) wave unfolding as (i) (ii) (iii) (iv) (v)
Wave (i) ,(ii) ,(iii) and (iv) wave completed as you can seen in the chart
Wave (iv) completed as triangle
Right now (v) running as five wave structures
Lets discuss wave (v) in brief in daily time frame
Disclaimer : do research before investing / do trade at your own risk

GoldMonthly chart
As per elliot wave analysis
Major (1) and (2) wave completed
Right now major (3) wave progress
Let’s discuss major (3) wave on weekly chart
Disclaimer : do research before investing /Do trade at your own risk

Gold 1H – Will Liquidity Above 3903 Fuel Reversal?Gold on the 1H timeframe is consolidating near 3,872 after multiple ChoCHs, with the next liquidity cluster resting above 3903–3901. Market structure shows engineered liquidity sweeps possible at premium supply, aligning with short-term sell opportunities. On the downside, a defined FVG buy zone and discount demand around 3832–3834 provide scope for continuation if tapped.
From the macro side, traders remain cautious ahead of upcoming U.S. economic data, while a resilient dollar and persistent geopolitical risks in energy markets continue to shape volatility. This backdrop supports tactical plays: fading rallies into premium supply while preparing to join the move from discount demand zones.
________________________________________
📌 Key Structure & Liquidity Zones (1H):
• 🔴 SELL GOLD 3903–3901 (SL 3910): Premium liquidity sweep zone. Downside targets at 3880 → 3860 → 3845.
• 🟢 BUY ZONE SUPPORT 3832–3834 (SL 3825): Discount demand aligned with FVG mitigation. Upside targets at 3855 → 3875 → 3890+.
________________________________________
📊 Trading Ideas (Scenario-Based):
🔻 Sell Setup – Liquidity Sweep at 3903–3901
• Entry: 3903–3901
• Stop Loss: 3910
• Take Profits:
• TP1: 3880
• TP2: 3860
• TP3: 3845
🔺 Buy Setup – FVG Mitigation at 3832–3834
• Entry: 3832–3834
• Stop Loss: 3825
• Take Profits:
• TP1: 3855
• TP2: 3875
• TP3: 3890+
________________________________________
🔑 Strategy Note
Gold remains range-bound but liquidity-driven. Expect engineered sweeps above 3903 before deeper corrections, while discounted dips into 3832–3834 offer potential continuation setups. Flexibility is key: fade rallies at premium, but scale into buys if liquidity clears into discount demand.

I'M LOOKING MORE UP SIDE 3933 GOLD As per 30 min Trend line gold
Breakout trend line & trading in rang once range complete
support near 3852
Resistance near 3872
3895
Target 3933🌿🌊

XAUUSD – Maintaining the Core Uptrend (BUY Bias)
Hello traders,
On the H4 timeframe, gold continues to show a steady upward trend. After testing the upper trendline, price bounced back and is now consolidating around the 386x region. This suggests the market may be in an accumulation phase, awaiting major news.
Fundamental Context
Tomorrow, the market will look towards the release of the Nonfarm Payrolls (NFP) data, an event that often brings strong volatility to gold prices.
In addition, concerns around the potential US Government shutdown are adding to the macro uncertainty, further supporting gold’s safe-haven appeal.
At present, there is little evidence to suggest gold will decline, particularly when other markets are also breaking higher.
Technical Analysis
Price continues to trade within the ascending channel on H4, with buyers holding the advantage.
MACD remains above the zero line, showing no clear signs of weakness.
Price is likely to consolidate further in the 3860 – 3870 range before a sharp move triggered by news.
Trading Plan
Buy Setup (preferred – trend following)
Entry: 3829 – 3832
SL: 3825
TP: 3845 – 3862 – 3877 – 3890
Sell Scalping (counter-trend, higher risk)
Entry: 3927 – 3930
SL: 3934
TP: 3915 – 3900 – 3882 – 3865
Note: Sell setups should be treated only as short-term scalps, as the primary bias remains on the buy side.
Conclusion
Gold is holding firmly within the uptrend structure, with no significant weakness yet. Given the backdrop of political uncertainty and the upcoming NFP release, the priority remains buying at suitable support zones. Any sell trades should be viewed as quick reactions rather than core positions.
👉 Follow me to get the latest updates as soon as price structure changes.

Gold Trading Strategy for 02nd October 2025📊 Gold Intraday Trading Plan
👉 Timeframe: 15-Minute Candle Strategy
🟢 Buy Setup (Long Trade)
✅ Condition: Enter only if a 15-min candle closes above ₹3878
🎯 Targets:
₹3889
₹3899
₹3905
🛑 Stop Loss: Place below the candle low that gave the breakout
💡 Explanation
Wait for a 15-minute candle to fully close above 3878.
Do not enter if the price just spikes above – wait for the close to confirm.
Once confirmed, buy with the targets mentioned.
🔴 Sell Setup (Short Trade)
✅ Condition: Enter only if a 15-min candle closes below ₹3853
🎯 Targets:
₹3842
₹3831
₹3823
🛑 Stop Loss: Place above the candle high that gave the breakdown
💡 Explanation
Wait for the candle to close below 3853 before selling.
Enter only after confirmation, not during the dip.
Keep stop loss strict to protect capital.
⚖️ Key Notes
⏳ Be patient — confirmation matters more than speed.
🛑 Always use stop loss — never trade without it.
📉 Risk only a small portion of your capital (1–2%).
Record your trades and review them daily.
⚠️ Disclaimer
This is educational information only and not financial advice. Trading in gold or any market involves risk of capital loss. Please consult your financial advisor before making any investment or trading decisions.

XAUUSD – Gold Smashes to New ATH: Bulls in Full Control📊 Market Overview
Gold has surged into uncharted territory, breaking through to a fresh All-Time High (ATH). The earlier dip toward 3,800 USD acted as nothing more than a springboard, allowing buyers to reload before launching this powerful breakout.
Safe-haven demand continues to fuel the rally, as concerns over a potential US government shutdown and expectations of more Fed rate cuts strengthen bullish momentum.
📍 Crucial Levels to Watch
🔴 SELL Reaction Zone
3,911 – 3,915 (Liquidity Resistance) → Potential short-term ceiling, profit-taking may appear here.
🟢 BUY Reaction Zones
3,830 – 3,820 (Fibo Support) → First pullback level for intraday buyers.
3,808 – 3,810 → Secondary support zone for a deeper correction.
3,747 – 3,752 (Liquidity BUY Zone) → Stronger base for swing buyers.
🎯 Trading Setups
1️⃣ Buy the Dip (Primary Play)
Entry: 3,830 – 3,820, confirmation needed.
Targets: 3,900 → 3,915, extend toward 3,950+ if momentum remains strong.
Stop: Below 3,808.
2️⃣ Sell the Spike (Countertrend)
Entry: 3,911 – 3,915, only on visible rejection.
Targets: 3,871 → 3,830.
Stop: Above 3,922.
3️⃣ Swing Buy Opportunity
Entry: 3,752 – 3,747 (Fibo confluence).
Targets: 3,830 → 3,900.
Stop: Below 3,735.
⚡ Pro Tips
Trend bias = Strongly Bullish, prioritize long setups.
Countertrend shorts are tactical; keep stops tight.
Headlines from the US political scene and Fed could trigger extra volatility at highs.
💬 Discussion
Will gold extend to 3,950 – 4,000 USD, or is a sharp pullback around the corner? Drop your views and charts below 👇

Gold |Power of Neowave AnalysisIf you have any doubts related to your stocks and portfolio, ask in the comments we will provide you Neowave Chart for that.
To understand my view Kindly watch the videos-
Video Analysis 01/10/2025
Video Analysis 30/09/2025
Video Analysis 29/09/2025
US Government Shutdown, Gold Benefits & FOMO BUY Continues📊 Market Context The gold market kicks off Q4/2025 with great enthusiasm as safe-haven flows continue to surge.
Not only that, the potential delay of the NFP employment report this week further fuels the market's "thirst" for directional information, positioning gold as the central asset in everyone's sights. Meanwhile, the USD is under pressure from political uncertainties and expectations that the Fed is moving closer to further rate cuts.
Combined, the current picture shows that gold is not only maintaining its strength after a breakout rally but also has the opportunity to expand and conquer new high price territories, as safe-haven capital and FOMO momentum from the BUY side continue to amplify.
🔎 Technical Analysis (H1/H4)
The price maintains the main upward trend, staying above the support structure.
Important BUY ZONE: 3833–3831 (Fibo + CP zone) – this area is likely to react strongly.
Secondary BUY ZONE: 3817–3815 (OBS zone) – stronger support, suitable for accumulating additional BUY orders.
Resistance area 3919–3923 (Liquidity Sell Zone) may be where liquidity traps appear.
✅ BUY ZONE 1: 3833–3831
SL: 3827
TP: 3838 - 3842 - 3846 - 3850 - 3855 - 3860 - 3870 - ???
✅ BUY ZONE 2: 3817–3815
SL: 3810
TP: 3822 - 3826 - 3830 - 3835 - 3840 - 3850 - 3860 - 3870 - ???
✅ Summary Gold is directly benefiting from political instability and the delay in US economic data. The main trend remains BUY with safe-haven flows, with strategic zones at 3833–3831 and 3817–3815. The expansion target aims for 3870–3880 and beyond to 3920+ if buying momentum remains strong.

Gold 1H – Correction or Continuation After Supply Test?Gold on the 1H timeframe is trading near 3,861 after consolidating below a premium supply zone at 3876–3874. Structure shows a recent BOS to the upside, but current rejection signals potential engineered liquidity sweeps into the nearby FVG and discount demand zones. The first support rests at 3796–3798, aligning with discount territory and previous accumulation, offering scope for continuation if price reacts positively.
From the macro side, today’s headlines point to persistent U.S. dollar strength as traders await fresh Federal Reserve guidance on inflation and rate path. Meanwhile, heightened geopolitical concerns in energy markets are maintaining safe-haven flows, adding volatility to gold’s intraday swings.
This dual backdrop sets up a tactical approach: fading rejections at supply while being prepared to enter on discounted dips at demand.
________________________________________
📌 Key Structure & Liquidity Zones (1H):
• 🔴 SELL GOLD 3876–3874 (SL 3883): Premium supply zone, downside targets at 3850 → 3835 → 3815.
• 🟢 BUY ZONE SUPPORT 3796–3798 (SL 3790): Discount demand zone aligned with BOS, upside targets at 3820 → 3845 → 3860+.
________________________________________
📊 Trading Ideas (Scenario-Based):
🔻 Sell Setup – Supply Rejection (3876–3874)
• Entry: 3876–3874
• Stop Loss: 3883
• Take Profits:
TP1: 3850
TP2: 3835
TP3: 3815
🔺 Buy Setup – Demand Mitigation (3796–3798)
• Entry: 3796–3798
• Stop Loss: 3790
• Take Profits:
TP1: 3820
TP2: 3845
TP3: 3860+
________________________________________
🔑 Strategy Note
Gold remains in a corrective phase after testing supply. Expect liquidity sweeps into discount levels before continuation. With the dollar strengthening and Fed commentary in focus, intraday traders should:
• Fade supply rejections at 3876–3874.
• Scale into buys around 3796–3798 if liquidity is cleared.
