PREDICTION OF GOLD IN THE WEEK AND NEXT WEEKGold price extended its uptrend for the second straight day on Wednesday and hit a three-week high of $2,390 after data revealed by the US Bureau of Labor Statistics showed inflation is ebbing, increasing the odds for a Federal Reserve rate cut in 2024.
XAUUSDG trade ideas

XauUsd : Support on Trend LineThe RSI being in the overbought zone likely contributed to the price not reaching the target.
Support on Trend Line: Despite not reaching the target, the price took support on a trend line. Trend lines are used to identify and confirm trends in price movements. If the price is taking support on a trend line, it suggests that the overall trend is still intact and the price is respecting this level.
Monitor RSI: Keep an eye on the RSI to see if it moves out of the overbought zone, which might provide more room for upward movement.
Watch Trend Line: Ensure the price continues to respect the trend line for confirmation of the trend.
Confirm Bullish Signal: Look for additional bullish signals or confirmation to validate the potential upward movement suggested by the bullish pin bar.

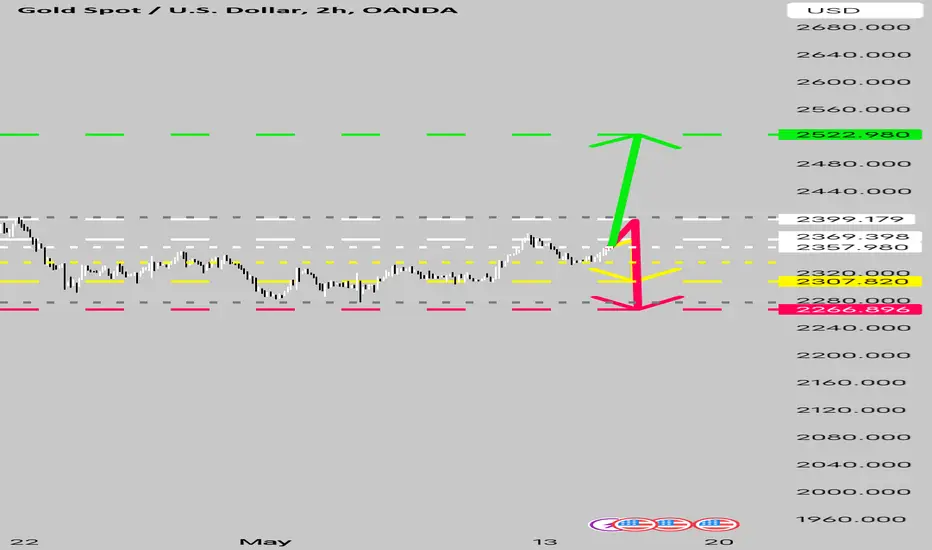
XAUUSD May 20, 2024 What is the target of this price increase?Hello everyone, DEEKOP is ready to bring the most accurate signals and assessments to everyone.
Financial freedom is true freedom.
Last week, the Russian president's visit to China will have two purposes: first, Russia and China create cooperation, which will make Russia's war in Ukraine continue to take place according to Russia's plan after the With China's support, the war in the Middle East and the factions supported by these two countries will gain more momentum. Second, these two countries are key members of the BRICS bloc. This visit will create momentum for the bloc to continue buying Gold to strengthen the bloc's common currency that is about to be released.
In addition, with last week's announcement of US economic indicators, we see a decrease in the number of applications for unemployment benefits in the context of a continuous decline in the labor market, and at the same time the CPI index is at a high level. This shows that the American people are gradually adapting to the current economic situation, which will create confidence for the Fed to at least keep interest rates high to restrain inflation.
So we see that the current volatile world situation is having a stronger impact on gold prices than the US economic index.
Looking at the H1 graph based on the Elliot wave principle, we see
- The price is at the end of wave 5. After measuring the target forecast for the end of wave 5, we have potential target areas that are 2444 and 2460.
- After wave 5 ends, we expect an ABC correction before continuing the uptrend
- The corrective wave target is expected to launch from the peaks of wave 5. We have 2 expected targets: area 2400 and area 2380. But according to the Elliot wave principle, corrective waves are often very complicated and take a long time.
Trading plan
In the Sell plan, we align the important price zones at 2444 and 2460
In our Buy plan, we watch the important price zones at 2400 and 2380
Scalping strategies are applied when the upper resistance - support area provides an entry signal.
Note: Sufficient TP, SL to be safe and win the market‼ ️Change data plan will be updated later.
Deekop's analysis is only a personal opinion with a desire to share its views with the community. I'm not always right. But my analysis always reflects my meticulous evaluation of what is best for an investment.

🔥GOLD ENTERS CORRECTION PHASE💲
Gold prices continued to rise strongly today, hitting a new record high and approaching the $2,450 mark. With the end of last week's double-negative adjustment, gold prices closed positive on the weekly chart, indicating that the upward trend is still strong.
On the 1-hour chart, gold prices are currently in an upward trend and have shown strong upward momentum after hitting a new record high. Prices are currently running above the short-term moving average, and the 5-hour and 20-hour moving averages are in a bullish arrangement, indicating strong buying power in the short term. On the 4-hour chart, gold prices are clearly in an upward channel, and the overall trend is upward. MA prices are running above the 50-hour and 200-hour moving averages, and the moving averages are in a bullish arrangement, indicating that the medium-term upward trend is still intact. RSI is currently above 70, showing an overbought state, indicating that there may be a short-term correction risk. The MACD line and the signal line remain in an upward divergent state, and the bar chart expands in the positive area, indicating that the bullish power continues in the medium term. The short-term support level is around 2428-2425. If it falls all the way, the space will increase, and it can be further seen to 2395-2400. The upper resistance level is 2445-2450. If it breaks through 2450 effectively, it may rise further.

xau/usd technical scalping trade analysissort area 2444
sl area 2447
tp 2425
in 15 min Mss occur ( Market structure Shift )

rejection tradeOANDA:XAUUSD
wait for the opportuinity don not rush..
let price make it for you.
wait for rejection from the gap..(FVG)

Gold Trend 20/05 - Expect a new round of buyingGold has started its rebound after a series of important U.S. economic data went worse than expected since the beginning of this month, and the US inflation data slowed further last week has accelerated the upward momentum. The price rose to a one-month high of 2422 on Friday, with the week ending near 2414. Note that the price of silver also broke through the 2020 high of US$30 on the same day, reflecting that the precious metals market is strengthening and the bullish trend should resume very soon.
1-hr chart - The upward trend accelerated last week from the support line (1) to (1.1). Gold cleared all the short-selling orders near the previous high of 2430 early in the Asian session on Monday reaching a new high of 2440. While the resistance of 2430(2) is cleared, a new round of buying should be triggered in the next 48 hours, and the target in the early part of this week can be set at 2450 or even higher. Notice, the key support is now at 2430. If the gold price returns below 2430, the current upward momentum will slow down, and the trend will reverse.
Daily Chart—Last Friday was the first time gold prices closed above 2400, showing that buying orders above 2400 are starting to dominate, the first signal for gold prices to break higher. Gold fluctuated by about US$150 during the consolidation period in the past month(3). The M-T target can be set near 2580(3), a 1:1: ratio. As long as the price stays above 2431 on the daily chart, the S-T target can be set at 2448.
P.To

GOLD CONTINUES TO INCREASETechnical analysis from TradingView highlights that gold recently touched $2,360 and even approached $2,380 before facing some resistance and correcting downwards. Despite this, the sentiment remains that a round bottom pattern may indicate potential growth in prices, with key levels being watched at around $2,365 and $2,379 (TradingView).
The ongoing developments and forecasts suggest that gold might continue to see bullish trends with key resistances and supports being tested. If you're actively trading or considering trading gold, watching these levels and the response to them could be crucial for understanding potential market movements this week.

20 MAY 2024 GOLD ANALYSISTechnical Analysis
Support and Resistance Levels:
Support Level at $2400: This level has proven to be a strong support as prices have rebounded after reaching this level. It indicates that there is significant buying interest at this price point.
Resistance Levels: As gold moves up, the next resistance levels to watch would be around $2450 and $2500. These are psychological levels and previous highs where selling pressure might appear.
Trend Analysis:
Short-Term Trend: The short-term trend shows a bounce from the support level, indicating potential for a bullish phase.
Medium to Long-Term Trend: If gold maintains its momentum above $2420 and breaks through the resistance at $2450, it could signal the beginning of a longer-term uptrend.

Gold 4hr4hr resistance area... So Sell SL maintain. Support resistance bass trading plan. Happy Trading. Thank you.

🔥Gold Trading Strategy for Next Week💲Based on the current market situation and technical analysis, the strategy for gold trend next week can be as follows:
1. Short strategy
Since gold has been strong recently and closed above $2414 on Friday, it may rebound to the $2420-2430 range after the opening next week. You can try to short in this range:
Opening range: $2420-2430
Stop loss position: set near $2435 , with a small stop loss point
Target position: short-term target can be set in the range of $2395-2397
2. Long strategy
Although the main strategy is short-selling, you can consider going long when the price falls back to the key support level:
Pullback range: if the price falls below $2390 , you can consider going long in the short term
Stop loss position: set near $ 2380 , with a small stop loss point
Target position: short-term target can be set in the range of $ 2405-2410
3. Position management
Light position opening: due to the strong market pattern, long-term shorting is recommended to be light to avoid excessive risks
Gradually increase position: if the price falls as expected, You can gradually increase your position to further reduce costs
4. Market sentiment and risk control
When market sentiment fluctuates greatly, you need to stay calm and not let short-term fluctuations affect your decision-making
Important economic data to be released next week (such as inflation and employment data in the United States) may have a significant impact on the trend of gold. If these data support the market's expectations of a Fed rate cut, gold may continue to rise. On the contrary, if the data exceeds expectations and suggests a strong economy, it may put pressure on gold and cause its price to fall back.
In summary, the short-term operation strategy for gold next week should be mainly short on rebound, supplemented by long on pullback, and adjusted according to market sentiment and key data.

XAUUSD week 3 May 2024 Is the uptrend over?Hello everyone, DEEKOP is ready to bring the most accurate signals and assessments to everyone.
Financial freedom is true freedom.
Last week, we saw that the US economy also sent remarkable messages. For the first time, the number of applications for unemployment benefits decreased despite the softening of the labor market, this shows that the American people are gradually adapting to the current controlled economy, plus the CPI released last week has increased beyond expectations, this will create motivation for the Fed to continue maintaining high interest rates in the near future
Although the US economic situation will still keep high interest rates to restrain inflation, this will create strength for the USD, but the current geopolitical fluctuations in the world will still create conditions for gold prices to increase and volatility to occur. The gold became a safe place for him to hide
Looking at the 1D chart, we rely on the Elliot wave principle to analyze price movements
- Last week we saw a strong price increase and currently the price is clinging to the peak of 2433.
- At this point, it is still early to conclude whether correction wave 4 has completed or not.
- We have the price level that confirms the completion of wave 4 and the start of wave 5 at 2433.
- If next week the price breaks out through 2433 then we have confirmation that wave 4 has completed and the price is in rising wave 5 then we will measure 2 expected price targets for the end of wave 5 which is the 2500 area. and area 2550
- If the price cannot break the 2433 zone and turns down, then the price is still in correction wave 4 and at a smaller wave level, the price will complete wave b and will continue to complete wave c as shown on the chart.
- Then wave b is confirmed when the price breaks out through the 2280 area, then we will have the target to end wave c measured at the price range 2455 and 2211
Above is Deekop's plan for next week and the daily plan will be updated by Deekop every day
Scalping strategies are applied when the upper resistance - support area provides an entry signal.
Note: Sufficient TP, SL to be safe and win the market‼ ️Change data plan will be updated later.
Deekop's analysis is only a personal opinion with a desire to share its views with the community. I'm not always right. But my analysis always reflects my meticulous evaluation of what is best for an investment.


XauUsd Bearish or BullishWhile the chart suggests a bullish outlook with a potential target of 2467 USD, the presence of a bearish pin bar on the closing 4-hour candle indicates caution. This pattern can lead to bearish movement or consolidation. Traders should watch for confirmation of the breakout and monitor key support and resistance levels to gauge the next move.

🔥GOLD HIGH SHORT SELLING💲
Gold retreated with a small negative line on the daily line, failing to continue the previous day's strong closing. After the Asian session inertia high, it fell under pressure and reached the highest level of $2,397. The rebound of the US dollar from a low level limited the upward momentum of gold in the short term. The daily line formed a small cross negative line and turned to a volatile trend. The unilateral strength was not strong in the short term. The second high exploration process was insufficient in sustainability. Today's weekly line closed higher and is expected to end with volatility.
The 4-hour chart shows that the support point of the rising trend line is $2,350, which is also the defense point of the bulls. The middle track support is around $2,373. The short-term 4-hour chart is in an upward trend, but the hourly chart lacks the momentum to break high, and the strong rebound of the US dollar has weakened the upward momentum of gold. It is expected that today's trend will tend to be slightly adjusted.
The key support levels are around $2,365 and $2,346, and the resistance levels are around $2,380 and $2,400. Breaking through these levels may support the continuation of the bull trend or suggest a possible pullback.
On the whole, , today's short-term gold operation advice is to focus on shorting on rebounds, supplemented by longs on callbacks. The short-term focus on the upper side is the 2382-2386 resistance range, and the short-term focus on the lower side is the 2350-235 support range.

Mix of Data : Gold to Show Significant Volatility.2400 is going to be the Ultimate Zone, that could be Decisive.
Above 2400, 2500+ could be tested..
Below 2400, 2300 2250 zones could be tested
XAUUSD 13/5 - 17/5Plan to trade XAU this week
Current trend is up. We will buy after break Pullback as screenshot
Buy when breakout 2345, stoploss 2335
If Up trend is breakdown, should Buy at 2280, No Short

TP HIT ON GOLD XAUUSDTP hit on gold . .you can see my last post on gold .I placed to BUY order AND trade active , which is a strong DEMAND ZONE.

xau/usd trade analysisif price brake through 2393 area and retest that zone one can open long position
long area 2372
tgt1 2397
tgt2 2406
sl area 2368

Gold stays bullish despite recent pullback, focus on $2,400 Gold price lacks clear directions after retreating from the highest level in a month while snapping a two-day winning streak. In doing so, the XAUUSD eased from a one-month-old horizontal resistance zone surrounding the $2,400 threshold. The pullback also gained strength from the US Dollar’s rebound. However, the bullion still carries an early-week breakout of a descending resistance line from April 12, now immediate support around $2,365. Additionally, keeping the buyers hopeful are the bullish MACD signals and the upbeat RSI (14) line. With this, the quote is likely to prevail on the bull’s radar and can gain more upside strength on crossing the $2,400 hurdle. In that case, the $2,418 and $2,431 will lure the bulls before directing them towards refreshing the all-time high by targeting the $2,500 threshold.
It’s worth noting that the Gold price weakness past the resistance-turned-support line of $2,365 won’t open the doors for the sellers as the 21-SMA and an upward-sloping trend line from mid-March, respectively near $2,336 and $2,318, will challenge the commodity’s south-run. Should the precious metal remain bearish past $2,318, the $2,300 round figure and the monthly low of nearly $2,277 will be the final defense of the buyers. Following that, the XAUUSD’s fall toward the late March swing high of $2,222 can’t be ruled out.

🔥Gold returns to slow bullish trend💲On the daily line, gold recorded a positive column, and the real column successfully crossed the short-period moving average and maintained above the moving average of each period. The overall Bollinger trend remains upward, although it has not yet fully opened its mouth. Observing from short-term indicators, the downward potential energy has shown signs of slowing down, and MACD also has the intention to form a golden cross. If it can be accompanied by an increase in trading volume, this may further increase the strength of multiple parties and prompt gold prices to rise again.
After the previous two days of adjustments, the effectiveness of the support around $2,330 has been basically confirmed. So far, the price of gold has risen steadily to above $2,360, showing a slow bullish upward trend. However, this slow rising trend is often not very strong. Once affected by negative factors, the price may retract very quickly. In the short term, the main resistance faced by gold prices is located at $2,378. If it can effectively break through this resistance, it is expected to further challenge the $2,400 mark.
On the whole, today's short-term gold operation advice is to focus on callbacks and shorts, with the upper short-term focus on the 2378-2380 resistance range and the lower short-term focus on the 2355-2360 support range.

XAU increased while US inflation cooledYesterday, lower-than-expected monthly CPI and Retail Sales data in the US supported the possibility of multiple interest rate cuts by the Fed in 2024. US CPI decelerated to 0.3% in April, lower than the expected level of 0.4%. While Retail Sales were flat, missing the expected increase of 0.4%.
The DXY index fluctuates around 104.20. The decline in US government bond yields is weakening the USD. US government bond yields for 2-year and 10-year terms were at 4.71% and 4.32 respectively after the data was published.
Cooling inflation will help the Fed soon make a decision to lower interest rates, to support the US economy, which is showing more signs of slowing down. Cooling inflation will also soothe the psychology of US investors and consumers.
Gold prices increased because tensions in Ukraine and the Middle East still show no signs of cooling down. Russia is attacking on many fronts in Ukraine and fierce fighting is occurring. Meanwhile, in the Middle East, Iran recently said it would create a nuclear bomb if threatened by Israel.

Neutral Bias towards GOLDIf the price of gold remains above 2361 since it is .618 level of the recent down move, it suggests a potential for a long position. Conversely, if it goes below 2357, a short position may be considered. These thresholds serve as critical points for traders to make informed decisions based on market movements and price dynamics. Adhering to these levels can help optimize trading strategies and capitalize on price fluctuations in the gold market.
