BTC FORMED BULLISH SHARK PATTERN Btc will move upwards till 29900 level again we can see downwards bleeding
#Bitcoin #nft #bnb #eth #btc #BSC #Binance #trading #altcoins #cryptocurrency #crypto
XBTUSDT.P trade ideas

Back to demand zone or some rally?Looks like a BTC will have a good risk reward trades on both sides, after crossing certain levels.
Long should be above current accumulation zone
Short should be once it crosses previous swing low.

BTC SYMMETRICAL TRIANGLE BREAKOUTBTC FROMED SYMMETRICAL TRIANGLE BREAKOUT SO IF IT MOVE UPWARDS CAN LEAD TO TOUCH 30400 to 32500 level.
If breakout down side can bleed till 27000 to 25300 area.
#Bitcoin #nft #bnb #eth #btc #BSC #Binance #trading #altcoins #cryptocurrency #crypto

rsi ma support and resistance macdRsi Ema support and resistance will indicate and macd will show the signal moving upwards or downwards it indicates whether the trade is in uptrend or downward


BTC FORMING SYMMETRICAL TRAINGLE The symmetrical triangle is a chart pattern commonly used in technical analysis that is formed when two trend lines converge towards each other at a roughly equal slope, indicating indecision among traders. It is often viewed as a continuation pattern, meaning that the price is likely to continue in the direction it was moving prior to the formation of the pattern. Traders use this pattern to identify potential breakout levels and to set stop-loss orders. Move can lead to touch 32500 level.
#bitcoinrevolution
#cryptochain
#etherealevolution
#bitcoincryptocurrency
#cryptoexchange
#etherchain
#bitcoininvestment
#cryptotrade
#ethereummining
#bitcoinacceptance

BTC - It s a sell right now.
Quite simply, BTC hit an important resistance (main trendline in dark red) daily RSI points to bearish divergence.
And a sale now. If it goes up a little more, I'll concider another beartrap.
Buys at HKEX:25 ,400 and HKEX:21 ,200 as macro structure remains bullish.
NOT A FINANCIAL ADVICE.

Btc further moves probabiltyBitcoin is holding key level of 30k
Above 30k is bullish and bearish scenario is below 25k

BTCUSDT Btc is 1hr TF creating acceding triangle pattern, in reverse chart , what you think guys will it break?

bitcoin in 1h timeframeyou see Bitcoin is stuck between two levels and can't break up or down but I suppose it doesn't have a strong candle, every time it tries to go up but defeat every time and take LH so I suppose Bitcoin breaks down the support zone and we could see Bitcoin in 25000 levels

bitcoin according to price action and chart analysysy
and smc cojncept btcusdt can go wup
i am jsut beginner don;t trade just watch
Enjoy

BTC forming bear flag The price of Bitcoin is showing signs of forming a bearish flag pattern, which could indicate a potential price decline in the near future. A flag pattern is a technical analysis chart pattern that looks like a flag, formed by two parallel trend lines, where the flagpole is formed by an initial sharp move in price, whilst the flag is formed by a consolidation or a sideways movement in price following the initial price move. so we can expect correction till 25300 or 24300.
#Bitcoin #nft #bnb #eth #btc #BSC #Binance #trading #altcoins #cryptocurrency #crypto


Bitcoin TA : WHAT THE FUTURE HOLDS ?We are now seeing a retracement on #btc after striking the 50% fib level at price $31125 from last high to swing low on monthly.
The next move is #btc tumbling further to our respective demand zones. We have Identified two possible outcomes A & B.
Option A(Blue): Bitcoin will reach the 50% fib at 22,521 and if the level holds we could see a retracement back to highs and potential newer high of 36.6k level. Which marks major supply for #btc.
Option B(orange) : Bitcoin could see a steeper retracement towards the 61.8-78.6% golden ratio on the fib. The prices are 21k-18.9k and see a strong pullback to the supply zone of 36k.
Note: These are technical analysis based on probability and is not 100% accurate. Please do your own research before investing.

Falling Trendline breakout & Double bottom seen in BITCOINWe have seen falling trendline breakout and double bottom in bitcoin. MACD also indicating a bullish crossover All this is a indication of bullish reversal from this level. So if anyone wants to go long for some moment can go with current price 28036 and keep a stop loss at 27750 and go for target above 28300/28450/28600+.
Please follow strict stop loss.
If anyone likes my work please like,follow and comment.
Thankyou

BTC analysisWe recently closed below the 27500 zone's next support area 26500 zone if the price does not support this area we might see a downside till the 24600 zone.

"Bitcoin" a very important patternPublishing herewith my idea about Bitcoin using monthly time frame

prashantbtcusdt is make abreker block
dhsjkhkmncnc kjhfjhsjdfhkj jkfhjsdh fjfhkjhalkuekhfj jhfjshfd jhda f hkjfhajhkf

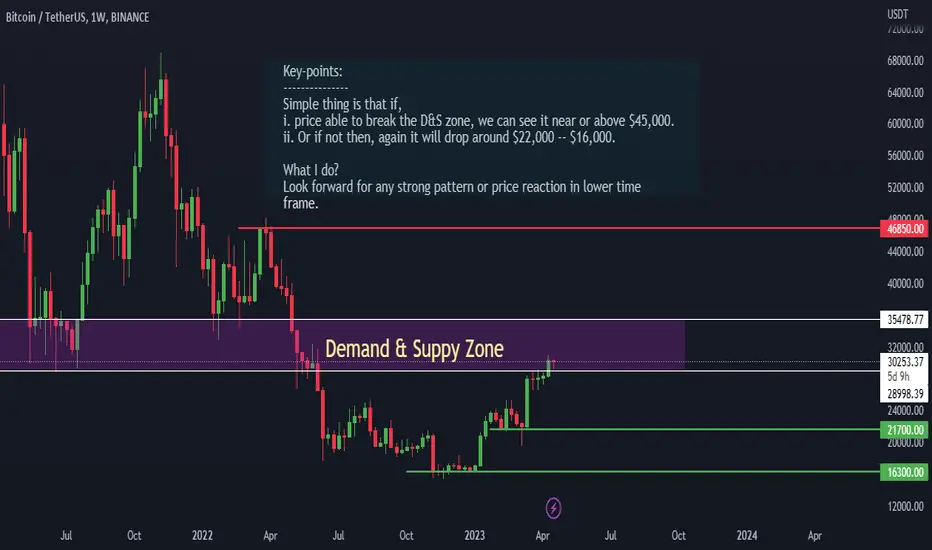
A Comprehensive Analysis of Bitcoin Future Price MovementAll the key points, aspects, and probabilities are clearly mentioned on the Chart. Kindly do your own research before entering.
THANK YOU
bitcoin needs to retest 29000-27000 level since the breakout of 25000 we have seen good bullish rally upto 30k+
price seems to make little consolidation and breaking above
30950 and 34500 will be very important level
this levels are likely to trend shift for short term
either it can be side way or pullback giving zone with divergence alert for "do not open new fresh longs"


btcusdtI have made efforts in explaining the concept in simple terms, as we can see chart explain everything all level is important my view is bearish. this is for only educational purpose

BTCUSDT 1DAYchart looks extreme bullish entry can be 30134 with target 31500 stoploss 30000, if break 30K than next support 28734
