#XLM Breaks The Inverted H&S Pattern#XLM Breaks the Inverse Head & Shoulder Pattern and It's Currently Retesting the Neckline. We May See A Massive Bullish Momentum From Here.
Disclaimer: This Is Not A Trade; This Is An Idea For A Trade. We won't bear Any Responsibility for any Profit or loss You Made. This Is Just For Analysis purposes
XLMUSDT.3S trade ideas
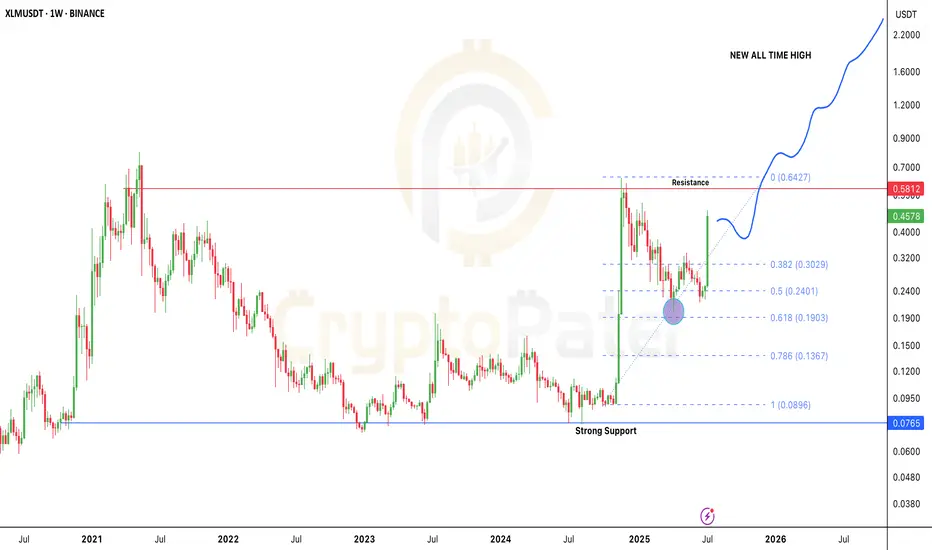
Stellar Breakout: Is $XLM the Next 10x Altcoin of 2025?After months of sideways action and accumulation, Stellar is finally showing real strength.
In the last 4 weeks alone, CRYPTOCAP:XLM has pumped over 120%, bouncing perfectly from the key 0.618 Fibonacci level near $0.19 — a classic reversal zone.
Here’s what’s really going on 👇
🔹 Back in Nov 2024, CRYPTOCAP:XLM went from $0.09 to $0.6374 in just 30 days — that’s a 600% move!
🔹 After that huge rally, price corrected nearly -68%, landing right at the golden Fib zone.
🔹 And guess what? Buyers stepped in hard, flipping the trend back to bullish.
Could we see a pullback?
Sure — maybe a small dip toward $0.30 (0.382 Fib). That’s normal. But the overall structure looks super bullish right now.
Major Resistance: $0.58
If that breaks and flips into support — we’re likely headed toward $2–$5 in the next wave.
This is one of the cleanest macro charts in the altcoin market right now.
👇 Drop your XLM target for this bull run in the comments!
Let’s see who’s aiming for the moon.
Note: DYOR & NFA
XLM 4H – Compression Breakout Setup in PlayCycle Analysis:
HWC: 🔼 Bullish
MWC: 🔽 Bearish
LWC: 🔽 Bearish
The mismatch between higher and lower cycles shows we're in a transitional phase — a potential pivot zone where the market is deciding whether to reverse or continue its correction.
Market Structure & Pattern:
XLM is forming a clear compression pattern (either a triangle or falling wedge) with the following traits:
Upper trendline has been tested multiple times
Buyers show more pressure than sellers
Breakout to the upside looks more probable, aligning with the HWC direction
Entry Strategy:
If you're looking to enter, wait for a confirmed breakout above the pattern, ideally with:
A full-bodied 4H candle closing above the upper trendline
Volume spike supporting the breakout
Retest and successful bounce on the 15-min timeframe
📍 Stop-loss: Below the last local low
🎯 Target 1: Top of the MWC structure
🎯 Target 2: Full cycle alignment with HWC, if momentum continues
⚠️ Final Note:
Since MWC and LWC are still bearish, any long entry should be managed with tight risk control. A failed breakout could lead to a sweep of the lower range, though less likely based on current price action.
📌 Got a coin you'd like analyzed? Drop it in the comments.
⚠️ Without proper risk management, you're just a ticking time bomb.
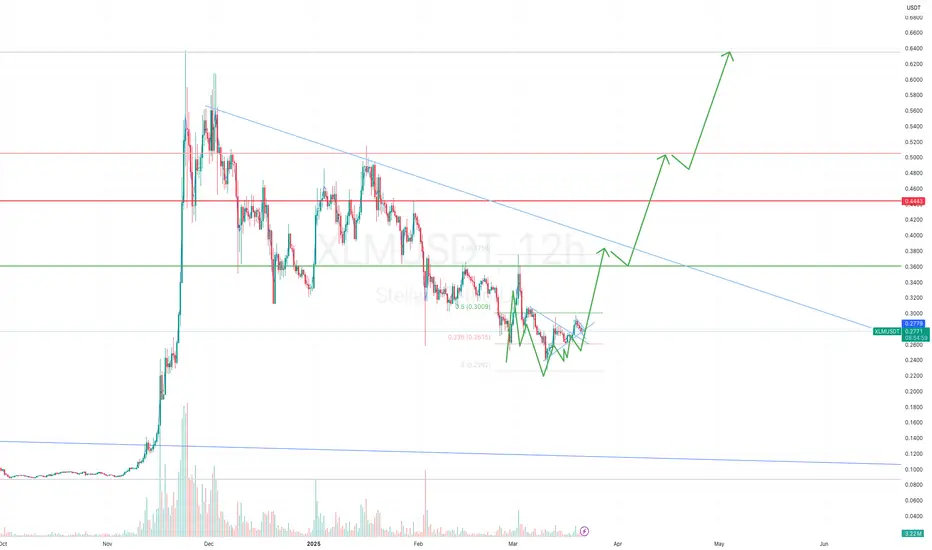
XLM super bullish pattern with base formationSolid price action formation in XLM token. 4h 12h daily TF looking super bullish with good base formation(accumulation). Breakouts must happens in smaller time frames to conquer the next levels. Target is like 50% 100% upside. Keep this coin in your watch list.
XLM Bullish ScenarioXLM seems to be following a bullish gartley pattern. Retracement of xlm is expected and might bounce at the 0.786 retracement. The stop loss is already provided.

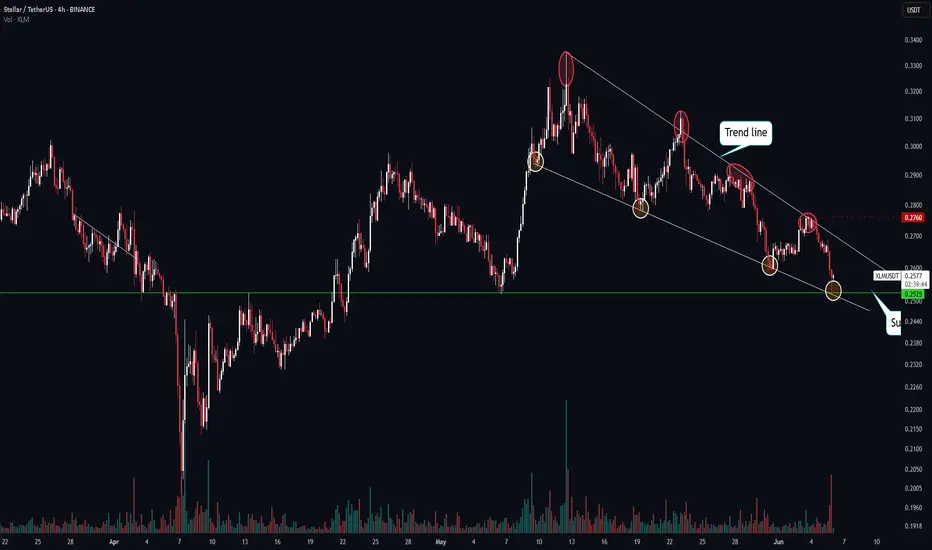
XLMUSDT - THE DOWNTREND MAY PERSISTSymbol - XLMUSDT
XLMUSDT is currently entering a correction phase following an attempt to establish an uptrend. The price is breaking key support levels due to a shift in market structure and the ongoing correction in Bitcoin. As Bitcoin undergoes a corrective phase, it is exerting additional pressure on the already fragile altcoin market. This bearish sentiment is partly fueled by the disappointment within the cryptocurrency community, stemming from the lack of mentions regarding cryptocurrencies in President Trump’s recent speech. The market is attempting to process this development as part of the broader corrective phase.
From a technical perspective, XLM is breaking through its ascending support within the broader descending channel, indicating continued bearish pressure.
Key support levels: 0.4175, 0.3895
Key resistance levels: 0.4600, 0.4955
Attention is focused on the previously breached channel boundary and the support level at 0.4177. The price may retest this broken channel boundary before potentially declining further. However, a sustained breakdown and consolidation below 0.4177 could trigger increased selling activity.

Good buying spot with proper IDMAs it has taken IDM, it is ready upside moment. And as xrp is moving it will also move up

XLM - From the legendary storyFrom the legendary story
XLM has completed the correction wave, and is accumulating wave 1 to make 3 jumps to conquer the new ATH at the $1.4 mark. This price target is easily broken by long waves in the near term. Famous for its stubbornness and slow growth, this will be a trading code that challenges many traders who lack patience with it.

XLMUSDT breaking out Flag Patter 5th WaveTechnical Analysis:
1. Backtesting within 7 days shows no clear patterns for MACD, RSI, BOLL, and KDJ indicators.
2. Backtesting within 30 days also does not show any clear patterns for MACD, RSI, BOLL, and KDJ indicators.
3. The current BOLL support price is $0.1201 and the resistance price is $0.1231.
Fundamental Analysis:
1. Stellar (XLM) is an open network that aims to facilitate the movement and storage of money.
2. The native token of the Stellar network is called lumens.
3. Stellar aims to boost financial inclusion and enable financial firms to connect with each other through blockchain technology.
4. The total token supply is 50,001,802,942 XLM, with a circulating supply of 23,404,278,684 XLM.
5. The current market cap of Stellar is $3,506,513,084.
6. The current price of XLM is $0.12226, with a 24-hour price change of +2.34% and a 7-day price change of +6.21%.
7. The trading volume for today is $3,232,809.16.
Market Sentiment:
1. The Market Sentiment Index is 82, indicating extreme greed.
Based on the technical analysis, there are no clear patterns indicating a specific trend for XLM within the past 7 days or 30 days. However, the current BOLL support and resistance prices can be used as reference levels.
Considering the fundamental analysis, Stellar aims to revolutionize the financial industry and enable cost-effective cross-border asset trading. The market sentiment is currently indicating extreme greed.
Please note that this analysis is based on the provided data and does not take into account any external factors or future events that may impact the price of XLM.
Risk Disclosure: Predictions are for reference only, not investment advice. Investing involves risks; please make decisions cautiously

XLMUSDT : SUPPORT ZONE 💰#XLM.USDT reached the Daily support zone again but bears are strong yet,we expect will dump more in future..📉
XLM/USDT- Potential Bounce Supported by Strong Confluence ?
In this XLM/USDT technical analysis, we'll explore the key factors supporting a potential bullish bounce for Stellar Lumens (XLM) against the US Dollar (USDT).
Buying/Support Area - 0.1300:
The XLM/USDT pair has established a robust buying/support area at the 0.1300 level. This level has historically acted as a foundation, limiting downside movement and indicating a strong demand zone for XLM.
Confluence with 200 EMA:
A significant element enhancing the bullish outlook is the presence of the 200 Exponential Moving Average (EMA) around the 0.1300 level. The 200 EMA is widely acknowledged as a key indicator of long-term trend strength.
Expecting a Price Bounce - 0.1500 to 0.1600:
Based on recent price action and technical analysis, there is a strong expectation of a price bounce for XLM/USDT. The price is likely to rebound within the range of 0.1500 to 0.1600.
Conclusion:
Technical analysis of the XLM/USDT pair indicates a compelling opportunity for traders to consider a bullish stance. The well-defined buying/support area at 0.1300, coupled with the expected price bounce range of 0.1500 to 0.1600, presents an attractive risk-reward scenario. The presence of the 200 EMA further reinforces the confluence, lending credibility to the projected price movement.
Remember that trading involves inherent risks, and past performance is not indicative of future results. Conduct thorough research and consider consulting with financial professionals before making trading decisions.

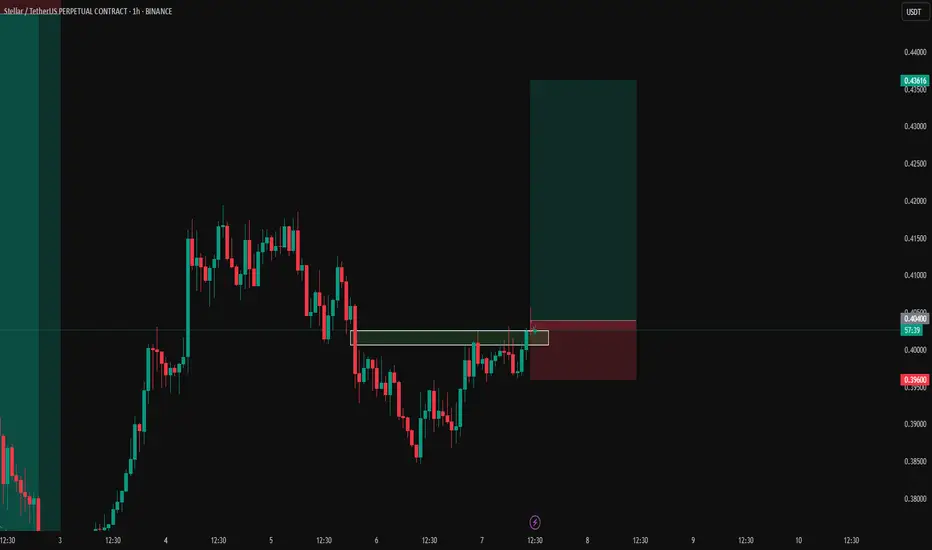
XLMUSDT Long Trade Setup!!Hello Everyone, If you are reading my chart for the first time then follow for more simplified charts on spot, margin, and futures.
Let's take a quick update on XLMUSDT. It looks like breaking out in 4Hr TF perfectly. Now, we can take a long entry on the retest for a short term trade but also we can accumulate for a long-term target. I am going long with this trade setup.
Long Entry:- 0.3840- 0.3740
Target 1:- 0.4336
Target 2:- 0.4790
Target 3:- 0.5350
Stop loss:- 0.3640
For the long-term trade, we can accumulate more near 0.3150 and targets would be 0.67 and 0.8.
Thanks!!
Please like and share, if you want to appreciate my work.

XlmThis Breakout Can Give You Minimum 5x Profit
Believe Me These Breakouts Are Life Changing Opportunities
Simply Wait For Breakout Buy After Breakout Hold For Few Weeks And Your Money Has Multiplied Get Easy Money

💡Don't miss the great buy opportunity in XLMUSD @StellarOrg
Trading suggestion:
". There is a possibility of temporary retracement to the suggested support line (0.1330).
. if so, traders can set orders based on Price Action and expect to reach short-term targets."
Technical analysis:
. XLMUSDT is in a range bound, and the beginning of an uptrend is expected.
. The price is above the 21-Day WEMA, which acts as a dynamic support.
. The RSI is at 55.
Take Profits:
TP1= @ 0.1511
TP2= @ 0.1610
TP3= @ 0.1707
TP4= @ 0.1861
TP5= @ 0.1991
SL= Break below S2
❤️ If you find this helpful and want more FREE forecasts in TradingView
. . . . . Please show your support back,
. . . . . . . . Hit the 👍 LIKE button,
. . . . . . . . . . Drop some feedback below in the comment!
❤️ Your support is very much 🙏 appreciated! ❤️
💎 Want us to help you become a better Forex / Crypto trader ?
Now, It's your turn !
Be sure to leave a comment; let us know how you see this opportunity and forecast.
Trade well, ❤️
ForecastCity English Support Team ❤️

💡Don't miss the great buy opportunity in XLMUSD @StellarOrgTrading suggestion:
". There is a possibility of temporary retracement to the suggested support line (0.1995).
. if so, traders can set orders based on Price Action and expect to reach short-term targets."
Technical analysis:
. XLMUSD is in a range bound, and the beginning of an uptrend is expected.
. The price is below the 21-Day WEMA, which acts as a dynamic resistance.
. The RSI is at 58.
Take Profits:
TP1= @ 0.2062
TP2= @ 0.2122
TP3= @ 0.2187
TP4= @ 0.2265
TP5= @ 0.2342
SL= Break below S2
❤️ If you find this helpful and want more FREE forecasts in TradingView
. . . . . Please show your support back,
. . . . . . . . Hit the 👍 LIKE button,
. . . . . . . . . . Drop some feedback below in the comment!
❤️ Your support is very much 🙏 appreciated!❤️
💎 Want us to help you become a better Forex / Crypto trader?
Now, It's your turn!
Be sure to leave a comment; let us know how you see this opportunity and forecast.
Trade well, ❤️
ForecastCity English Support Team ❤️

What a Chart!!!This is the daily chart of stellar, as you can see in the chart after a heavy consolidation near the support region stellar is near the trendline resistance any breakout above the marked trendline can take stellar to the moon..!!!!

Xlm 2h Idea @nevereasy805
please refer to the chart.
Gratify if you appreciate the practice then you can like it, share it and
If you want me to investigate any chart for you then would cherish doing that for you.
Thank you for your time and support.
Stay safe.

💡Don't miss the great buy opportunity in XLMUSD @StellarOrgTrading suggestion:
". There is a possibility of temporary retracement to the suggested support line (0.3453).
. if so, traders can set orders based on Price Action and expect to reach short-term targets."
Technical analysis:
. XLMUSD is in a range bound, and the beginning of an uptrend is expected.
. The price is above the 21-Day WEMA, which acts as a dynamic support.
. The RSI is at 69.
Take Profits:
TP1= @ 0.3686
TP2= @ 0.3926
TP3= @ 0.4175
TP4= @ 0.4409
TP5= @ 0.4672
SL= Break below S2
❤️ If you find this helpful and want more FREE forecasts in TradingView
. . . . . Please show your support back,
. . . . . . . . Hit the 👍 LIKE button,
. . . . . . . . . . Drop some feedback below in the comment!
❤️ Your support is very much 🙏 appreciated!❤️
💎 Want us to help you become a better Forex / Crypto trader?
Now, It's your turn!
Be sure to leave a comment; let us know how you see this opportunity and forecast.
Trade well, ❤️
ForecastCity English Support Team ❤️

XLMUSDT AT A VERY CRUCIAL LEVELSXLM looking to make new highs currently holding a long time support and can gave us a nice run


XLM/USDT 2 HOUR UPDATEWelcome to this quick Update, everyone.
If you are reading my updates for the first time do follow me to get more complex charts in a very simplified way.
I also post altcoin setups on Spot, Margin, and Futures .
I have tried my best to bring the best possible outcome in this chart .
XLM/USDT broke out of the triangle and currently retesting it .
Entry: $0.37706 to $0.38595
Targets:
$0.39228
$0.40054
$0.40825
$0.41655
Stop Loss: $0.35669
What's your thought on this?
Do hit the like button if you like this update and share your views in the comment section.
Thank you
#PEACE

💡Don't miss the great buy opportunity in XLMUSD @StellarOrgTrading suggestion:
". There is a possibility of temporary retracement to the suggested support line (0.3678).
. if so, traders can set orders based on Price Action and expect to reach short-term targets."
Technical analysis:
. XLMUSD is in an uptrend, and the continuation of the uptrend is expected.
. The price is above the 21-Day WEMA, which acts as a dynamic support.
. The RSI is at 42.
Take Profits:
TP1= @ 0.3808
TP2= @ 0.3938
TP3= @ 0.4211
TP4= @ 0.4500
TP5= @ 0.4710
SL= Break below S2
❤️ If you find this helpful and want more FREE forecasts in TradingView
. . . . . Please show your support back,
. . . . . . . . Hit the 👍 LIKE button,
. . . . . . . . . . Drop some feedback below in the comment!
❤️ Your support is very much 🙏 appreciated!❤️
💎 Want us to help you become a better Forex / Crypto trader?
Now, It's your turn!
Be sure to leave a comment; let us know how you see this opportunity and forecast.
Trade well, ❤️
ForecastCity English Support Team ❤️

XLM PRICE SOON 1$XLM is supporting trend line also a traiangles pattern breakout
price will go 1$soon
