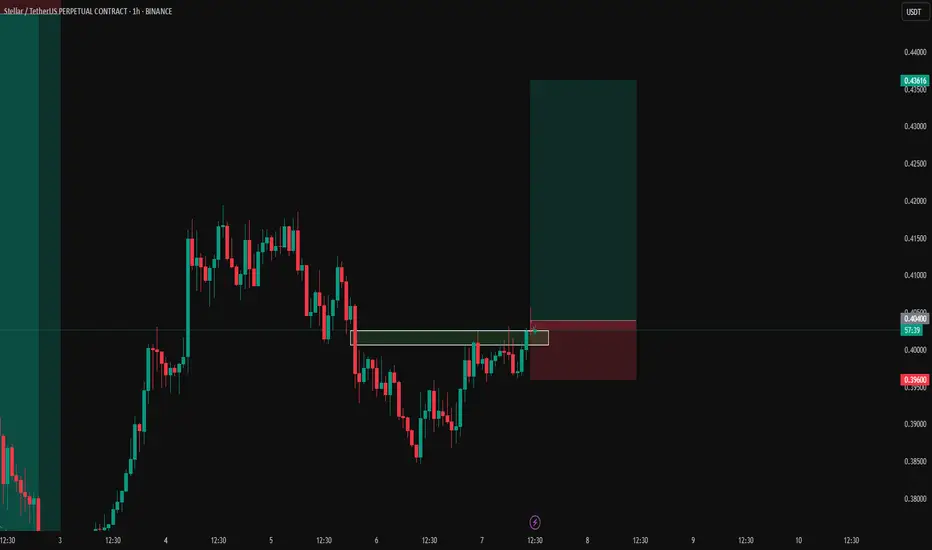
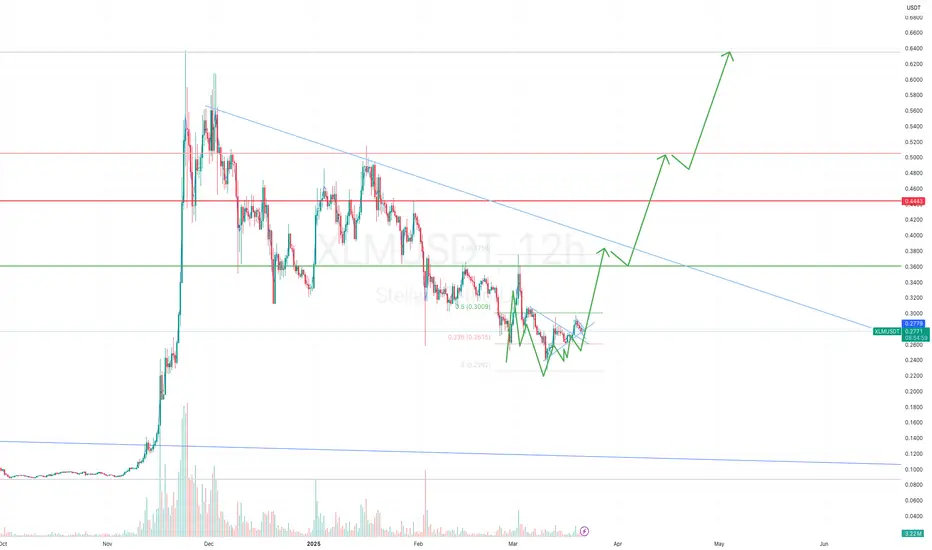
#XLM Breaks The Inverted H&S Pattern#XLM Breaks the Inverse Head & Shoulder Pattern and It's Currently Retesting the Neckline. We May See A Massive Bullish Momentum From Here.
Disclaimer: This Is Not A Trade; This Is An Idea For A Trade. We won't bear Any Responsibility for any Profit or loss You Made. This Is Just For Analysis purp
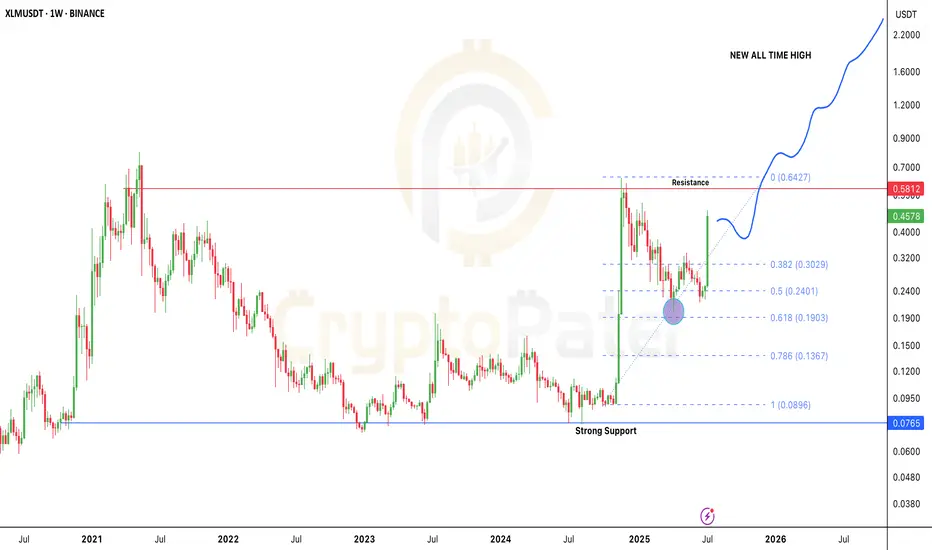
Stellar Breakout: Is $XLM the Next 10x Altcoin of 2025?After months of sideways action and accumulation, Stellar is finally showing real strength.
In the last 4 weeks alone, CRYPTOCAP:XLM has pumped over 120%, bouncing perfectly from the key 0.618 Fibonacci level near $0.19 — a classic reversal zone.
Here’s what’s really going on 👇
🔹 Back in Nov 2024
XLM 4H – Compression Breakout Setup in PlayCycle Analysis:
HWC: 🔼 Bullish
MWC: 🔽 Bearish
LWC: 🔽 Bearish
The mismatch between higher and lower cycles shows we're in a transitional phase — a potential pivot zone where the market is deciding whether to reverse or continue its correction.
Market Structure & Pattern:
XLM is forming a clear co
XLM super bullish pattern with base formationSolid price action formation in XLM token. 4h 12h daily TF looking super bullish with good base formation(accumulation). Breakouts must happens in smaller time frames to conquer the next levels. Target is like 50% 100% upside. Keep this coin in your watch list.
XLM Bullish ScenarioXLM seems to be following a bullish gartley pattern. Retracement of xlm is expected and might bounce at the 0.786 retracement. The stop loss is already provided.

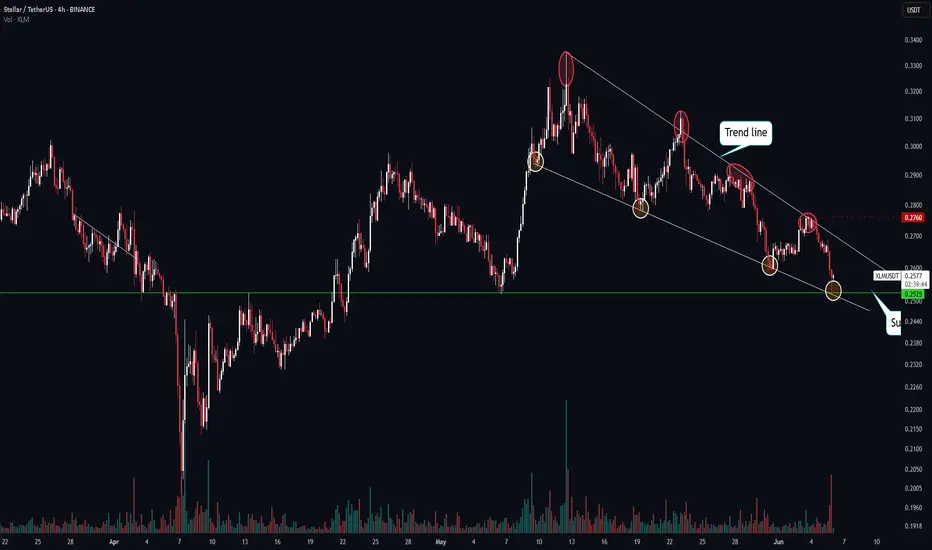
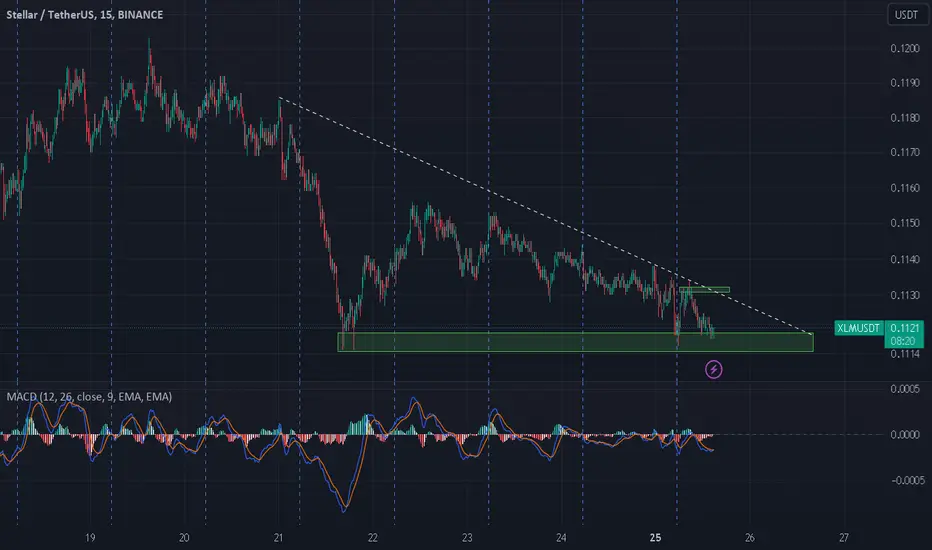
XLMUSDT - THE DOWNTREND MAY PERSISTSymbol - XLMUSDT
XLMUSDT is currently entering a correction phase following an attempt to establish an uptrend. The price is breaking key support levels due to a shift in market structure and the ongoing correction in Bitcoin. As Bitcoin undergoes a corrective phase, it is exerting additional press

Good buying spot with proper IDMAs it has taken IDM, it is ready upside moment. And as xrp is moving it will also move up

XLM - From the legendary storyFrom the legendary story
XLM has completed the correction wave, and is accumulating wave 1 to make 3 jumps to conquer the new ATH at the $1.4 mark. This price target is easily broken by long waves in the near term. Famous for its stubbornness and slow growth, this will be a trading code that challe

XLMUSDT breaking out Flag Patter 5th WaveTechnical Analysis:
1. Backtesting within 7 days shows no clear patterns for MACD, RSI, BOLL, and KDJ indicators.
2. Backtesting within 30 days also does not show any clear patterns for MACD, RSI, BOLL, and KDJ indicators.
3. The current BOLL support price is $0.1201 and the resistance price is $0.1

XLMUSDT : SUPPORT ZONE 💰#XLM.USDT reached the Daily support zone again but bears are strong yet,we expect will dump more in future..📉
See all ideas
Summarizing what the indicators are suggesting.
Oscillators
Neutral
SellBuy
Strong sellStrong buy
Strong sellSellNeutralBuyStrong buy
Oscillators
Neutral
SellBuy
Strong sellStrong buy
Strong sellSellNeutralBuyStrong buy
Summary
Neutral
SellBuy
Strong sellStrong buy
Strong sellSellNeutralBuyStrong buy
Summary
Neutral
SellBuy
Strong sellStrong buy
Strong sellSellNeutralBuyStrong buy
Summary
Neutral
SellBuy
Strong sellStrong buy
Strong sellSellNeutralBuyStrong buy
Moving Averages
Neutral
SellBuy
Strong sellStrong buy
Strong sellSellNeutralBuyStrong buy
Moving Averages
Neutral
SellBuy
Strong sellStrong buy
Strong sellSellNeutralBuyStrong buy
Displays a symbol's price movements over previous years to identify recurring trends.