2025.05.23 RIPPLE Short-term long positionWe are the SeoVereign Trading Team.
With sharp insight and precise analysis, we regularly share trading ideas on Bitcoin and other major assets—always guided by structure, sentiment, and momentum.
🔔 Follow us to never miss a market update.
📈
Currently, Ripple is analyzed to have completed its B wave around the $2.20 level in the mid- to short-term wave count. Accordingly, the upcoming movement is likely to be an upward C wave or the beginning of a new bullish wave.
Based on the technical structure and wave theory, the short-term targets are as follows:
1st Target: 2.49
2nd Target: 2.51
3rd Target: 2.55
In the short term, whether previous highs are broken and the strength of buying pressure are key indicators to watch. If the rise continues with increased trading volume, the above targets are likely to be valid.
📌 Strategy Summary:
Pullback buying strategy is valid with proper risk management
Key support level is around $2.20
Position adjustment to follow based on future main scenario updates
Strategy based on the mid-term main outlook will be provided sequentially.
Trade ideas

2025.05.18 RIPPLE Short-term long positionWe are the SeoVereign Trading Team.
With sharp insight and precise analysis, we regularly share trading ideas on Bitcoin and other major assets—always guided by structure, sentiment, and momentum.
🔔 Follow us to never miss a market update.
📈 Ripple (XRP) Long Position Strategy
Currently, XRP appears to have completed a 5-wave structure with an ending diagonal pattern in the final wave. Notably, Wave 3 respected the 1.272 extension of Wave 1 with precision, adding confidence to the Elliott Wave count. This setup typically suggests a trend exhaustion, followed by a potential move higher after a corrective phase.
✅ Entry Strategy
Enter long after confirmation of support in the current correction zone.
Stop-loss should be placed tightly below the invalidation level of the structure.
🎯 Target Levels
1st Target: $2.42 — Breakout above the diagonal resistance
2nd Target: $2.47 — Retest of previous high resistance
3rd Target: $2.51 — Potential completion of the extended move
🔍 Technical Notes
MACD is attempting a bullish crossover after forming higher lows
RSI is recovering after exiting the overbought zone
Volume is tightening, suggesting a strong move may follow on breakout

2025.05.15 RIPPLE [XRP] Short-term long positionWe are the SeoVereign Trading Team.
With sharp insight and precise analysis, we regularly share trading ideas on Bitcoin and other major assets—always guided by structure, sentiment, and momentum.
🔔 Follow us to never miss a market update.
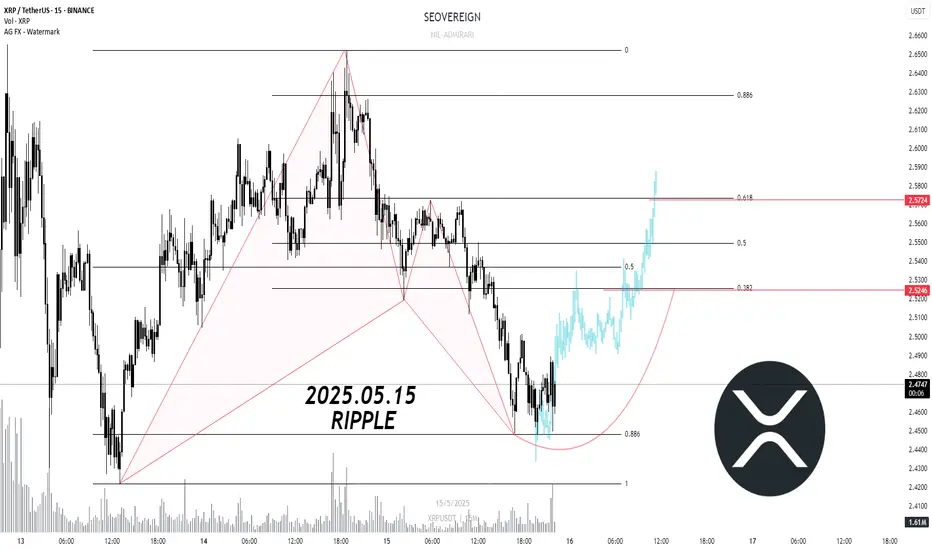
The bullish Bat pattern has been fully confirmed.
A short-term upward move is anticipated, so please consider this in your strategy.
1st Target: 2.52
2nd Target: 2.57
As always, remain flexible and responsive to evolving market conditions.
XRP Up 28% From Our Support Call – What’s Next?XRP Up 28% From Our Support Call – What’s Next?
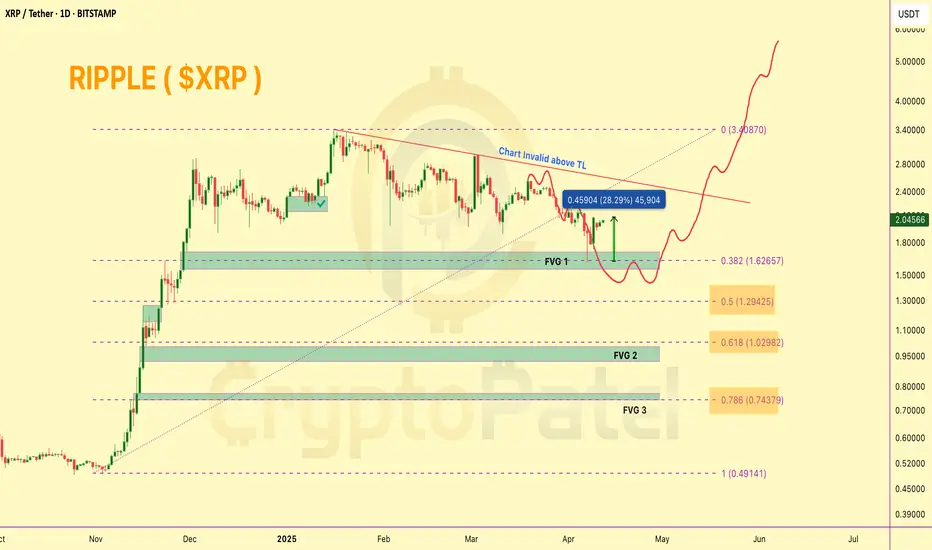
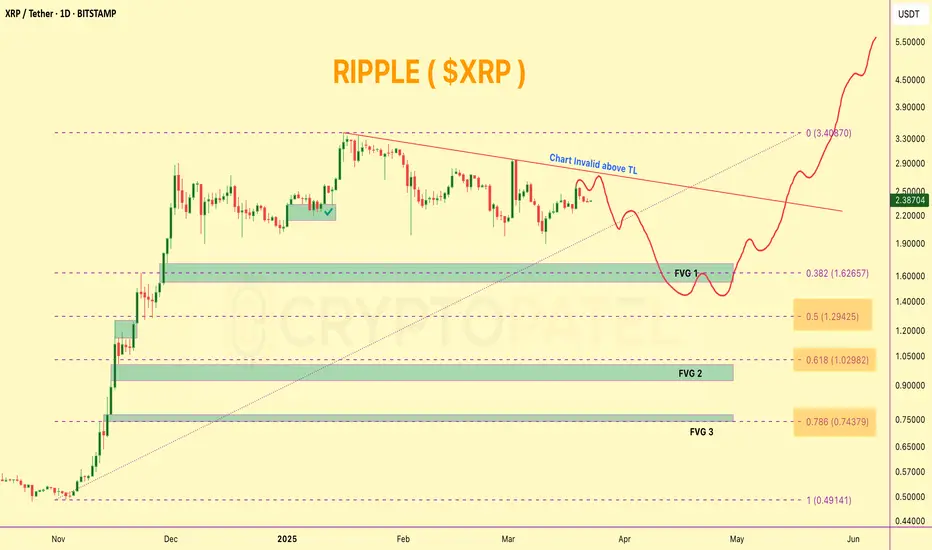
CRYPTOCAP:XRP perfectly respected the FVG 1 zone around $1.60, which we previously marked as a strong support. Since then, price has rebounded over 28% from that level.
Hope you didn’t get caught buying the $2.40–$2.50 zone — as warned, that area showed signs of exhaustion, and price has dropped 30% since.
What’s Next?
If bullish momentum continues, #XRP could revisit the $2.40–$2.50 resistance area. However, this zone may act as a rejection point once again.
From there, we could potentially see a pullback toward $1.30 and $1.00, which aligns with FVG support zones and the 0.5–0.618 Fib retracement levels — key areas where a strong bounce is likely.
🟢 Macro Bias: I remain bullish on XRP/USDT in this cycle and still expect a move toward $7–$10 in the broader bull market. Best entries will likely come during dips into major support zones.
❌ Invalidation Level: This chart setup gets invalidated on an HTF close above $2.50.
Keep it smart — entries on dips, not at tops. 👀
XRPUSDT - FACES PRESSURE - WILL SUPPORT HOLD OR BREAK?Symbol - XRPUSDT
CMP - 2.1850
XRPUSDT remains under pressure despite the release of relatively positive news. The asset, currently in a downtrend, continues to test a critical support level, with the likelihood of a breakdown increasing.
XRP is consistently testing a robust support zone on the weekly timeframe. In the medium term, two potential scenarios could unfold, contingent on the overall market sentiment. Should the current market conditions persist, the probability of a downside breakdown and further decline becomes significantly higher.
At present, attention is centered on the key support level at 2.0637, where retests are occurring. However, the response to these retests is progressively weaker, which raises the likelihood of a continued decline towards the 1.90 - 1.63 range.
Resistance levels: 2.2650, 2.3650, 2.5090
Support levels: 2.0637, 1.9000
The broader cryptocurrency market is facing challenging conditions, including the ongoing tariff war, high inflation, declining stock markets, and a sense of disillusionment within the crypto community due to unmet expectations. Until these macroeconomic factors show signs of improvement, the technical outlook for XRP remains negative, and further declines may occur after a brief correction.

XRP Technical Breakdown – 3 Key Gaps Identified!🚨 XRP Technical Breakdown – 3 Key Gaps Identified!
Hey fam! 👇
I just spotted 3 major GAPS on the CRYPTOCAP:XRP Daily Chart, and they could play a crucial role in XRP’s next big move!
Gap Zones to Watch:
1️⃣ GAP 1 – $1.712 to $1.546
2️⃣ GAP 2 – $1.00 to $0.9268
3️⃣ GAP 3 – $0.772 to $0.64
My Take (IMO):
✔️ In this current super bullish market, GAP 1 has a high probability of being filled before the next leg up toward $5+.
However, if we rely purely on Technical Analysis + Fibonacci levels, the chart indicates that GAP 2 & GAP 3 might need to be filled first before a sustainable upside.
Based on the Fib retracement, if CRYPTOCAP:XRP revisits the 0.618 - 0.786 zones, it could create a powerful reversal and bounce setup from there. That’s a key confluence level for long-term holders and swing traders.
High Liquidity Zones = Opportunity Zones!
All 3 GAPs align with areas of high liquidity – ideal for setting strategic buy orders if you're playing the safe accumulation game.
📢 What do you think?
Do you believe Ripple can drop below $1 again before a new ATH?
Let’s discuss – drop your TA in the comments 💬👇
XRP MAJOR BULL COMING#XRP has been trading in a tight range between 2.00 and 2.70 for the last 90 days, setting the stage for a potential breakout. The price is coiling, hinting at a big move if it breaches these boundaries.
A break above 2.70 could propel CRYPTOCAP:XRP to 3.30 or even 3.90. Conversely, slipping below 2.00 might push it down to 1.50 or 1.20. Keep an eye on those key levels!

$XRP Technical Analysis – Bullish Breakout Ahead?CRYPTOCAP:XRP Technical Analysis – Bullish Breakout Ahead? 🚀
📊 Pattern: Bull Flag forming on HTF
🟢 Key Support: $2 (Must hold for continuation)
🔴 Major Resistance: $3 (Breakout level)
#XRP has already surged 7x from our entry zone, signaling strong momentum. If price holds above $2, we could see a major pump, targeting $7-$10 in this bull run. However, breaking $3 resistance is crucial for further upside.
⚠ Risk Advisory: Given the massive rally, upside potential exists but risk is high. If entering now, consider small position sizing and always manage risk wisely.
DYOR – This is not financial advice. Always trade responsibly!

XRPUSDT - FORMING A BULLISH STRUCTURESymbol - XRPUSDT
CMP - 2.5500
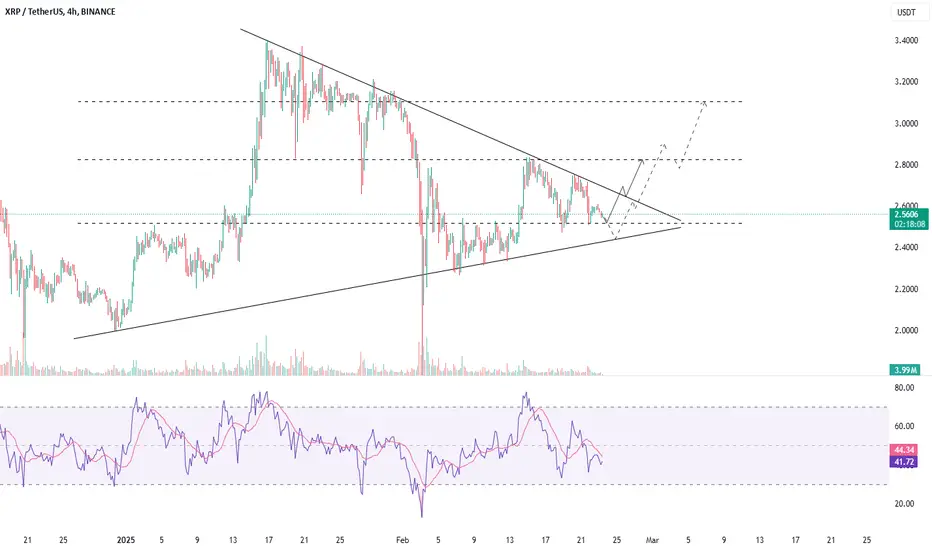
XRPUSDT has been exhibiting a range-bound behavior recently, currently trading within a symmetrical triangle formation, indicating potential for a breakout in either direction. This pattern suggests that there is a convergence of support and resistance, and the price could move decisively once it breaks out of this range. Price is also forming a support area, suggesting a strong foundation for a potential upward move, especially if key levels are breached.
While the symmetrical triangle is a typical continuation pattern, the direction of the breakout is still uncertain due to the consolidation phase. Both upward and downward movements are possible depending on how the price interacts with key levels in the near term. I am closely monitoring the price action at these levels, as it could provide the clues necessary to gauge the next potential move.
From a fundamental perspective, the XRP market has seen some buzz surrounding the potential approval of an XRP-based ETF. This rumor has stirred investor sentiment, making the $2.83 level an important threshold. A break and consolidation above this level could trigger a continuation of the upside, especially if positive developments around the ETF rumor materialize. This could act as a major catalyst for a rally, especially if the broader market conditions remain favorable.
Key Support levels: $2.51, $2.00
Key Resistance levels: $2.83, $3.10
If XRP manages to break and hold above $2.83, it could initiate an upward push towards higher resistance levels, potentially igniting a stronger bullish momentum. However, caution should be exercised as the price could first face a retest of support before making any significant movement.
On the other hand, we should also keep an eye on the $2.51 - $2.48 level. A break of this support level could indicate a shift towards a downward trend, sending the price to test lower supports. However, if the price holds above this level, it could form a rebound, giving bulls another chance to push the price higher.
On both the daily and weekly timeframes, the consolidation following the recent rally remains a positive sign, suggesting that the upward momentum could resume once the price breaks out of the symmetrical triangle. As we navigate this phase, both long and short setups are still valid, depending on how the price behaves in relation to these key levels.
In summary, the market is in a phase of consolidation with a potential for upside movement if key resistance levels are cleared, especially with the underlying ETF rumors providing additional bullish sentiment. On the flip side, any breach of support levels could signal a corrective phase.
Make or Break for XRPXRP Daily Chart
Investors' are being wary, weighing-in which key level will price target.
Key Resistance Level at $3 and Key Support Level at $2.
A breakout from $3 will easily sweep the 3.4 level and make a NATH possibly targeting the $4 zone whilst a breakdown from $2 will send price on the next zone around 1.40 to fill gaps and mitigate OB.
Massive liquidations but also massive order triggers which resulted on a price rebound. This puts a neutral sentiment on price which is why we see a sideways movement for now. A breakdown is more critical since all retailers whose orders got filled around $2 will surely be eyeing a breakeven if ever price will return to this zone leaving only a few buy orders on this area and a wide sell-off at breakeven.

XRPUSDT - CORRECTION WITHIN BULLISH TREND?Symbol - XRPUSDT
Yesterday evening, XRPUSDT retraced the previous decline but encountered significant resistance, which defines the upper boundary of the descending channel. This may lead to a potential correction. Following a notable upward movement, XRP is now entering a corrective phase, which is occurring within a descending channel or flag pattern. The nature of this pattern suggests a continuation of the prevailing trend, with the broader market trend remaining bullish.
From a technical perspective, a false breakout of resistance and a subsequent correction are plausible, with a potential pullback to the 3000 level before the market begins to develop the momentum for a breakout of the channel’s resistance, thus facilitating further upward movement.
Key support levels: 3000, 2900
Key resistance levels: 3145, 3200
The liquidity zone between 3145 and 3200 may initially prevent the price from breaking higher. In the short term, I anticipate a false breakout followed by a correction to the targets outlined in the chart.

XRP Bullish ContinuationXRP 4h
Price gave a huge discount to completely fill the fvg, would be ideal if it also hit the 1dOB but it is now up on the $3level looking to test the resistance again. After sweeping liquidities below, next target will be the upper side. A liquidity run up to $4 is looking good here.
RSi dips below the 30level and quickly recovers, currently on the 50level where a retracement usually occurs.
MACd is showing a reversal since the macd line(blue) crosses above the signal line(orange) without reaching the zero level of the histogram. Bearish momentum is also weakening.

Are you Ready to see Next XRP Bull Wave.XRP is all set for next bull wave to reach 4 dollar and possibly more then 4.5 price. If altscoim will get some kind of volume then XRP will Absolutely worth to watch.

XRP, Ready for bull runXRP has the potential to deliver strong returns in the coming days. Consider investing 10% of your funds in crypto, but remember the high volatility.
🚨 Do Your Own Research (DYOR)

XRPUSD-Bull BreakoutBullish Breakout expected due to prior trend and also wedge formation
Prior trend is Bullish
Formed wedge at the top
Successfully breakout of prior resistance at 1.9778 (12 April'21)
First target , i can expect 2.9160
Own views and personal note for checking performance

XRP longEither we bounce here or we bounce from the range lows (marked as RL). Will divide the position size in two for two entries. If we bounce here and stay strong above mid range then will add second entry there.

Another short scalpTaking this one as well. Think we retrace, till we stay lower than the previous high. Targeting a HTF FVG at 2.21.

XRP, pioneer of the first crypto wave. How's now?XRP, along with BTC and ETH, was one of the first assets I started to know the crypto market.
With his historical path, the foundation for the crypto development in the past 10 years, and pioneer in the fight with the SEC and Central institution. Ripple was born in 2012, followed by XRP Ledger, and it was the first decentralized blockchain to offer solutions and tools to developers.
XRP works with several languages such as Java and Phyton. If every crypto, to survive, must have a utilization purpose, Ripple’s one is to be the blockchain for business.
The ledger technology and the federal consensus mechanism, put ripple on the podium for the historic importance. It was the first crypto to propose a technology to integrate the fiat with the crypto, the CBDC.
But, why is Ripple still struggling to find a solid growth trend?
The 2021 spike coincides with the altcoin seasons, and for now, seems that Ripple will join the party even this time. With an increase of over 300%, ripple has come back into the altcoin landscape. But we have already seen that it grows as fast as it will drop.
My thoughts are that XRP is meant to be a translator between crypto and fiat, between decentralized and central banks. Its normal price channel is around 1$, which would make perfect sense, if it would not have one of the highest volatility, kept above 100%, nonetheless, its funding was more than ten years ago.
Is it a worthy investment? For its uniqueness and historic path, ripple is in my portfolio. So far yes.
It has respected the strategy and the last day's drop, did not turn the bullish curve. Perfect reaction to the trendline and it coincides with 0.382 in fibo weelky. Patternwise we are creating a M-shape, even if the general opinion is more oriented to a pennant shape. Anyways, it’s a bullish market for Ripple.
My TPs are $3.3550, $4.000, and $4,400 in this next alt season. But, what’s concerning me is that awful cup pattern forming in the past week. What does it mean? I don't know but, as long as its trend is respected, I am still bull on this asset. We wait for the reaction at the 618, @1.90. Just the historic higher high in the context.

Update on XRP scalp. TP hit.The scalp short played out. The market needed a cool off before further uptrend. I think with the upcoming CPI and FOMC (next week) we might see some accumulation in 90ks (Bitcoin).

XRP short scalpLower low on the m15. SL above a 2 hour FVG. The overall trend is still heavily bullish. But this could a proper scalp if need to fetch some liquidity to continue higher.

XRPUSDT 4H CRT MODELBuy XRPUSDT at Current Maket Price
All Take Profit Zones and SL are indicated in the chart above.
Use proper risk management.👌🏽

XRP easy targetsEasy targets visible in XRP and it can even go further to its ATH too. Keep an close eye on it.

XRP is ready for selling from its SE-OBXRPUSDT has formed a selling order block (1.2135 - 1549) and has broken its structure at the level of 1.1123 and it has also changed its character after breaking the levels of 1.0839 and 1.0136 and now it has sweeped out its liquidity at 1.1476, i had entered this trade at the level of 1.120 with stop loss above its selling order block at 1.2310 and i'm targeting the levels of 0.9190 and 0.7319 in upcoming days
