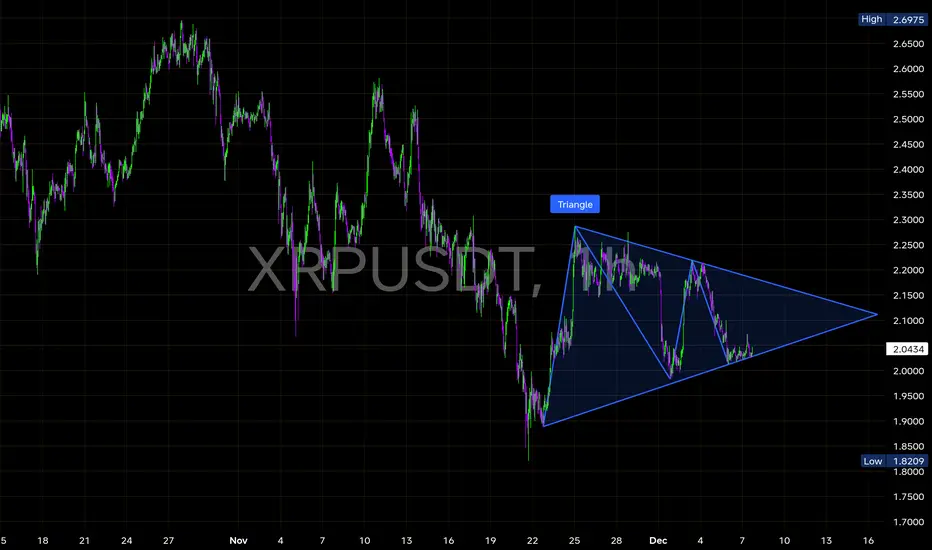
XRP is getting tighter in a big symmetrical triangleXRP is getting tighter in a big symmetrical triangle, bouncing between 2.04 support and the downward resistance line.This structure usually ends with a sharp breakout as volatility coils to its lowest point.
🔹Price is respecting the higher-low trendline, showing buyers still defending the structure.
🔹Each bounce is getting smaller → volatility is squeezing → breakout is nearing.
🔹Liquidity is building around 2.00–2.05, making this the key pivot zone.
📌 Levels to Watch
Support Zone: 2.00 – 1.98
Holding this keeps the triangle intact.
Resistance Zone: 2.18 – 2.22
A breakout above this triggers bullish continuation.
🎯 Breakout Scenarios
Bullish:
A clean breakout above 2.22 can push XRP toward:
→ 2.30
→ 2.45
Bearish:
Losing 1.98 opens downside liquidity toward:
→ 1.90
→ 1.82
CRYPTOCAP:XRP is now at the tightest point of the triangle — expect a decisive move soon. 🚀
Trade ideas
professional, price-action analysis of your XRP/USDT🔵 1. NO-TRADE ZONE
📍 2.018 – 2.088
(Your chart shows the dotted-line area + the nearest support & resistance)
Why this is a NO-TRADE Zone?
Price is in a sideways compression range.
Market is showing low momentum, lots of fake moves.
Best trades come after breakout + retest of this zone.
⚠️ Inside this area = avoid trading.
🟢 2. BUY SETUPS (LONG ENTRIES)
✅ BUY ENTRY 1 — Breakout Buy
Entry above: 2.088
Why buy here?
Breaks the consolidation range
Breaks previous lower-high structure
Strong bullish momentum triggers
SL: 2.018
TP1: 2.128
TP2: 2.166
TP3: 2.202
TP4: 2.248
TP5: 2.287
✅ BUY ENTRY 2 — Retest Buy (Safer)
Entry: Retest of 2.128 after breakout
Why?
Former resistance becomes support
Gives tight SL + clean trend continuation
SL: 2.088
TP1: 2.166
TP2: 2.202
TP3: 2.248
TP4: 2.287
🔴 3. SELL SETUPS (SHORT ENTRIES)
❗ SELL ENTRY 1 — Breakdown Sell
Entry below: 1.983
Why sell here?
Clear market structure break
Leaving the no-trade zone downward
Confirms lower-low continuation
SL: 2.018
TP1: 1.895
TP2: 1.860
TP3: 1.822
❗ SELL ENTRY 2 — Retest Sell
Entry: Retest of 1.983 from below
Why?
Broken support → new resistance
High-probability bearish continuation zone
SL: 2.018
TP1: 1.895
TP2: 1.860
TP3: 1.822
📌 4. WHY THESE LEVELS WORK
🟢 Buy Levels Because:
They break previous supply zones
They create higher highs
They align with price action continuation structure
🔴 Sell Levels Because:
They break demand zones
They confirm bearish trend continuation
Price will seek liquidity below recent lows
🛑 5. FINAL TRADING PLAN SUMMARY
NO TRADE
▪ 2.018 – 2.088
BUY ABOVE 2.088
SL → 2.018
TPs → 2.128 / 2.166 / 2.202 / 2.248 / 2.287
SELL BELOW 1.983
SL → 2.018
TPs → 1.895 / 1.860 / 1.822

XRPUSDT – 4H | Channel Rejection + Re-Test | High RR Long SetupXRP is respecting a long-term descending channel, and the recent price action shows a strong bullish reaction from the lower boundary of the channel. After sweeping liquidity at the lows, price has broken back above the inner trendline and is now retesting it as support.
🔍 Key Technical Points
Price bounced from the channel bottom, showing buyer strength.
Clear break and retest of the minor descending trendline.
Price holding above the retest zone (grey demand area).
Targeting the upper channel resistance + higher-timeframe supply zone.
Attractive Risk-to-Reward setup if the retest holds.
📈 Long Setup
Entry: Around 2.20 – 2.22
SL: Below 2.06 (structure invalidation)
TP: 2.65 – 2.70 zone
R:R: ~4.5R (High reward potential)
📌 Why I Like This Setup
This setup aligns with:
Trendline confluence
Demand zone reaction
Clear momentum shift
Liquidity grab at the lows
Room to move higher towards channel top
If bulls hold the retest, XRP could push toward the 2.65–2.70 target area.
⚠️ Disclaimer
This is only my personal analysis and not financial advice. Always trade with proper risk management.

XRP down 10% with 48 hoursCRYPTOCAP:XRP is down 10% on the inverse chart right after the first spot XRP ETF went live in the US
This is why I kept Saying Sell the News. Markets move before headlines.
Retail moves after. That gap is where most people lose money.
NFa & DYOR

Breaking: XRP ETF to Launch on Nasdaq TomorrowBreaking: XRP ETF to Launch on Nasdaq Tomorrow
Big news for the CRYPTOCAP:XRP community!
Canary Capital has officially filed to list the first-ever Spot #XRPETF on the Nasdaq, trading under the ticker XRPC. If all goes as expected, trading could begin tomorrow.
This ETF will let U.S. investors get direct exposure to XRP through a regulated investment product, just like Bitcoin and Ethereum ETFs.
Why this matters:
🔹 It opens the doors for institutional investors to enter XRP legally and easily.
🔹 It could bring huge liquidity and more attention to the XRP ecosystem.
🔹 If the launch goes smoothly, it may spark a strong bullish move not only for XRP but also for the broader altcoin market.
Possible outcomes:
🔹 Positive: XRP price pumps as new money flows in.
🔹 Neutral: Market already priced it in.
🔹 Negative: Any delay or SEC hurdle could cause a short-term dip.
Overall, this launch could be a major milestone for XRP and the crypto market beyond BTC and ETH.
Keep your eyes on the charts tomorrow, The market reaction could be big!
NFA & DYOR

$XRP — Triangle Pattern Tightening, Breakout Loading! CRYPTOCAP:XRP — Triangle Pattern Tightening, Breakout Loading!
#XRP is consolidating within a large symmetrical triangle on the 4H timeframe — a classic setup signaling an upcoming volatility spike.
After several swings between $3.10 (high) and $1.25 (low), price is now compressing near $2.39, just below the triangle’s upper boundary. The next move could define the short-term trend across the altcoin market.
🔸Resistance Zone: $2.55 → $2.65 (triangle upper trendline)
🔹Support Zone: $2.25 → $2.10 (triangle base support)
🔸Breakout Target (if bullish): $2.85 → $3.10
🔹Breakdown Target (if bearish): $1.90 → $1.60
CRYPTOCAP:XRP is coiling tightly within the triangle — a breakout or breakdown is imminent.
A strong close above $2.65 could trigger a rapid move to $3.0+, while a rejection below $2.25 could send it toward $1.9 or even $1.6.
📍 Key Levels to Watch:
Bullish Trigger: Close above $2.65
Bearish Trigger: Breakdown below $2.25
⚠️ Pro Tip: Wait for volume confirmation — triangles can produce fake breakouts before the true move.
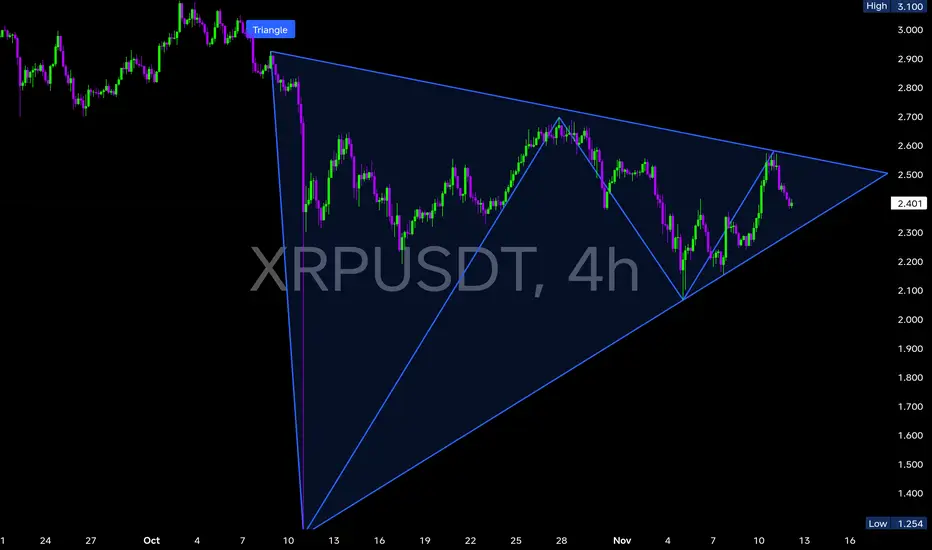
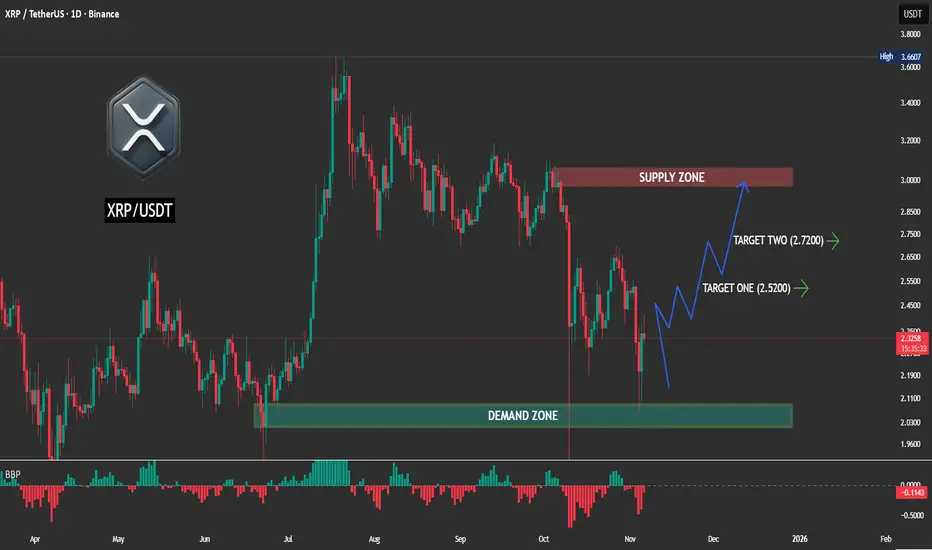
Chart Analysis: XRP / USDT (Daily Timeframe)Pattern: Demand Zone Rebound (Bullish Recovery Setup)
The chart shows XRP bouncing from a strong demand zone, signaling a potential short-term reversal after recent selling pressure. The price action suggests that buyers are gradually regaining control, with momentum shifting upward toward key resistance levels.
Key Observations
🔹 Demand Zone: Around $2.10 – $2.20, acting as strong accumulation support where buyers previously stepped in.
🔹 Immediate Resistance: Supply zone near $2.90 – $3.00, expected to be the next major barrier.
🔹 Targets:
🎯 Target 1: $2.52 — first resistance test after bounce.
🎯 Target 2: $2.72 — extension move toward supply zone.
🔹 Bull Bear Power (BBP): Currently improving from the negative region (-0.11), suggesting weakening bearish strength and a potential bullish transition.
🔹 Structure: Price forming higher lows after a deep retracement, indicating renewed accumulation and possible trend reversal setup.
Potential Move
If XRP sustains above $2.20, bullish momentum could drive a move toward the $2.50 – $2.70 range.
Failure to hold this demand zone, however, may trigger a retest toward $2.00 support.
Summary:
XRP is showing early signs of a bullish reversal from a major demand zone. Momentum indicators hint at a possible shift toward the upside, with targets near $2.52 and $2.72 if buyers maintain control.
#coinpediamarkets #XRP #Ripple #XRPUSDT #CryptoAnalysis #TechnicalAnalysis #CryptoTraders #CryptoMarket
XRPUSDT - EYEING A BREAKOUT ABOVE KEY RESISTANCESymbol - XRPUSDT
XRPUSDT is attempting to break through the upper boundary of its trading range amid a broader bullish recovery across the cryptocurrency market. A confirmed breakout may occur following a minor pullback.
The market continues to absorb the liquidation impact from last few days, with Bitcoin showing structural recovery, suggesting a potential resurgence of bullish sentiment. This development supports a more optimistic outlook for the overall crypto market.
XRPUSDT is currently testing resistance and entering a phase of consolidation. The key breakout trigger lies near 2.661 However, during consolidation, a retest of support levels remains possible as the market may seek liquidity before a potential upward continuation.
Resistance levels: 2.661, 2.739
Support levels: 2.587, 2.500
Since the start of the session, momentum has been notably strong, though a brief correction could materialize before the upward movement resumes. Within this corrective phase, XRPUSDT may retrace toward the 2.587 – 2.500 zone to gather liquidity before potential continuation.

[SeoVereign] RIPPLE BEARISH Outlook – October 27, 2025Hello everyone,
This idea presents a bearish (short) outlook on Ripple (XRP).
Currently, Ripple has reached a major resistance zone following a short-term upward movement,
and from a technical standpoint, a corrective phase is likely to occur.
Basis — BEARISH BAT PATTERN (Alternate Bat Pattern)
Structurally, Ripple has entered the PRZ (Potential Reversal Zone) of a Bearish BAT Pattern.
This zone coincides with a price range that has historically shown strong selling pressure,
and typically, a downward reversal tends to occur once the pattern is completed.
Accordingly, the average target price is set around 2.3 USDT.
This perspective is based on data as of October 27,
and further detailed updates will be provided depending on future price developments.
Thank you for reading.

XRP (Ripple) - Liquidity Taken! What's Next? | 3D Chart AnalysiAfter a deep liquidity sweep below the major $2.4–$2.5 demand zone, XRP has shown a sharp rejection and is attempting to reclaim structure above the breakdown level.
This could mark the beginning of a potential trend reversal if bulls manage to sustain above the zone and break past the descending trendline.
💎 Technical Outlook:
• 🔹 Structure: Retest of broken resistance turned support
• 🔹 Demand Zone: $2 tested and defended
• 🔹 Trendline Break: Price attempting to reclaim momentum above descending resistance
• 🔹 Targets:
• TP1 → $3.40
• TP2 → $3.66
• Extended → $4.80
• ❌ Invalidation: 3D close below $2
⸻
📈 Bias: Bullish reversal setup (confirmation needed on close above $2.8)
🕓 Timeframe: 6 to 9 months

$XRP ON THE EDGE OF SOMETHING BIGCRYPTOCAP:XRP ON THE EDGE OF SOMETHING BIG
XRP just broke out of a multi-year downtrend and is retesting major support at $2–$1.70.
Holding this zone keeps the bullish structure intact, a break above $3.30 could ignite a run toward $5 and even $10.
NFA & DYOR

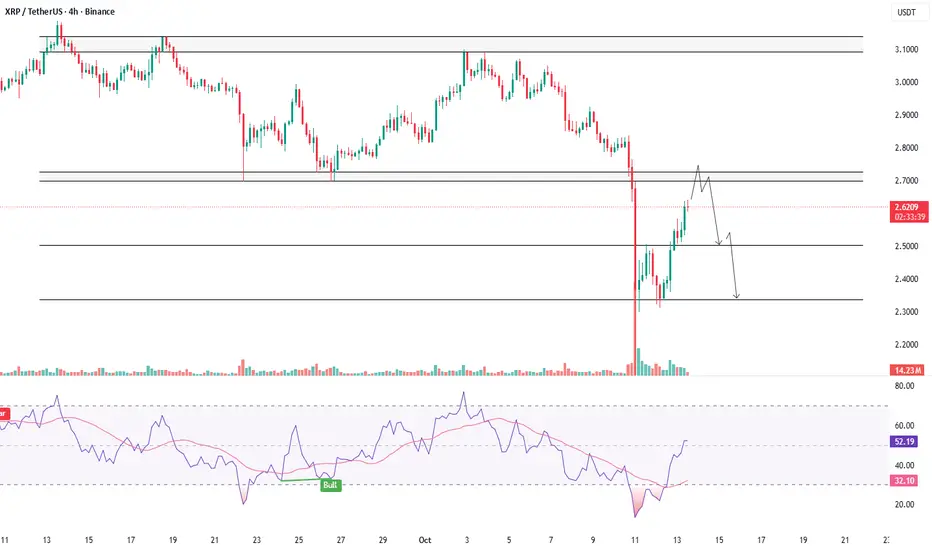
XRPUSDT - RETESTS RESISTANCE AFTER SELL-OFFSymbol - XRPUSDT
XRPUSDT is undergoing a corrective phase following a sharp sell-off. It remains premature to anticipate sustained growth without intermediate pullbacks, as the pair is approaching a major resistance zone.
The broader cryptocurrency market is showing signs of recovery after a period of heavy liquidations. Both BTCUSDT and XRPUSDT are nearing critical resistance levels, where a potential corrective movement could emerge.
From a technical perspective, after nearly two months of consolidation, the price broke below the established trading range, indicating a structural breakdown. As part of the current correction, XRPUSDT is retesting the liquidity zone between 2.7000 & 2.7266, which could serve as a trigger for renewed selling pressure.
Resistance levels: 2.7000 – 2.7266, 2.8286
Support level: 2.5050
A sharp advance without sufficient technical strength to surpass the 2.7000 resistance may lead to a false breakout, followed by a pullback toward the 2.5050 support zone.
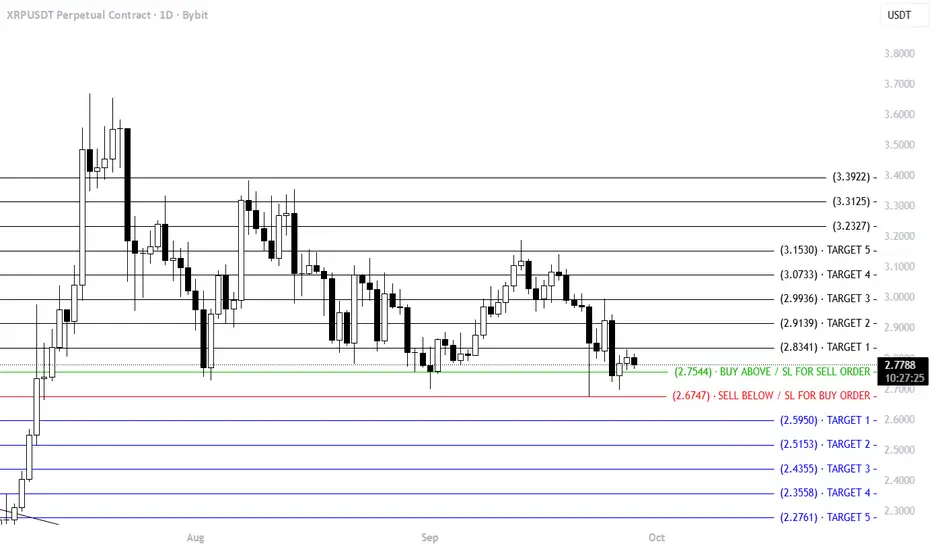
XRPUSD TRADING LEVELSTrading Levels for XRPUSD
Anyone can Trade on both sides (as per levels). WITH STRICT SL.
Levels shared on chart

XRP Breaks Above $3 – Bullish Momentum BuildsOverview:
XRP has officially closed the week above the $3 mark, a psychological resistance now turning into support. This is a major technical shift suggesting renewed bullish control.
🔑 Key Levels to Watch:
Support: $3.00
Short-Term Target: $3.20
Major Resistance / Magnet: $3.60 (All-Time High)
📊 Market Structure:
XRP appears to be breaking out of a consolidation zone between $2.70 and $3.00. This range held for several weeks, and a clean breakout could fuel a strong continuation toward previous highs.
🐂 Bullish Scenario:
Continued higher highs with volume could open the path to $3.20 and eventually $3.60.
A successful retest of the $3 level as support would further validate the breakout.
⚠️ Risk Note:
Watch for any fakeouts or low-volume rallies. A drop below $3 would negate the breakout and put the $2.70 support back in play.
📅 Outlook:
With Q4 2025 underway, a rally toward the ATH at $3.60 could be driven by both technical momentum and market sentiment.
💬 What’s your take? Are we heading for a new ATH this quarter?
📌 #XRP #Crypto #Altcoins #Breakout #TechnicalAnalysis #Q4Outlook

XRP Price Action – Accumulation Before GrowthXRP is currently navigating a phase defined by liquidity-driven swings and rapid sentiment shifts. After the market endured a heavy decline, buyers have re-emerged, showing resilience through aggressive rebounds. This behavior reflects a deeper pattern: sellers are losing efficiency in driving the market lower, while buyers are treating each dip as an opportunity to accumulate.
In the short term, the market appears to be balancing between two forces — the need for a corrective retracement to secure liquidity, and the desire of participants to push price into higher zones. This tug-of-war often results in shallow pullbacks, where temporary declines are quickly absorbed. Such behavior highlights that speculative capital is rotating back into XRP, aligning with broader risk-on sentiment across digital assets.
If this pattern holds, the near-term trajectory favors gradual expansion, with the asset likely aiming for higher valuations. However, investors should remain aware that short-term corrections are less about trend reversals and more about the mechanics of liquidity collection.

Trading Levels for XRPUSDTrading Levels for XRPUSD
Anyone can Trade on both sides (as per levels
Levels shared on chart
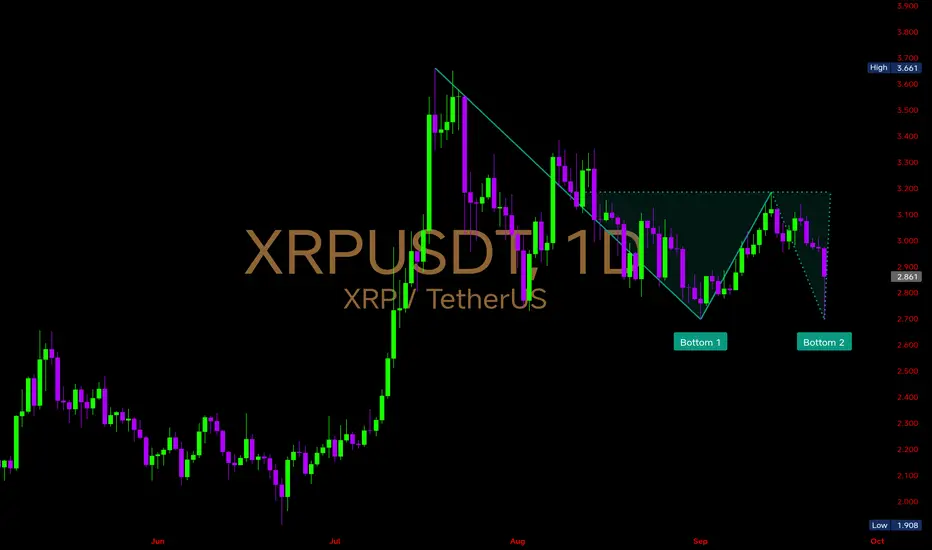
$XRP is showing a double bottom setup on the daily chartCRYPTOCAP:XRP is showing a double bottom setup on the daily chart, with price retesting the key support at 2.70.
⚡ If Bulls Defend 2.70:
Momentum could ignite a breakout above 3.20, opening the path toward 3.30 → 3.50 → 3.66 and confirming a strong reversal pattern.
⚠️ If Bears Take Over:
A breakdown below 2.70 may drag price toward 2.50 and even 1.90 — invalidating the bullish setup.
👉 Right now, 2.70 is the battleground. A decisive move here will set the tone for XRP’s next big swing!
XRPUSDT Buying ViewXRPUSDT – Buying View 📈
Price is consolidating near support around 3.03 – 3.02, showing signs of accumulation.
A breakout from this zone is expected to push price toward the next resistance at 3.067 – 3.07.
Entry: 3.03 – 3.035
Target: 3.067 – 3.07
Stop Loss: 3.025 (below support)

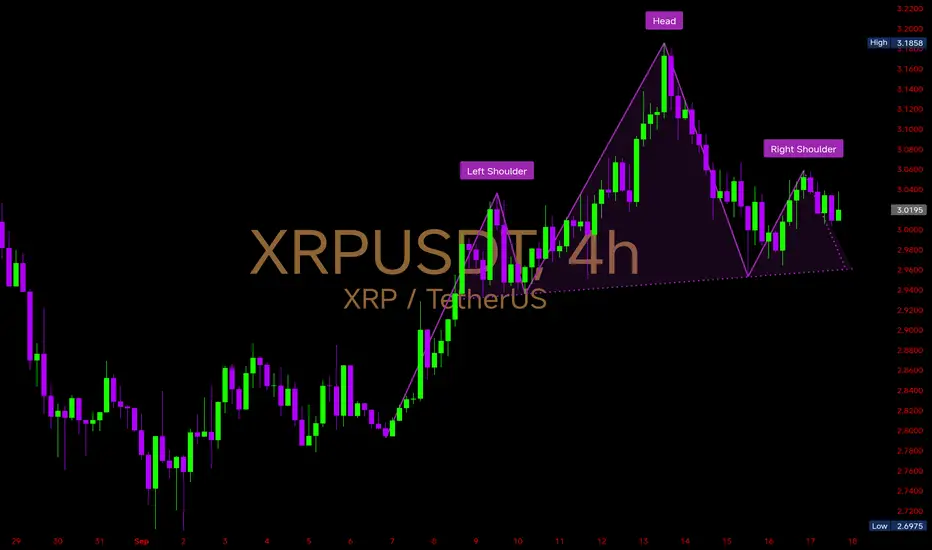
$XRP is currently forming a Head & Shoulders pattern on the 4Hr CRYPTOCAP:XRP is currently forming a Head & Shoulders pattern on the 4Hr timeframe — a structure often viewed as a trend reversal signal.
🔹 Immediate Levels to Watch
Resistance: $3.06 (short-term barrier)
Major Resistance: $3.18 (head top, key rejection point)
Support Zone: $2.95 – $3.00 (neckline & critical defense)
⚠️ Bearish : If #XRP breaks below the neckline at $2.95, it could trigger downside momentum, targeting $2.80 → $2.70. This would confirm the H&S breakdown and increase selling pressure.
🚀 Bullish : If buyers defend the $3.00 zone and successfully push above $3.06, the bearish setup weakens. A breakout beyond $3.18 would flip momentum back to the upside, opening the path toward $3.30+ in the short term.
XRP/USDT – Buy Setup on 15-Min ChartXRP is currently consolidating near 2.99 and respecting key support levels. The price action has formed a range and is now showing signs of accumulation.
📌 Entry: 2.9962 (CMP)
🎯 Target: 3.0582
🛑 Stop Loss: 2.9463
🔎 Analysis:
Price is trading inside a well-defined range with higher lows forming.
Breakout above 3.00 zone could push price toward the resistance zone near 3.05.
Good risk-to-reward ratio (R:R ≈ 2:1).
📊 View: Bullish bias as long as price stays above 2.99.

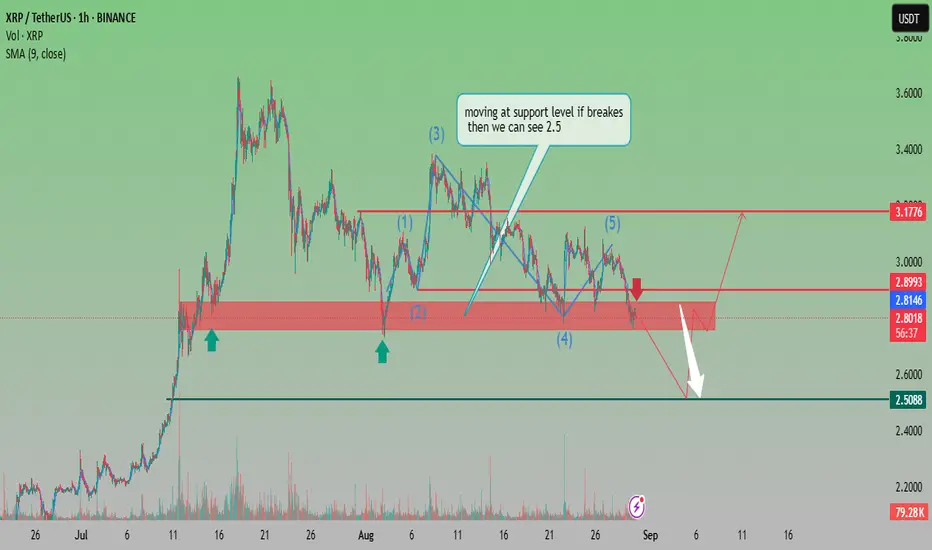
XRP Testing Key Support Zone – Potential Drop Toward $2.50 if ?Analysis:
XRP is currently trading around $2.80, right at a critical support level. The chart highlights a 5-wave Elliott structure, with the recent wave (5) completing near resistance. Price action is now consolidating in a key demand zone around $2.80 – $2.90.
If the support holds, we could see a bullish reversal with potential upside toward $3.18 resistance.
However, if the support breaks, a sharp decline toward $2.50 is likely, as indicated by the downside projection arrow.
The 9-period SMA ($2.81) is also being tested, which adds to the short-term pressure.
📌 Conclusion: XRP is at a decision point — holding above support could fuel a bounce, but a breakdown signals further bearish momentum toward $2.50.
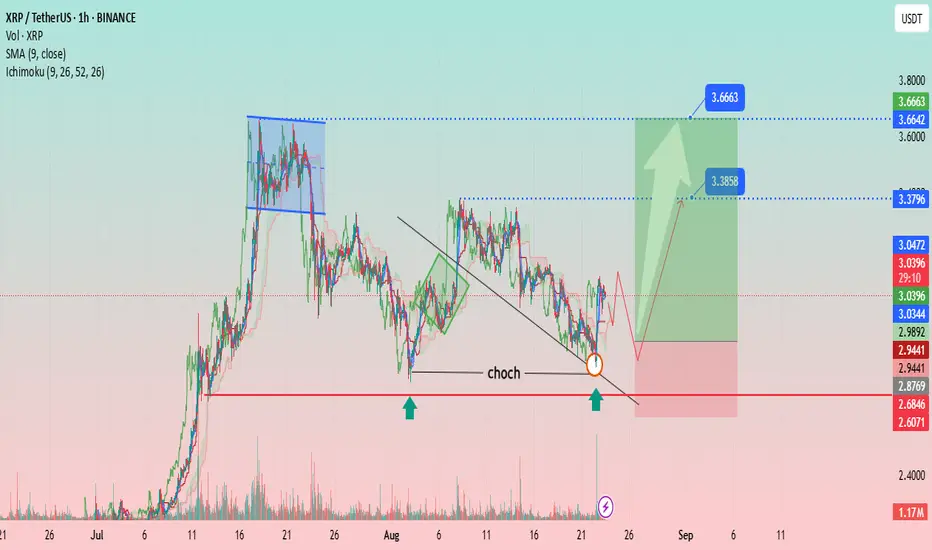
XRP/USDT – Bullish Reversal Setup After CHoCH BreakoutAnalysis:
The chart shows XRP/USDT (1H timeframe) developing a bullish structure after a Change of Character (CHoCH) confirmation near the $2.94 support zone. Price respected the key demand area (highlighted by green arrows) and broke above the descending trendline, signaling potential reversal momentum.
Support Zone: $2.94 – $2.87 (strong demand zone, price reacted twice).
Resistance Levels:
First target: $3.38
Second target: $3.66
Indicators:
SMA (9) at $3.04 – price hovering around it, suggesting early bullish strength.
Ichimoku showing potential cloud breakout aligning with bullish momentum.
Volume: Increasing at demand, indicating strong buyer interest.
Trade Plan:
Entry Zone: Around $3.00 – $3.05 (after retest confirmation).
Stop-Loss: Below $2.86 (invalidates setup if broken).
Targets:
TP1: $3.38
TP2: $3.66
Risk/Reward: Favorable, with potential 2:1 or higher depending on entry execution.
👉 This setup suggests that XRP may attempt a bullish continuation if support holds and volume sustains the breakout momentum.
$XRP – Inverse Head & Shoulders CRYPTOCAP:XRP – Inverse Head & Shoulders
Price is trading at $3.07 after bouncing from $2.66 (recent low).
The 4Hr chart is forming a classic Inverse Head & Shoulders pattern → a strong bullish reversal setup.
🔹 Inverse H&S often signals a trend reversal from bearish to bullish.
🔹Price is stabilizing at the right shoulder, suggesting accumulation before a potential neckline test.
🔹 Support: $2.90 – $2.95 (right shoulder zone)
🔹Neckline Resistance: $3.40 – $3.45
🔹Breakout Zone: Above $3.45 → confirms bullish reversal momentum.
If #XRP breaks above $3.45 neckline with volume, it could trigger a strong upside move, validating the bullish reversal.
However, failure to hold $2.90 support could delay the pattern, keeping XRP in consolidation.
