NeeteshJain
Technical: Strong breakout Awaiting After a breakout from a downward trend line, it strongly went up and then consolidated for a while, now it is showing sign of breaking the strong consolidating, which may take the prices further up to the range of 650-750 levels, with stops at 500. Fundamental: Undervalued Market Cap: 1600 Cr. P/E: 6.2 Debt to Equity:...
Technicals: Firstly, The chart has broken channel and then retested the upper trend line of the channel and confirmed it as support and it started moving up indicating a positive move to upside. A further positive close above the channel shall lead to the prices to go up to 200-225 levels, with technical stop at 160 levels. Fundamentals: The company has reduced...
It has been observed that the price action firstly breaking above the downward channel and now initiating to form a higher high and higher low sequence indicating a reversal in the price action. As per my analysis, price action shall further move up to the below targets. T1- 45 T2- 47 SL- 40 Thanks
It has been observed that the price action is consolidating within a downward channel. Now, the price action has reached to the support zone and also touching the support of the downward diagonal. On such zone, buying can be seen which shall further move prices up. As per my analysis, RECLTD is undervalued at current levels. It is providing good investment...
It has been observed that the price action is forming lower lows and trending down. Now, it shall further dip down to previous support zone. T1- 284 T2- 276 SL 300
It has been observed that the price action is breaking out of channel pattern and shall further move up to resistance zone. T1- 460 T2- 480 SL - 420
It has been observed that the price action facing strong resistance between 162-165 zone, indicating further weakness till the price action reaches to near support zone. T1- 152 T2- 146 SL- 162
It has been observed that the price action consolidating on higher levels and then breaking out on downside indicating a strong selling pressure at higher levels. Now, it shall further corrects the previous upward move. T1- 590 T2- 575 SL - 625
It has been observed that the price action facing a strong selling pressure at the resistance zone of 730-740 levels, which is indicating further weakness ahead. It has also observed that the price action also forming a range for past few months, which may likely to continue here on. T1- 700 T2- 680 SL- 750
It has been observed that the price action breaks below the triangle consolidation indicating a further weakness ahead. T1- 560 T2 -540 SL- 580
It has been observed that the price action created a double top at 10880-90 zone and then fall further and now facing resistance at 10850-60, indicating further weakness and trending down sequence. T1- 10750 SL-10880
It has been observed that the price action rallied a long wave up. It made a new high but could not sustain and now indicating further correction from here on. MACD indicating a negative crossover too. T1: 1350 SL: 1450
It has been observed that the price action consolidating in a range and now got a positive breakout above the resistance levels. Now, it shall further move up. T1-640 T2-660 SL-600
It has been observed that the price action is strongly trending up for past two years. Now, after a big rally up, it is consolidating in a triangle pattern and a breakout above it shall further bring upside rally. Fundamentals Facts: Market Cap: 4328 Cr Face Value: 10 Book Value: 175 P/E: 10 P/BV: 0.88 ROCE (5Yrs): 107% Short Term T1- 158 T2- 160 SL- 153 Long...
It has been observed on the monthly chart that the price action is forming a higher high, higher low sequence indicating a strong breakout from a current resistance zone of 140-150 levels. It has a strong fundamentals to support the next move up. T1- 170 T2-210 T3-300 SL -125
It has been observed that after a sudden huge gap up, the price action came down gradually and covered the big gap. Now, it is striving to breakout from the downward trend line in order to revive the trend. T1- 63 T2- 64 SL- 59.5
It has been observed that the price action was trending up and then corrected sharply within a downward channel and now it is breaking above the channel indicating a further continuation move to 340 plus levels. T1- 535 T2- 545 SL-505
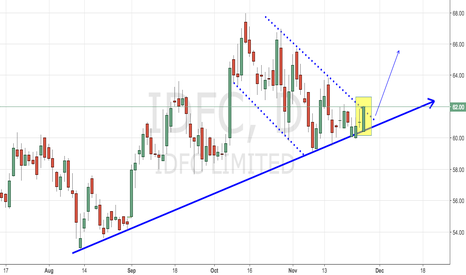
It has been observed that the price action is trending upside with short correction after every upward move. Now, the current short correction seems to be over with the current breakout. T1- 64 T2- 66 SL- 60


