SaiKarthik24
A Detailed Description is shown in Charts.
Raising Wedge Pattern Formed. Analysis:There are 3 different Possibilities as below. Case-1: Buy above 203.9 can go For Longs Targets are 204.9,206.25,207.5,211.45,212.1++ SL-199.5 Case-2: It may fall From CMP till 195.9 and due to support there can be PRZ From 195.9 to 205.05. Case-3: It may Fall From CMP till 186.85 in coming days.
Flag Pattern Formed. Case-1 Long above 673.25 Targets are 680.25,681.3,684,685.4,686.7,693.95++ SL-666 Case-2 Short below 666 Targets are 664,661.1,656,655.05,652.1-- SL-673
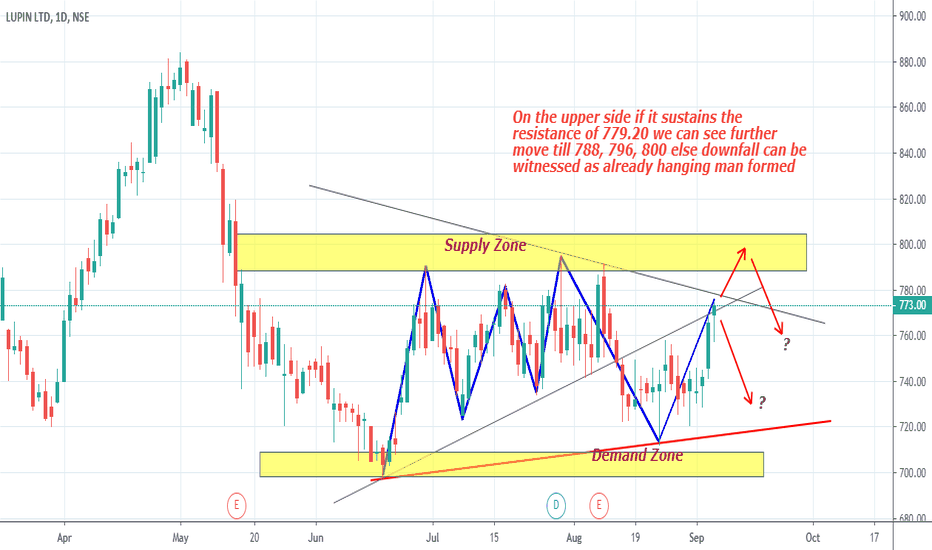
If it crosses Resistance zone we can see Upward Movement or else Downfall.
If it breaks supply zone it goes upwards in the range of 2840.4 to 2961.1
CASE 1 If It Breaks Flag-Break out upward It Increases from 2747.2++ CASE 2 It may Break Flag-Break out downward it may Fall From 2610.55--
Blue Line represents Bearish RSI Divergence. Orange line is Trend Line. Analysis As per Analysis Rounding Bottom Pattern Formed. Long above 1452.2 Targets are 1459.6,1460,1469.8,1479.5,1499.2,1501,1514,1522.75++ SL-1431.45 As per RSI Bearish Divergence concerned Short below 1412.5 Targets are 1405.05,1398.65,1396.9,1389.35,1382.95,1380.05,1368.6-- SL-1438
Rounding Bottom Pattern Formed Bearish RSI Divergence is also Formed (in Pink Color). Buy above 2274 Targets are 2276.15,2293.65,2307,2315.05,2318.9,2325.25,2328.05,2332,2348++ SL-2227.7 Sell below 2220 Targets are 2196.15,2194.9,2167,2162.5,2139.6 SL-2245.9 If it Crosses Downward Flag Breakout it may Fall Further.
Blue Line Represents Trend Line. Analysis Long above 3927.45 Targets are 3943.3,3972,3990.2,4013.6, 4036,4038.4,4060 SL-3920 Short below 3905 Targets are 3888.8,3876.5,3872.5,3838,3817.1 SL-3927.45
Bearish RSI Divergence and Shooting Star formed which represents downfall of stock price.


