Gold is in a tricky spot now. A solid reversal has formed on one side, while it can be construed as a continuation pattern, as well. On hindsight, it might look as a simple head and shoulder pattern which can give a bearish breakout. But, if you look closely, it is currently in a Elliott wave formation and it is currently going through a correction in the form of...
EUR/CAD has formed a head and shoulder pattern in the 15-min charts. It has broken the neckline as well. Hence, we expect the pair to move to the support levels at 1.50187.
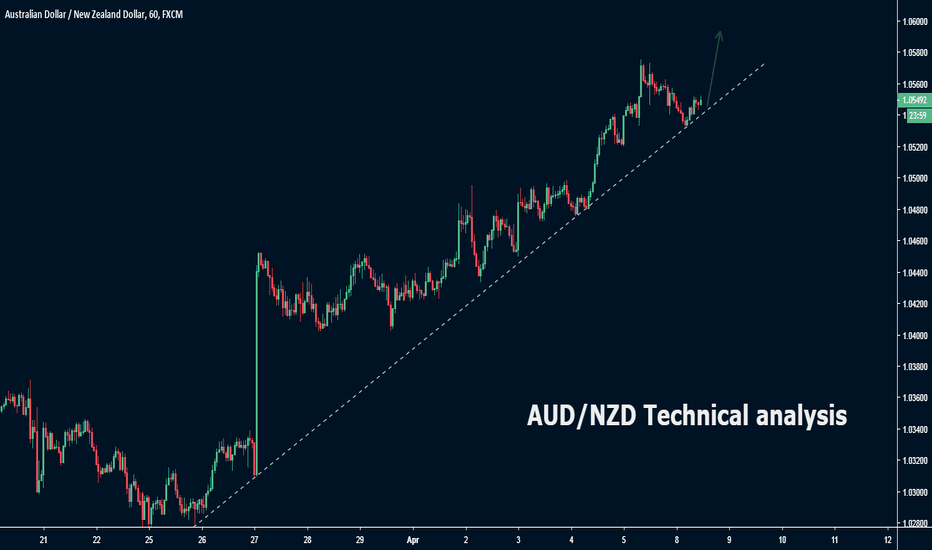
The steep rally in AUD/NZD is losing its steam. It is marked by the formation of rising wedge pattern in the hourly chart. As expected, it vented a bearish breakout. Also, the MACD indicators has turned bearish and posits a incrementing bearish momentum. Hence, we have a bearish view of the counter for the short-term.
After making a false breakout at the trendline, the pair rose steeply. Now, it is at a strong supply zone, owing to which price has reversed in the near-term. Also, the RSI indicator is perched at the 70 level mark. Hence, a profit booking rally is imminent in the counter if at all a trend reversal. The next support zones are the price action support at 111.399...
The pair is confined within the ranges of 1.57393-1.60778 for the past 2 months. It can be construed as ABC correction and the pair is assumed to in bull cycle. The value of 1.57393 provided strong support to the counter and it reversed the pair from the downtrend. A double bottom pattern formed at the formidable support of 1.57393 is actually the wave 1 and 2 of...
Bitcoin broke out if its range bound movement and made a steep rally to the value of $5400. But the momentum declined in the past few sessions and it formed a rising wedge pattern. It broke the pattern with a strong momentum candle. Hence, we expect a corrective rally in the counter and the price to move to the support values of 4693.02 and 4463.69.
The yellow made use of the uncertainty surrounding the EUR,USD and GBP and made a significant up move. It is currently consolidating for a move towards the trendline. We expect the trendline to lend support for another leg of up move. The next resistance is placed at 1312.487 and traders can expect a swift upswing.
The support of 0.68840 proves to be a tough nut for the bears. After bouncing back sharply twice, the pair was under the cloud of a bearish trendline for 5 months, which has broken now. Also, the pair found support at 61.8% of the previous rally, which is a strong bullish sign. Hence, we expect the trade with bullish bias. The next levels to watch out for are the...
The counter is in a long-term bear cycle, owing to Brexit. It completed the wave 3 and consolidated in the form of a wedge, which is wave 4. Now, we believe wave 5 has commenced since the wedge is broken and hence the pair can trade with profound bearish bias.
The descending triangle formed in the counter paints a bearish bias in the counter. The price is currently at a support zone, however, we expect it to break paving way for a short trade. Hence, traders can go short only after a bearish candle closes below the support zone.
The counter is brimming with positive bias for the past few days. The price is at its trendline in the hourly chart. Hence, it’s a good opportunity to go long since we expect it to continue its bullish momentum.
The counter is range bound, 0.71300-0.70669. After taking resistance at the upper end of the resistance, the counter has crossed the mid level of the range, 0.70981. Hence, we expect the pair to the lower end of the range, 0.70669.
An inverse head and shoulder pattern in the 4-hour chart signals a trend reversal in the counter. However, the pair has not crossed its neckline as of yet. Hence, we advise traders to go long on the pair only after the breakout of neckline.
The dragon pattern, a variation of double bottom pattern, is formed in the counter. The price has crossed the critical resistance level of 1.12047 as well. Hence we expect the pair to move to the next resistance levels of 1.12561 and 1.12939.
The double top pattern in the 30-min chart indicates the end of bull trend in the short term charts. The pair has also broke the critical support level of 0.67762. Hence we expect the pair to trade with bearish bias in the near-term.
The zone of 111.947-112.126 provides a hard resistance to the pair. Also, the pair has formed an ascending triangle pattern, which means that there is one leg of down move due in the counter. Hence we expect the pair to move to the supportive trendline for now.
GBP/JPY is currently trading in its 10-day high after forming a double bottom pattern. It surpassed the critical resistance of 146.496 as well with a strong bullish candle and is consolidating for now. Hence we expect the pair to continue its momentum and rally to the resistance at 148.411.
The pair is sizing up for long-term bearish move and is now constructing only first two waves of an Elliott wave. Second wave being an corrective wave has a three wave structure - ABC. The breaking of the trendline indicates the commencement of wave C. Hence, traders can take advantage of the near-term bullish bias and initiate long positions.


