This chart captures a structure-aware buy setup on Apple Inc. (AAPL), using Leola Lens SignalPro with momentum overlays and risk visualization.
What the Chart Shows:
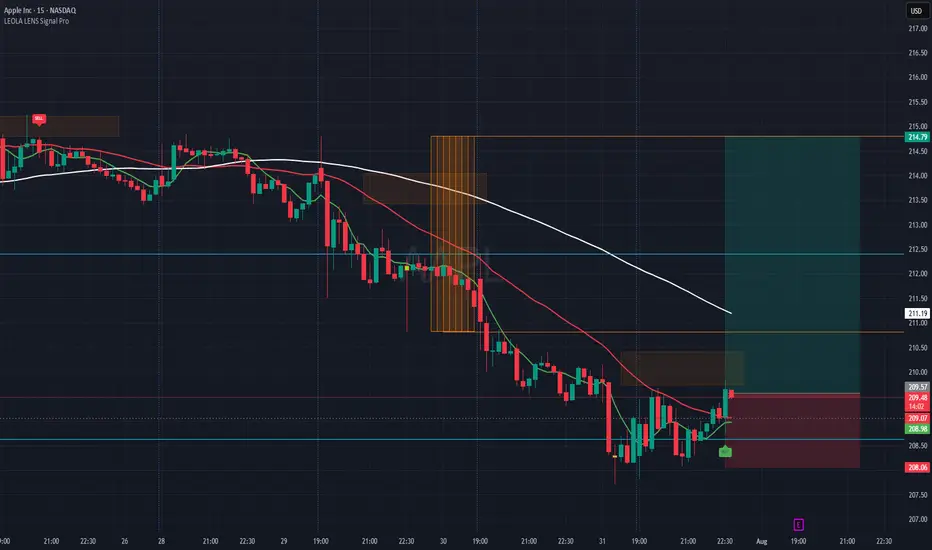
🟢 A new BUY label appeared after price tapped a previously marked liquidity zone.
📉 Prior bearish momentum exhausted near 208.50–208.90 area — forming a potential base.
🟥 Overhead resistance is clearly defined, aligning with a recent rejection block and moving average confluence.
✅ A well-defined Risk:Reward setup is plotted — aiming for continuation toward 214.79, with risk below 208.06.
Key Levels to Monitor:
🔺 Break and hold above 210.50 could shift bias toward bullish continuation.
⚠️ Failure to hold above 209.00 could invalidate the current intraday structure.
This view is for educational purposes only — illustrating how price reacts around structure, liquidity, and confirmation signals.
What the Chart Shows:
🟢 A new BUY label appeared after price tapped a previously marked liquidity zone.
📉 Prior bearish momentum exhausted near 208.50–208.90 area — forming a potential base.
🟥 Overhead resistance is clearly defined, aligning with a recent rejection block and moving average confluence.
✅ A well-defined Risk:Reward setup is plotted — aiming for continuation toward 214.79, with risk below 208.06.
Key Levels to Monitor:
🔺 Break and hold above 210.50 could shift bias toward bullish continuation.
⚠️ Failure to hold above 209.00 could invalidate the current intraday structure.
This view is for educational purposes only — illustrating how price reacts around structure, liquidity, and confirmation signals.
Trade closed: target reached
Disclaimer
The information and publications are not meant to be, and do not constitute, financial, investment, trading, or other types of advice or recommendations supplied or endorsed by TradingView. Read more in the Terms of Use.
Disclaimer
The information and publications are not meant to be, and do not constitute, financial, investment, trading, or other types of advice or recommendations supplied or endorsed by TradingView. Read more in the Terms of Use.