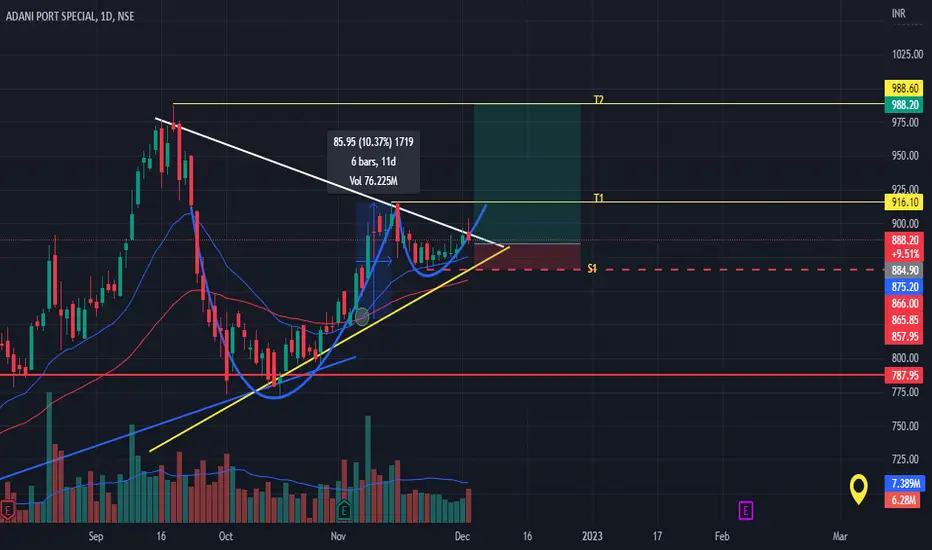
AS WE CAN SEE AFTER THE BULLISH CROSSOVER ON 04TH NOVEMBER STOCK RISE 10.37% IN JUST 6BARS
stock trading at a rising trendline and above 20EMA
CHART FORMATION
BULLISH SYMMETRICAL TRIANGLE
CUP&HANDLE
INDICATORS
RSI=58.66
HV=17.10
GROSS PROFIT=27.11B UP from last quarter 25Billion
educational purposes only!
stock trading at a rising trendline and above 20EMA
CHART FORMATION
BULLISH SYMMETRICAL TRIANGLE
CUP&HANDLE
INDICATORS
RSI=58.66
HV=17.10
GROSS PROFIT=27.11B UP from last quarter 25Billion
educational purposes only!
Note
Will bounce back from the 790 level. dark red line support see the chart I have already mentioned.Due to covid fear and some kerla fishing community protest which said the port was causing erosion that undermined their livelihoods. this is why stocks slide and fall but now everything is on the track
Note
Hindenburg, a well-known US short-seller, said key listed companies in the group controlled by billionaire Gautam Adani had substantial debt, which has put the entire group on a ‘precarious financial footing.’Adani Group Mulls Legal Action Against Hindeberg Research Over Fraud Claims
Note
For Adani stocks to fall, some big party needs to sell: - LIC won't
- Banks won't (they own pledged shares; but if they sell Adani defaults and bank too)
- Promoters own close to 75%
Even shell companies won't sell.
Lesson: become so big, that you become the market itself.
Note
Stock making rising wedge which indicates bearish reversal till 700 levelsfacing rejection from the 790 level with shooting star on day TF with a Rising wedge pattern.
Disclaimer
The information and publications are not meant to be, and do not constitute, financial, investment, trading, or other types of advice or recommendations supplied or endorsed by TradingView. Read more in the Terms of Use.
Disclaimer
The information and publications are not meant to be, and do not constitute, financial, investment, trading, or other types of advice or recommendations supplied or endorsed by TradingView. Read more in the Terms of Use.