Compra  AME
AME
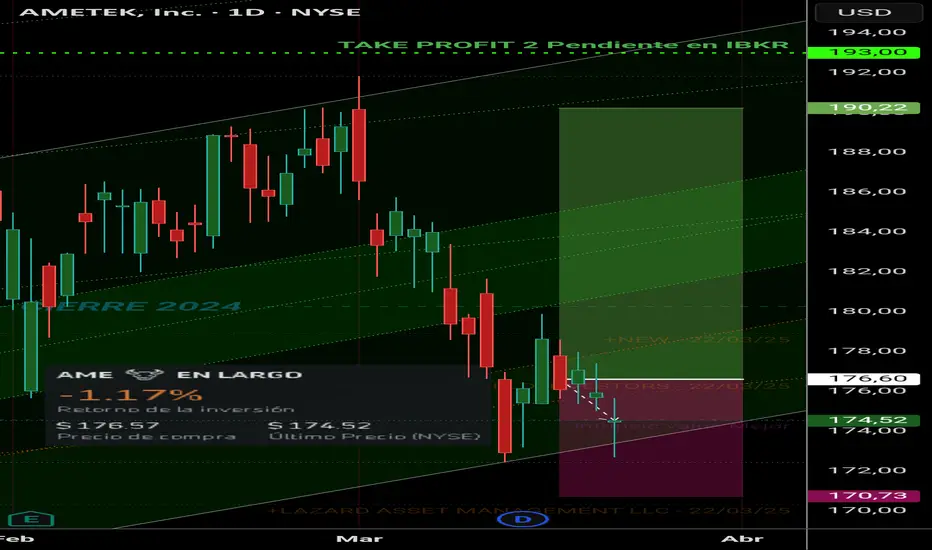
Datos de entrada en el gráfico.
🚧Fundamentos y observaciones:
- P/E 24.46x (Max 31.69x; Media 22.57x; Sector 18.23x) ⚠👍.
-Estimación de crecimiento de ingresos: En 2025 de +2.98%; En 2026 de +6.50% y en 2027 de +7.42% 👍.
-gran recompra de acciones en último trimestre (+0.28% YoY; -0.05% QoQ)🚧👍.
-Valor intrínseco $134.03; Peor $113.54; Mejor $174.57🚧.
-Poco margen de maniobra a corto plazo, pero gran margen a largo plazo 👍.
-ROIC 13.90%👍.
-Seasonality: Abr 1.10%; May 0.66%; Jun 0.25%; Jul 2.02% (Best Feb; Mar; Nov – Bad Sep) ⚠👍.
-Momentum 1Y corrección al -3.50% (Max +7.55%) 🚧.
-YTD -2.10% 👎.
-Pertenece a ETF de Growth - Mid Cap – S&P 500- Electronic Equipment 👍.
-M. Bruto 35.68%; M. Operativo 25.64%; M. Neto 19.83%👍.
-Ingreso trimestral 2014: 990.70 M; EPS: 0.61.
Último trimestre 2025: 1.76 B; EPS: 1.87👍.
21/03/25
---------------------------------------------------
Análisis de AMETEK, Inc. pendiente...
Compra realizada el día:
18 de Marzo 2025.
Disclaimer
The information and publications are not meant to be, and do not constitute, financial, investment, trading, or other types of advice or recommendations supplied or endorsed by TradingView. Read more in the Terms of Use.
Disclaimer
The information and publications are not meant to be, and do not constitute, financial, investment, trading, or other types of advice or recommendations supplied or endorsed by TradingView. Read more in the Terms of Use.