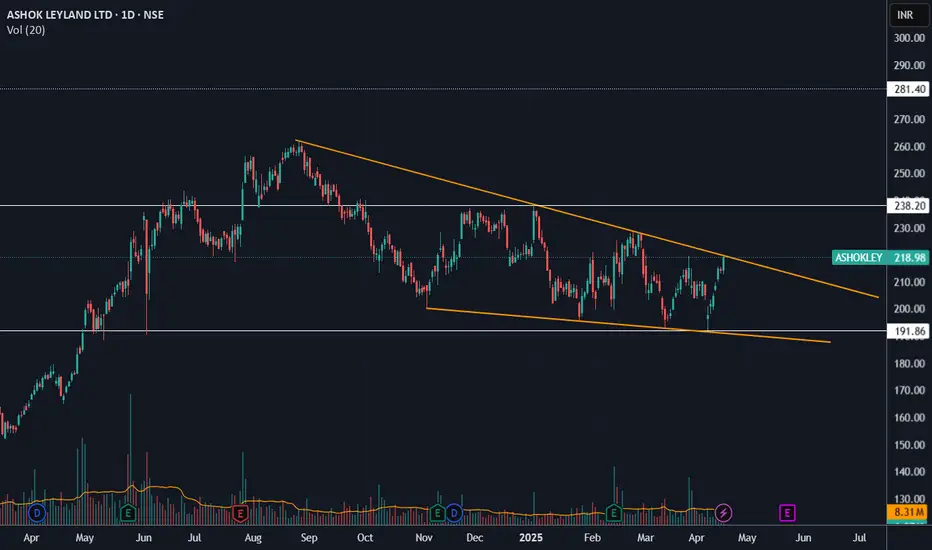
For the last nine months, Ashok Leyland has developed a falling wedge pattern. With the stock currently testing the upper trendline, a close above it would likely confirm a bullish breakout. It can reach 280 levels, as indicated by the pattern.
Disclaimer
The information and publications are not meant to be, and do not constitute, financial, investment, trading, or other types of advice or recommendations supplied or endorsed by TradingView. Read more in the Terms of Use.
Disclaimer
The information and publications are not meant to be, and do not constitute, financial, investment, trading, or other types of advice or recommendations supplied or endorsed by TradingView. Read more in the Terms of Use.