Today I am sharing some of the most important levels on my chart, and why I think they should be on your chart too.
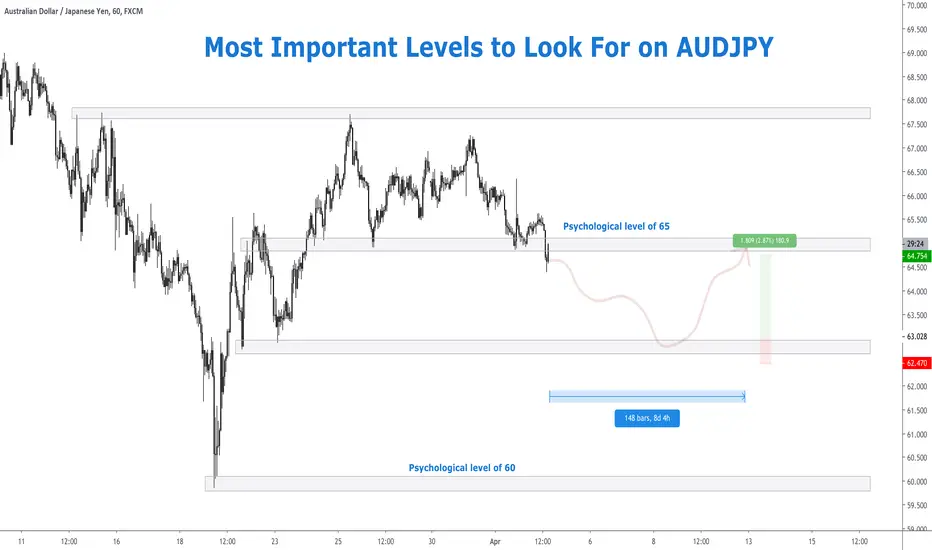
Let's start with the two levels based on psychology. We often see nice round numbers appearing in trading, because it's not just algorithms trading... it's humans too! That's why we see these super important levels around 65 and 60. You can see that the price responds very heavily around these areas. For us as traders, what we want to achieve is that we monetize the movements between these zones. But we never want to try to trade beyond the zones. The reason for this is the unexpected volatility that can occur around zones of support and resistance. Especially the psychological levels.
For the other two levels, we see interesting behaviour around 67.7 and 62.8. These are areas where we have seen prices reaching the maximum of their high or their temporary minimum of their low, literally denoting resistance or support for that price level. Again, prices often move relatively stable within these, and then show significant movement when they break through these. As a trade you don't always need to predict exactly when it's going to break through, as long as you monetize the movements within them, and set your stop loss accordingly.
Follow me for consistent high quality updates, with clear explanations and charts.
Please like this post to support me.
- Trading Guru
--------------------------------------------------------------
Disclaimer!
This post does not provide financial advice. It is for educational purposes only!
Thảo luận về những biến động và nói cùng nhau về thị trường giao dịch ở cộng đồng Telegram này nhé!
t.me/Vietnam100eyes
(bắt đầu từ tháng 2 - 2023)
t.me/Vietnam100eyes
(bắt đầu từ tháng 2 - 2023)
Disclaimer
The information and publications are not meant to be, and do not constitute, financial, investment, trading, or other types of advice or recommendations supplied or endorsed by TradingView. Read more in the Terms of Use.