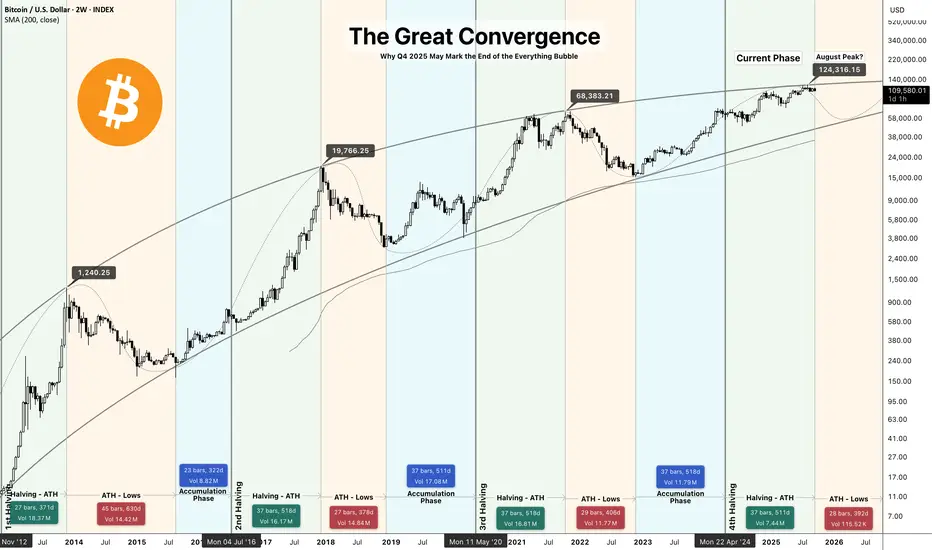
The Great Convergence: Why Q4 2025 May Mark the End of the Everything Bubble
A Multi-Asset Analysis of Bitcoin, S&P 500, and Gold at Critical Junctures
Hello Traders, After analyzing 25 years of market data across three major financial crises, I've identified a dangerous convergence of signals suggesting we're approaching a significant market inflection point. The simultaneous peaks in BITCOIN (~$124K),
  SPX (6,700), and
  GOLD ($3,790) combined with deteriorating macroeconomic indicators mirror patterns that preceded both the 2000 and 2008 crises.
Key Thesis: We are potentially entering a liquidity crisis that could result in a 30-50% correction across risk assets by Q4 2026.
Part I: The Bitcoin Halving Cycle - End of the Fourth Epoch

Historical Pattern Recognition
BTCUSD price action has followed a remarkably consistent 4-year cycle tied to its halving events:
Current Technical Indicators
Price Targets
Part II: The Macro Crisis Trigger - SPXSPX / Unemployment Rate  USUR / Fed Rate Correlation USINTR

The Historical Precedent
Every major crisis follows a predictable sequence:
2000 Dot-Com Bubble:
2008 Financial Crisis:
2025 AI/Everything Bubble:
The Unemployment-Rate Cut Death Cross
Since 1970, whenever the Fed has cut rates while unemployment is rising from cycle lows:
Current Labor Market Dynamics - The AI Disruption Factor
Unlike previous cycles, we face structural unemployment pressure from AI adoption:
This isn't temporary cyclical unemployment - it's structural displacement requiring economic reorganization.
Part III: Gold's Crisis Pattern - The Liquidation Before the Flight

HistoricalGOLD Behavior in Crisis
Contrary to popular belief,XAUUSD can and does suffer fast flushes during systemic liquidity panics despite its long-term hedge role; with gold near ATH, combined liquidity and profit-taking risk could produce a 15–25% correction ahead of any later safe-haven rally:
2000 Crisis:
2008 Crisis:
Covid-19 Pandemic:
Some will point to 2020, when gold rallied during the COVID crash. But that was a unique exogenous shock: the selloff lasted only weeks before unprecedented stimulus and collapsing real yields drove gold to new highs. In contrast, financial‑system crises like 2000 and 2008 forced gold into a year‑long correction before its hedge role reasserted. The 2025 setup looks far closer to those financial crises than to 2020’s pandemic shock.
2025 Projection:
Why Gold Falls Initially
During liquidity crises, investors sell everything to meet margin calls and raise cash - even safe havens. Only after the acute phase does gold fulfill its hedge role.
Part IV: The Convergence - Why This Time Is Particularly Dangerous
Unique Risk Factors in 2025
1. Unprecedented Valuations Across All Assets
2. Leverage and Derivatives
3. Geopolitical Tensions
4. Cryptocurrency Systemic Risk
Part V: The Three-Stage Crisis Model
Stage 1: The Warning Shot (Now - Q4 2025)
Stage 2: The Liquidity Cascade (Q4 2025 - Q2 2026)
Stage 3: Capitulation and Reset (Q2 2026 - Q4 2026)
My Risk Management Framework
Position Sizing
Key Indicators to Monitor
Invalidation Scenarios
This bearish thesis would be invalidated if:
Conclusion: Probability-Weighted Scenarios
Based on historical precedent and current conditions, I assign the following probabilities:
The risk/reward severely favors defensive positioning. After a 15-year bull market across all assets, the convergence of deteriorating fundamentals, extreme valuations, and historical crisis patterns suggests we're approaching a critical inflection point.
Remember: Markets can remain irrational longer than you can remain solvent. This analysis presents probabilities, not certainties. Always manage risk appropriately and never invest more than you can afford to lose.
Disclaimer: This analysis is for educational purposes only and should not be considered financial advice. Past performance does not guarantee future results. Always conduct your own research and consult with financial professionals before making investment decisions.
Follow for updates as this thesis develops. Key milestones to watch:
A Multi-Asset Analysis of Bitcoin, S&P 500, and Gold at Critical Junctures
Hello Traders, After analyzing 25 years of market data across three major financial crises, I've identified a dangerous convergence of signals suggesting we're approaching a significant market inflection point. The simultaneous peaks in
Key Thesis: We are potentially entering a liquidity crisis that could result in a 30-50% correction across risk assets by Q4 2026.
Part I: The Bitcoin Halving Cycle - End of the Fourth Epoch
Historical Pattern Recognition
- 2012 Halving → 2013 Peak (1 year delay): +8,000% rise, -85% crash
- 2016 Halving → 2017 Peak (1.5 years delay): +2,800% rise, -84% crash
- 2020 Halving → 2021 Peak (1.5 years delay): +700% rise, -77% crash
- 2024 Halving → 2025 Peak (1.5 years delay): +450% rise, -75% crash projected
Current Technical Indicators
- RSI Divergence: Weekly RSI showing lower highs while price makes higher highs - classic exhaustion signal present at 2013, 2021 previous cycle tops.
- Volume Profile: Declining volume on recent rallies indicates weakening conviction
- On-chain Metrics: Long-term holder distribution accelerating, similar to previous cycle tops
Price Targets
- Current Level: $109,498
- Proposed Peak: $124,000 (By halving cycle theory this was fulfilled last month August)
- Initial Support: $69,000 (previous cycle ATH)
- Crisis Target: $25,000-30,000 (75% drawdown from peak by Q6 2026)
Part II: The Macro Crisis Trigger - SPX
The Historical Precedent
Every major crisis follows a predictable sequence:
2000 Dot-Com Bubble:
- SPX at ATH (1,550) ✓
- Unemployment begins rising from 3.9% ✓
- Fed initiates rate cuts ✓
- → 49% crash over 2.5 years
2008 Financial Crisis:
- SPX at ATH (1,576) ✓
- Unemployment rises from 4.4% ✓
- Fed cuts rates aggressively ✓
- → 57% crash over 1.5 years
2025 AI/Everything Bubble:
- SPX at ATH (6,700) ✓
- Unemployment rising from 3.4% ✓
- Fed just initiated cuts (Sept 2025) ✓
- → Projected 35-45% correction over 1.5 years
The Unemployment-Rate Cut Death Cross
Since 1970, whenever the Fed has cut rates while unemployment is rising from cycle lows:
- 12/12 times resulted in recession within 12 months
- Average equity drawdown: 35%
- Average duration: 18 months
Current Labor Market Dynamics - The AI Disruption Factor
Unlike previous cycles, we face structural unemployment pressure from AI adoption:
- Customer service: 2M jobs at risk
- Software development: 500K jobs transitioning
- Logistics/Transport: 3M jobs being automated
- Administrative: 4M jobs under pressure
This isn't temporary cyclical unemployment - it's structural displacement requiring economic reorganization.
Part III: Gold's Crisis Pattern - The Liquidation Before the Flight
Historical
Contrary to popular belief,
2000 Crisis:
- Pre-crisis peak: $326
- Initial drop: -21%
- Bottom-to-recovery: +650% over 11 years
2008 Crisis:
- Pre-crisis peak: $1,033
- Initial drop: -34%
- Bottom-to-recovery: +180% over 3 years
Covid-19 Pandemic:
- Pre-pandemic peak: $1,696
- Initial drop: -15%
- Bottom-to-recovery: +43% over 2 years and 160% over 5 years
Some will point to 2020, when gold rallied during the COVID crash. But that was a unique exogenous shock: the selloff lasted only weeks before unprecedented stimulus and collapsing real yields drove gold to new highs. In contrast, financial‑system crises like 2000 and 2008 forced gold into a year‑long correction before its hedge role reasserted. The 2025 setup looks far closer to those financial crises than to 2020’s pandemic shock.
2025 Projection:
- Current peak: $3,790
- Expected initial drop: -20 to -25%
- Target bottom: $3,000-$2,800
- Long-term recovery target: $6,500+ by 2030
Why Gold Falls Initially
During liquidity crises, investors sell everything to meet margin calls and raise cash - even safe havens. Only after the acute phase does gold fulfill its hedge role.
Part IV: The Convergence - Why This Time Is Particularly Dangerous
Unique Risk Factors in 2025
1. Unprecedented Valuations Across All Assets
- Total global asset values: $450 trillion (4.5x global GDP)
- Buffett Indicator: 195% (highest ever)
- Shiller CAPE: 38 (higher than 1929)
2. Leverage and Derivatives
- Total derivatives notional: $700 trillion
- Margin debt: $935 billion (record high)
- Corporate debt/GDP: 85% (record high)
3. Geopolitical Tensions
- Active conflicts affecting supply chains
- De-dollarization accelerating
- Energy market fragmentation
4. Cryptocurrency Systemic Risk
- $2.5 trillion BTCUSD and over $4T gross crypto
 TOTAL asset class that didn't exist in 2008
 - Interconnected with traditional finance via ETFs
- Untested in true liquidity crisis
Part V: The Three-Stage Crisis Model
Stage 1: The Warning Shot (Now - Q4 2025)
- Timeline: Next 1-3 months
- Characteristics:
- Deteriorating breadth (fewer stocks making highs)
- Defensive rotation begins
- VIX creeping higher
- First 10% correction dismissed as "healthy"
- Deteriorating breadth (fewer stocks making highs)
Stage 2: The Liquidity Cascade (Q4 2025 - Q2 2026)
- Timeline: 6-9 months
- Characteristics:Multiple failed rallies
"Buy the dip" mentality breaks
Margin calls cascade
All correlations go to 1 - Targets:
Stage 3: Capitulation and Reset (Q2 2026 - Q4 2026)
- Timeline:6-12 months
- Characteristics:Forced selling exhaustion
Government intervention
Market clearing prices reached - Final Targets:
My Risk Management Framework
Position Sizing
- Current Risk Asset Exposure: Reduce to 30% of portfolio
- Cash: 50%
- Precious Metals (Physical): 10%
- Strategic Shorts: 10% (via puts and/or inverse ETFs)
Key Indicators to Monitor
- Weekly Unemployment Claims:USUR Sustained moves above 250K
- Credit Spreads: HYG/TLT ratio breaking below 4.5
- Dollar Strength:
 DXY above 110 signals global stress
 - BITCOIN Dominance: Below 45% indicates alt-coin capitulation
- VIX Term Structure: Inversion signals immediate stress
Invalidation Scenarios
This bearish thesis would be invalidated if:
- Unemployment reverses below 4%
- Fed pivots to QE without crisis
- Fiscal stimulus exceeds $2 trillion
- AI productivity gains offset job losses faster than expected
Conclusion: Probability-Weighted Scenarios
Based on historical precedent and current conditions, I assign the following probabilities:
- 60% Probability: Significant correction (20-30% drawdown) beginning Q4 2025
- 25% Probability: Major crisis (40-50% drawdown) rivaling 2008
- 15% Probability: Continued melt-up through 2026 (Fed intervention success)
The risk/reward severely favors defensive positioning. After a 15-year bull market across all assets, the convergence of deteriorating fundamentals, extreme valuations, and historical crisis patterns suggests we're approaching a critical inflection point.
Remember: Markets can remain irrational longer than you can remain solvent. This analysis presents probabilities, not certainties. Always manage risk appropriately and never invest more than you can afford to lose.
Disclaimer: This analysis is for educational purposes only and should not be considered financial advice. Past performance does not guarantee future results. Always conduct your own research and consult with financial professionals before making investment decisions.
Follow for updates as this thesis develops. Key milestones to watch:
- October NFP report
- November FOMC meeting
- Q4 earnings season
- Year-end positioning
The NFX Team
Related publications
Disclaimer
The information and publications are not meant to be, and do not constitute, financial, investment, trading, or other types of advice or recommendations supplied or endorsed by TradingView. Read more in the Terms of Use.
The NFX Team
Related publications
Disclaimer
The information and publications are not meant to be, and do not constitute, financial, investment, trading, or other types of advice or recommendations supplied or endorsed by TradingView. Read more in the Terms of Use.