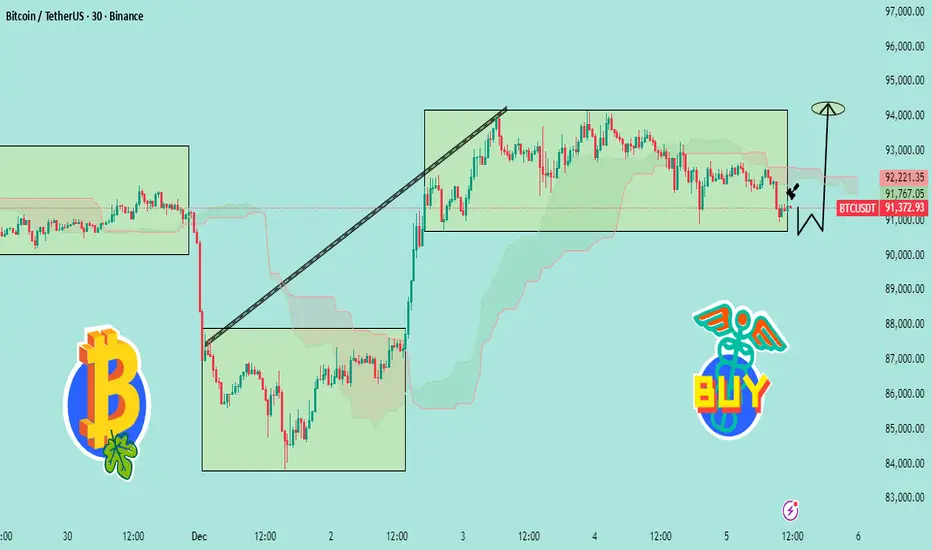
📊 BTCUSDT Analysis (Based on Your Chart)
1️⃣ Price is Still Respecting the Range
Bitcoin is trading inside a wide consolidation box (around 91,000 – 93,000).
The recent drop tapped the bottom of the range, showing a clean liquidity sweep.
That wick below the box = fake breakdown → bullish signal.
---
2️⃣ Strong Reaction at Demand Zone
The chart shows BTC touching the demand/support zone, followed by a small bullish reaction (the black arrow).
This suggests:
Sellers failed to break lower
Buyers are stepping in exactly where expected
Market preparing for a reversal bounce
---
3️⃣ Expected Move (Your W Pattern Idea)
The drawn “W-shape” indicates a double bottom setup.
If the bottom holds around 91,000, BTC can push back toward:
🎯 Target: 93,500 – 94,000
This matches the upper boundary of the consolidation.
---
4️⃣ Bullish Scenario
If BTC holds above 91,000–91,300:
Reclaim mid-range
Break through resistance
Continue toward 94,000+
This aligns with the “BUY” tag you added.
---
5️⃣ Bearish Invalidations
Bullish idea is invalid if: ❌ Price closes below 90,800 on 30-minute
= fresh breakdown → deeper correction
---
🧠 Summary
BTC swept liquidity at the support → formed a bounce → still inside range → bullish reversal expected toward 94K
t.me/+kAmP9HY4OpY5ODY0
Accurate Gold, Forex & Crypto Market Analysis 📊
Stay Ahead in the Market with Smart Analysis ⚡
Accurate Gold, Forex & Crypto Market Analysis 📊
Stay Ahead in the Market with Smart Analysis ⚡
Related publications
Disclaimer
The information and publications are not meant to be, and do not constitute, financial, investment, trading, or other types of advice or recommendations supplied or endorsed by TradingView. Read more in the Terms of Use.