😎 Hey everyone! Hope you’re doing great! Welcome to SatoshiFrame channel .
👍 Today we’re diving into the 1-Day BITCOIN analysis. Stay tuned and follow along!
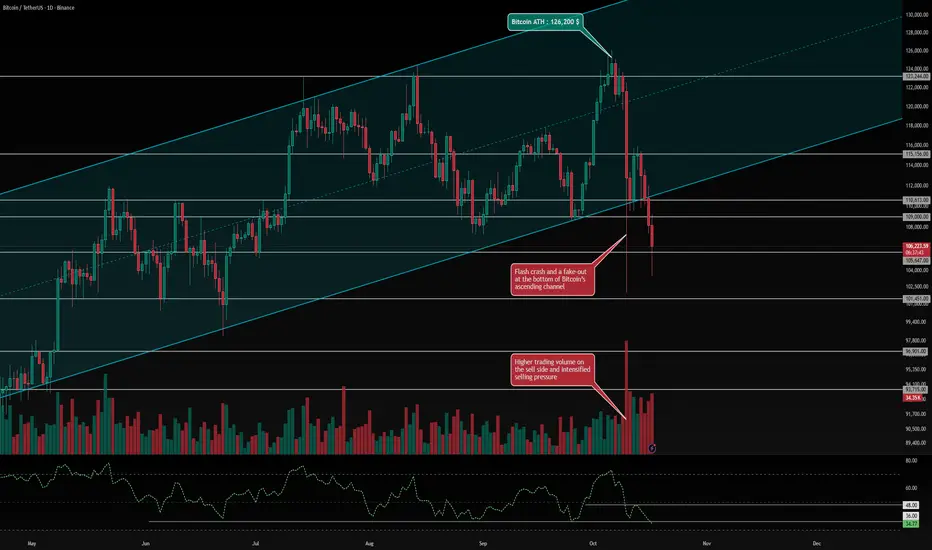
👀 Bitcoin has been trading within a strong ascending channel, recently hitting the upper boundary and setting a new all-time high (ATH) at $126,200. However, this was immediately followed by a flash crash that wiped out roughly $20 billion in futures positions. During the crash, the lower boundary of the ascending channel was also fake-broken, after which buyers temporarily pushed the price back inside the channel. Yet, due to extreme market fear and uncertainty, Bitcoin lost its key support zone at $110,613, continuing the downtrend that began with the flash crash. With yesterday’s daily candle close, Bitcoin officially broke down from its ascending channel, and price action is now heading toward lower support levels. The nearest support lies around $105,647, and if this zone fails to hold, Bitcoin could extend its decline toward the next support at $101,451.
🔍 Bitcoin currently faces two major resistance zones at $109,000 and $110,613. A confirmed breakout above these could signal the start of a reversal, but the main long trigger is located at $115,156. If Bitcoin breaks and holds above this zone with strong buying volume, it could mark the beginning of a powerful bullish leg, potentially leading to a new ATH.
🧮 The RSI oscillator is now sitting near its support region around 36. A daily close below this level would strengthen bearish momentum and could push RSI into oversold territory. The midline resistance sits near 48, and a breakout above this would indicate a possible trend reversal toward renewed bullish momentum.
🕯 Recent candlestick volume shows extremely high selling pressure, marking one of the most intense liquidation waves in recent crypto history. The number of red candles has surged in recent days, suggesting a continuation sell-off pattern, with traders increasingly favoring short positions. The market is currently in extreme fear, and for any bullish reversal to occur, Bitcoin would need massive buy-side volume and strong support to push prices back up. Without that, more long-term holders may start selling as well.
🧠 Current Scenarios (Daily Timeframe) — Patience is key. If you haven’t already entered a short based on previous analyses, consider these setups:
🟢 Long Scenario: Enter on a confirmed breakout and consolidation above $115,156, accompanied by a spike in buying volume and an RSI move above 48.
🔴 Short Scenario: Enter on a confirmed breakdown and close below $105,647, which could trigger a deeper correction toward lower levels. This move would likely coincide with continued selling pressure and RSI dropping below 36 into the oversold zone.
❤️ Disclaimer : This analysis is purely based on my personal opinion and I only trade if the stated triggers are activated .
👍 Today we’re diving into the 1-Day BITCOIN analysis. Stay tuned and follow along!
👀 Bitcoin has been trading within a strong ascending channel, recently hitting the upper boundary and setting a new all-time high (ATH) at $126,200. However, this was immediately followed by a flash crash that wiped out roughly $20 billion in futures positions. During the crash, the lower boundary of the ascending channel was also fake-broken, after which buyers temporarily pushed the price back inside the channel. Yet, due to extreme market fear and uncertainty, Bitcoin lost its key support zone at $110,613, continuing the downtrend that began with the flash crash. With yesterday’s daily candle close, Bitcoin officially broke down from its ascending channel, and price action is now heading toward lower support levels. The nearest support lies around $105,647, and if this zone fails to hold, Bitcoin could extend its decline toward the next support at $101,451.
🔍 Bitcoin currently faces two major resistance zones at $109,000 and $110,613. A confirmed breakout above these could signal the start of a reversal, but the main long trigger is located at $115,156. If Bitcoin breaks and holds above this zone with strong buying volume, it could mark the beginning of a powerful bullish leg, potentially leading to a new ATH.
🧮 The RSI oscillator is now sitting near its support region around 36. A daily close below this level would strengthen bearish momentum and could push RSI into oversold territory. The midline resistance sits near 48, and a breakout above this would indicate a possible trend reversal toward renewed bullish momentum.
🕯 Recent candlestick volume shows extremely high selling pressure, marking one of the most intense liquidation waves in recent crypto history. The number of red candles has surged in recent days, suggesting a continuation sell-off pattern, with traders increasingly favoring short positions. The market is currently in extreme fear, and for any bullish reversal to occur, Bitcoin would need massive buy-side volume and strong support to push prices back up. Without that, more long-term holders may start selling as well.
🧠 Current Scenarios (Daily Timeframe) — Patience is key. If you haven’t already entered a short based on previous analyses, consider these setups:
🟢 Long Scenario: Enter on a confirmed breakout and consolidation above $115,156, accompanied by a spike in buying volume and an RSI move above 48.
🔴 Short Scenario: Enter on a confirmed breakdown and close below $105,647, which could trigger a deeper correction toward lower levels. This move would likely coincide with continued selling pressure and RSI dropping below 36 into the oversold zone.
❤️ Disclaimer : This analysis is purely based on my personal opinion and I only trade if the stated triggers are activated .
Related publications
Disclaimer
The information and publications are not meant to be, and do not constitute, financial, investment, trading, or other types of advice or recommendations supplied or endorsed by TradingView. Read more in the Terms of Use.
Related publications
Disclaimer
The information and publications are not meant to be, and do not constitute, financial, investment, trading, or other types of advice or recommendations supplied or endorsed by TradingView. Read more in the Terms of Use.