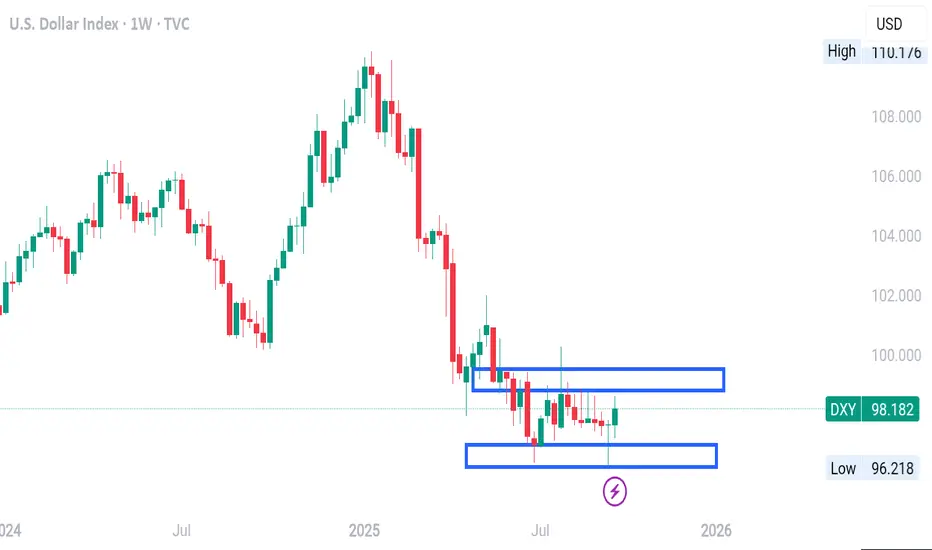
Looking at the chart (USD Index, Weekly timeframe):
1. Current Context
Price has been in a clear downtrend from the highs above 110.
Recently, it has moved sideways between 96.90 – 99.30 (the two boxed ranges you marked).
Current weekly candle is green, showing a short-term attempt to bounce.
2. Key Zones
Resistance zone: 98.53 – 99.34 (upper box). Price has repeatedly failed to close above this region.
Support zone: 96.92 – 96.12 (lower box). Buyers have stepped in here multiple times to prevent deeper falls.
3. Directional Bias
Macro bias (weekly structure): Still bearish, because the overall trend is lower and price is consolidating near the bottom after a strong selloff.
Immediate/short-term bias: Neutral to slightly bullish, since the last candles show rejection of the lower end (around 97) and price is pushing back up toward resistance at 98.50+.
4. What to Watch
If price breaks and closes above 99.34, bias shifts bullish with room toward 100.95.
If price rejects the 98.5–99.3 zone again and rolls over, expect continuation lower toward 96.00 and potentially 95.30.
👉 Summary:
Bias is bearish overall, but short-term corrective bullish as price moves within the range. Directional confirmation will come only when price breaks out of either the 99.30 resistance or the 96.12 support.
Disclaimer
The information and publications are not meant to be, and do not constitute, financial, investment, trading, or other types of advice or recommendations supplied or endorsed by TradingView. Read more in the Terms of Use.
Disclaimer
The information and publications are not meant to be, and do not constitute, financial, investment, trading, or other types of advice or recommendations supplied or endorsed by TradingView. Read more in the Terms of Use.