🔍Technical Analysis
HDFC Bank represents one of the most remarkable wealth creation stories in Indian equity markets. The stock has delivered an extraordinary super bullish rally over three decades, transforming from ₹1 to the current trading level of ₹955 - representing an astounding 955x growth over 30 years.
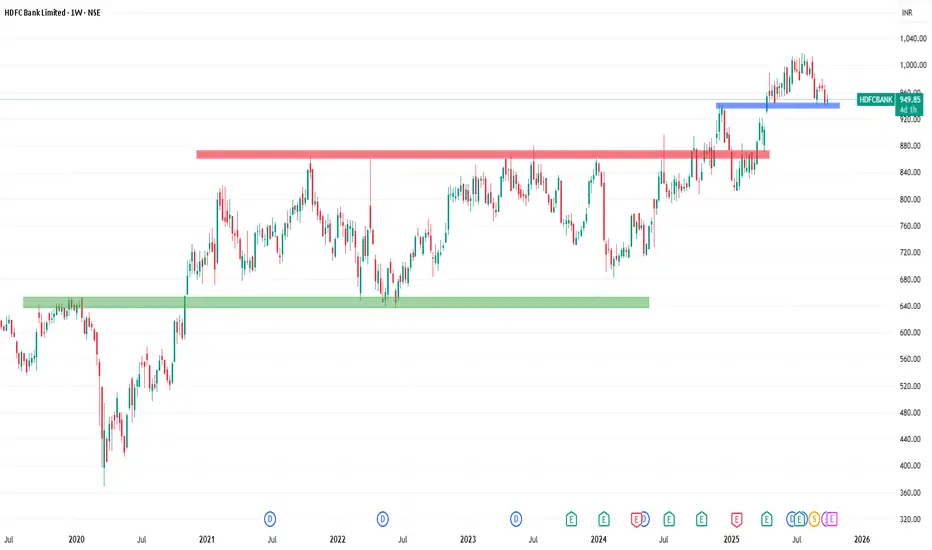
Currently, the stock is taking strong support in the ₹935-₹945 zone, which has acted as a crucial demand area. This support zone has been tested multiple times and held firm, indicating institutional accumulation at these levels.
If the three-decade bullish rally continues from current support levels, the technical setup favors resumption of the uptrend. The stock is well-positioned for the next leg of growth from the established support zone.
Entry Strategy: Accumulate in the ₹935-₹955 range with strong support confirmation.
🎯Targets:
Target 1: ₹980
Target 2: ₹1,000
Target 3: ₹1,020
🚫Stop Losses:
Minor Support: ₹850 (intermediate demand zone)
Major Support: ₹650 (strong long-term support)
If ₹650 level breaks down, no more expectations on this stock.
💰FY25 Financial Highlights (vs FY24 & FY23)
HDFC Bank delivered strong FY25 performance with consolidated PAT growing 12% YoY to ₹73,440 crore, supported by robust 19% revenue growth to ₹3,36,367 crore. The bank declared ₹22 dividend reflecting confidence in sustained profitability.
Market cap stands at ₹14,51,630 crore (up 7.84% in 1 year) with stock trading at 2.77 times book value. Total revenue for FY25 reached ₹3,42,193 crore with profit of ₹73,343 crore, demonstrating consistent financial strength.
Q4 FY25 standalone net profit grew 6.7% YoY to ₹17,616 crore, with net interest income (NII) increasing 10.3% YoY to ₹32,070 crore. Net interest margin (NIM) stood at 3.54% on total assets, reflecting stable spreads despite competitive environment.
Asset quality remains robust with gross NPAs at 1.36% and net NPAs at 0.33% of net advances. Average deposits for Q4 FY25 grew 15.8% YoY to ₹25,280 billion, while CASA deposits grew 5.7% YoY to ₹8,289 billion, maintaining stable share in deposit mix.
The bank is strategically managing its credit-deposit (CD) ratio and planning measured loan growth in FY26 to maintain balance sheet quality. Strong subsidiary performance and digital banking initiatives continue to drive franchise value.
✅Conclusion
HDFC Bank's remarkable 30-year journey from ₹1 to ₹955, backed by strong FY25 fundamentals showing 12% PAT growth and ₹22 dividend declaration, validates the long-term investment thesis. The ₹935-₹945 support zone offers attractive accumulation opportunity for targeting ₹1,020+ levels. Robust asset quality with 1.36% gross NPA, 15.8% deposit growth, and stable 3.54% NIM demonstrate operational excellence. The stock remains a core banking sector holding with multiple support levels providing risk management framework.
HDFC Bank represents one of the most remarkable wealth creation stories in Indian equity markets. The stock has delivered an extraordinary super bullish rally over three decades, transforming from ₹1 to the current trading level of ₹955 - representing an astounding 955x growth over 30 years.
Currently, the stock is taking strong support in the ₹935-₹945 zone, which has acted as a crucial demand area. This support zone has been tested multiple times and held firm, indicating institutional accumulation at these levels.
If the three-decade bullish rally continues from current support levels, the technical setup favors resumption of the uptrend. The stock is well-positioned for the next leg of growth from the established support zone.
Entry Strategy: Accumulate in the ₹935-₹955 range with strong support confirmation.
🎯Targets:
Target 1: ₹980
Target 2: ₹1,000
Target 3: ₹1,020
🚫Stop Losses:
Minor Support: ₹850 (intermediate demand zone)
Major Support: ₹650 (strong long-term support)
If ₹650 level breaks down, no more expectations on this stock.
💰FY25 Financial Highlights (vs FY24 & FY23)
- Total Income: ₹3,36,367 Cr (↑ +19% YoY from ₹2,83,649 Cr; ↑ +97% from FY23 ₹1,70,754 Cr)
- Total Expenses: ₹1,86,974 Cr (↑ +7% YoY from ₹1,74,196 Cr; ↑ +197% from FY23 ₹63,042 Cr)
- Financing Profit: ₹-34,501 Cr (Improved from ₹-44,685 Cr in FY24)
- Profit Before Tax: ₹96,242 Cr (↑ +26% YoY from ₹76,569 Cr; ↑ +57% from FY23 ₹61,498 Cr)
- Profit After Tax: ₹73,440 Cr (↑ +12% YoY from ₹65,446 Cr; ↑ +59% from FY23 ₹46,149 Cr)
- Diluted EPS: ₹46.26 (↑ +10% YoY from ₹42.16; ↑ +12% from FY23 ₹41.22)
HDFC Bank delivered strong FY25 performance with consolidated PAT growing 12% YoY to ₹73,440 crore, supported by robust 19% revenue growth to ₹3,36,367 crore. The bank declared ₹22 dividend reflecting confidence in sustained profitability.
Market cap stands at ₹14,51,630 crore (up 7.84% in 1 year) with stock trading at 2.77 times book value. Total revenue for FY25 reached ₹3,42,193 crore with profit of ₹73,343 crore, demonstrating consistent financial strength.
Q4 FY25 standalone net profit grew 6.7% YoY to ₹17,616 crore, with net interest income (NII) increasing 10.3% YoY to ₹32,070 crore. Net interest margin (NIM) stood at 3.54% on total assets, reflecting stable spreads despite competitive environment.
Asset quality remains robust with gross NPAs at 1.36% and net NPAs at 0.33% of net advances. Average deposits for Q4 FY25 grew 15.8% YoY to ₹25,280 billion, while CASA deposits grew 5.7% YoY to ₹8,289 billion, maintaining stable share in deposit mix.
The bank is strategically managing its credit-deposit (CD) ratio and planning measured loan growth in FY26 to maintain balance sheet quality. Strong subsidiary performance and digital banking initiatives continue to drive franchise value.
✅Conclusion
HDFC Bank's remarkable 30-year journey from ₹1 to ₹955, backed by strong FY25 fundamentals showing 12% PAT growth and ₹22 dividend declaration, validates the long-term investment thesis. The ₹935-₹945 support zone offers attractive accumulation opportunity for targeting ₹1,020+ levels. Robust asset quality with 1.36% gross NPA, 15.8% deposit growth, and stable 3.54% NIM demonstrate operational excellence. The stock remains a core banking sector holding with multiple support levels providing risk management framework.
Disclaimer
The information and publications are not meant to be, and do not constitute, financial, investment, trading, or other types of advice or recommendations supplied or endorsed by TradingView. Read more in the Terms of Use.
Disclaimer
The information and publications are not meant to be, and do not constitute, financial, investment, trading, or other types of advice or recommendations supplied or endorsed by TradingView. Read more in the Terms of Use.