📊 Weekly Support & Resistance Levels
Weekly Resistance Levels
R1: ~₹83.96 — immediate weekly resistance (key breakout level)
R2: ~₹85.63 — next major resistance
R3: ~₹88.44 — extended upside if trend is strong
Weekly Support Levels
S1: ~₹79.48 — first strong weekly support
S2: ~₹76.67 — secondary support zone
S3: ~₹75.00 — deeper support if weakness accelerates
Weekly Pivot (approx central point)
Around ₹81.15–₹81.72 based on weekly pivot analysis
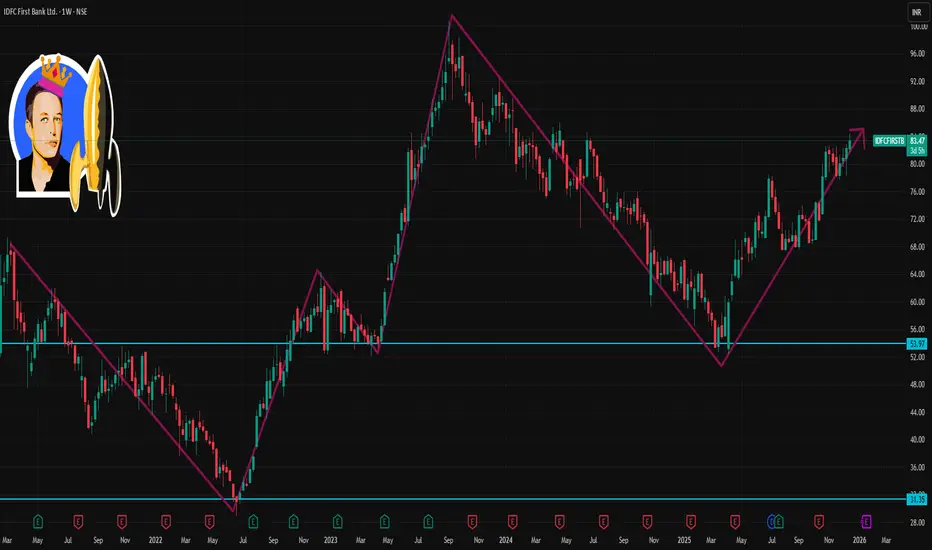
📌 Key Reference Price Context
The stock is currently trading around ₹83‑₹84 on the NSE (Dec 16, 2025).
52‑week range is roughly ₹52.46 low to ~₹84.4 high; price is near its yearly peak.
Weekly Resistance Levels
R1: ~₹83.96 — immediate weekly resistance (key breakout level)
R2: ~₹85.63 — next major resistance
R3: ~₹88.44 — extended upside if trend is strong
Weekly Support Levels
S1: ~₹79.48 — first strong weekly support
S2: ~₹76.67 — secondary support zone
S3: ~₹75.00 — deeper support if weakness accelerates
Weekly Pivot (approx central point)
Around ₹81.15–₹81.72 based on weekly pivot analysis
📌 Key Reference Price Context
The stock is currently trading around ₹83‑₹84 on the NSE (Dec 16, 2025).
52‑week range is roughly ₹52.46 low to ~₹84.4 high; price is near its yearly peak.
Related publications
Disclaimer
The information and publications are not meant to be, and do not constitute, financial, investment, trading, or other types of advice or recommendations supplied or endorsed by TradingView. Read more in the Terms of Use.
Related publications
Disclaimer
The information and publications are not meant to be, and do not constitute, financial, investment, trading, or other types of advice or recommendations supplied or endorsed by TradingView. Read more in the Terms of Use.