🔍Technical Analysis
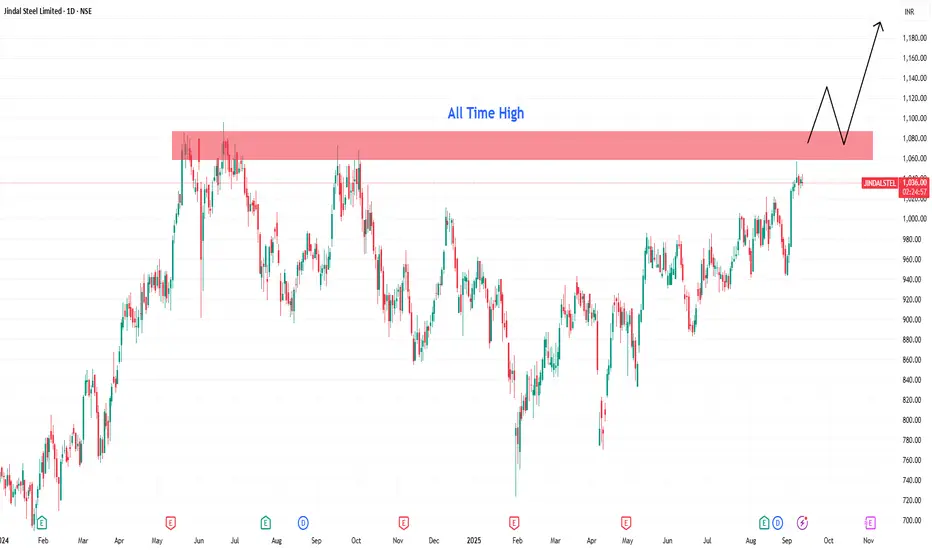
Jindal Steel has demonstrated an exceptional super bullish rally spanning the past decade, establishing itself as a market leader. However, since 2024, the stock encountered formidable resistance at the 1050-1100 zone, creating a critical supply area that has tested multiple times.
The game-changing catalyst arrived with the announcement of stellar Q1 FY26 results in August 2024, showcasing remarkable operational turnaround. These super positive quarterly numbers provided the momentum needed to challenge the stubborn resistance zone once again.
Currently trading at ₹1,039, the stock sits just below the crucial 1050-1100 supply zone. A decisive breakout above this range with strong volume confirmation would mark a significant technical milestone, transforming previous resistance into robust support.
Entry Strategy: Enter on sustained breakout above ₹1,100 with volume confirmation, ensuring bullish candlestick patterns emerge.
🎯Targets:
Target 1: ₹1,150
Target 2: ₹1,200
Target 3: ₹1,250
Stop Losses:
Critical Stop: ₹1,050 (supply zone breakout level)
If the supply zone sustains and market fails to hold above these levels, no more expectations on this stock.
💰Q1 FY26 Financial Highlights (vs Q4 FY25 & Q1 FY25)
Jindal Steel delivered a spectacular operational turnaround in Q1 FY26 with PAT surging to ₹1,498 crore, marking an impressive 11.8% YoY growth and complete recovery from Q4 FY25 losses. The dramatic quarterly improvement showcases superior cost management with expenses declining 14.9% while operating profits jumped 32.9%.
Market cap stands at ₹1,05,635 crore (up 7.49% in 1 year) with strong promoter holding of 62.4% indicating management confidence. The company maintains diversified operations across steel, power, mining and infrastructure sectors providing business stability.
Operating margin expansion from 20.8% in Q1 FY25 to 24.5% in Q1 FY26 demonstrates exceptional operational efficiency improvements. The integrated steel-to-power business model offers competitive advantages and revenue diversification benefits.
India's steel sector momentum provides strong tailwinds with market projected to grow from $102.67 billion in 2024 to $166.96 billion by 2030 at 8.28% CAGR. Infrastructure boom and government initiatives support sustained steel demand growth prospects.
Cost optimization excellence reflected in 13.8% YoY expense reduction while maintaining operational capabilities, showcasing management's focus on profitability enhancement. The company's strategic positioning in key infrastructure segments aligns with India's growth trajectory.
EPS improvement from negative territory to ₹14.65 validates the operational turnaround strategy. Strong balance sheet fundamentals and debt management support the technical breakout thesis for sustained momentum.
✅Conclusion
Jindal Steel's remarkable Q1 FY26 turnaround with 11.8% YoY PAT growth and operational margin expansion creates compelling technical setup at the 1050-1100 resistance zone. The company's integrated business model and sector tailwinds from India's infrastructure boom provide strong fundamental backing. Critical breakout above ₹1,100 with volume confirmation could unlock significant upside to the ₹1,250 target zone. Support at ₹1,050 breakout level must sustain for continued bullish trajectory.
Jindal Steel has demonstrated an exceptional super bullish rally spanning the past decade, establishing itself as a market leader. However, since 2024, the stock encountered formidable resistance at the 1050-1100 zone, creating a critical supply area that has tested multiple times.
The game-changing catalyst arrived with the announcement of stellar Q1 FY26 results in August 2024, showcasing remarkable operational turnaround. These super positive quarterly numbers provided the momentum needed to challenge the stubborn resistance zone once again.
Currently trading at ₹1,039, the stock sits just below the crucial 1050-1100 supply zone. A decisive breakout above this range with strong volume confirmation would mark a significant technical milestone, transforming previous resistance into robust support.
Entry Strategy: Enter on sustained breakout above ₹1,100 with volume confirmation, ensuring bullish candlestick patterns emerge.
🎯Targets:
Target 1: ₹1,150
Target 2: ₹1,200
Target 3: ₹1,250
Stop Losses:
Critical Stop: ₹1,050 (supply zone breakout level)
If the supply zone sustains and market fails to hold above these levels, no more expectations on this stock.
💰Q1 FY26 Financial Highlights (vs Q4 FY25 & Q1 FY25)
- Total Income: ₹12,294 Cr (↓ -6.7% QoQ from ₹13,183 Cr; ↓ -9.7% YoY from ₹13,618 Cr)
- Total Expenses: ₹9,289 Cr (↓ -14.9% QoQ from ₹10,922 Cr; ↓ -13.8% YoY from ₹10,779 Cr)
- Operating Profit: ₹3,006 Cr (↑ +32.9% QoQ from ₹2,262 Cr; ↑ +5.9% YoY from ₹2,839 Cr)
- Profit Before Tax: ₹2,018 Cr (↑ +2,703% QoQ from ₹72 Cr; ↑ +8.6% YoY from ₹1,859 Cr)
- Profit After Tax: ₹1,498 Cr (Turnaround from ₹-304 Cr QoQ; ↑ +11.8% YoY from ₹1,338 Cr)
- Diluted EPS: ₹14.65 (↑ +540% QoQ from ₹-3.33; ↑ +11.5% YoY from ₹13.14)
Jindal Steel delivered a spectacular operational turnaround in Q1 FY26 with PAT surging to ₹1,498 crore, marking an impressive 11.8% YoY growth and complete recovery from Q4 FY25 losses. The dramatic quarterly improvement showcases superior cost management with expenses declining 14.9% while operating profits jumped 32.9%.
Market cap stands at ₹1,05,635 crore (up 7.49% in 1 year) with strong promoter holding of 62.4% indicating management confidence. The company maintains diversified operations across steel, power, mining and infrastructure sectors providing business stability.
Operating margin expansion from 20.8% in Q1 FY25 to 24.5% in Q1 FY26 demonstrates exceptional operational efficiency improvements. The integrated steel-to-power business model offers competitive advantages and revenue diversification benefits.
India's steel sector momentum provides strong tailwinds with market projected to grow from $102.67 billion in 2024 to $166.96 billion by 2030 at 8.28% CAGR. Infrastructure boom and government initiatives support sustained steel demand growth prospects.
Cost optimization excellence reflected in 13.8% YoY expense reduction while maintaining operational capabilities, showcasing management's focus on profitability enhancement. The company's strategic positioning in key infrastructure segments aligns with India's growth trajectory.
EPS improvement from negative territory to ₹14.65 validates the operational turnaround strategy. Strong balance sheet fundamentals and debt management support the technical breakout thesis for sustained momentum.
✅Conclusion
Jindal Steel's remarkable Q1 FY26 turnaround with 11.8% YoY PAT growth and operational margin expansion creates compelling technical setup at the 1050-1100 resistance zone. The company's integrated business model and sector tailwinds from India's infrastructure boom provide strong fundamental backing. Critical breakout above ₹1,100 with volume confirmation could unlock significant upside to the ₹1,250 target zone. Support at ₹1,050 breakout level must sustain for continued bullish trajectory.
Disclaimer
The information and publications are not meant to be, and do not constitute, financial, investment, trading, or other types of advice or recommendations supplied or endorsed by TradingView. Read more in the Terms of Use.
Disclaimer
The information and publications are not meant to be, and do not constitute, financial, investment, trading, or other types of advice or recommendations supplied or endorsed by TradingView. Read more in the Terms of Use.