Educational breakdown based solely on chart structure
🔍 1. Chart Findings & Market Structure
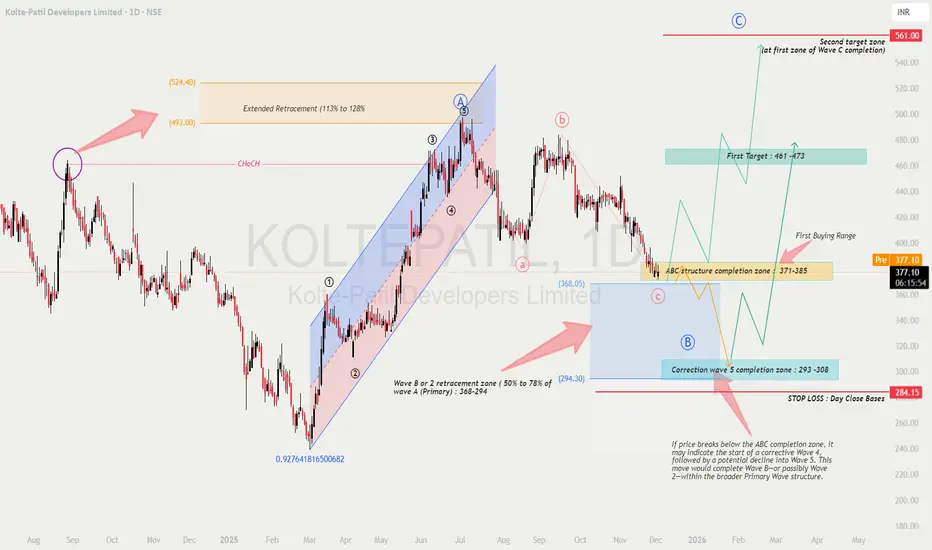
The chart shows a clear Elliott Wave progression, where the previous impulse (Primary Wave A) topped near ₹493–524, followed by a corrective ABC decline.
✔ Key Observations
Primary Wave A formed an impulsive rally inside a rising channel.
The price later broke structure (CHoCH) indicating loss of momentum.
Current price (₹377) is trading inside the ABC structure completion zone of ₹371–385, a critical decision area.
A deeper correction toward ₹293–308 remains possible if Wave C extends.
🎓 2. Educational Points (Why These Levels Matter)
📘 A. Extended Retracement Zone: 113–128%
The chart marks ₹493–524 as the extended retracement area, which often acts as:
A wave A termination area
Strong reversal zone
Liquidity grab region
This supports the idea that the major impulse from March–July is complete.
📘 B. Wave B / Wave 2 Retracement
A natural correction for Wave B or Wave 2 typically pulls back 50–78% of the previous impulse.
This gives the ₹368–294 broad range as the acceptable retracement.
📘 C. Completing Wave C (Corrective ABC)
Wave C generally equals Wave A or 1.272–1.618 extension of Wave A.
The chart’s projection supports a potential completion:
First zone: ₹371–385 (current test)
Final zone: ₹293–308 (if extended C-wave unfolds)
📉 3. Current Price Action Insight
Price is currently hovering near the ABC structure completion zone (₹371–385).
No strong bullish reversal candle is visible yet—indicating buyers are waiting for confirmation.
Price remains in a downward corrective structure, but nearing exhaustion.
This phase is ideal for planning, not rushing.
🔮 4. Future Prediction Based on Wave Theory
Two scenarios emerge:
🟦 Scenario 1: ABC Correction Completes at Current Levels (₹371–385)
If the current demand zone holds:
Price forms a wave B bottom and begins Primary Wave C upward.
Expected targets:
🎯 First Target: ₹461–473
🎯 Final Target: ₹561 (Primary Wave C completion zone)
🟥 Scenario 2: ABC Correction Extends to ₹293–308
If ₹371–385 fails:
Market enters the correction wave 5 completion zone (₹293–308).
From this demand block, a stronger bullish reversal is expected.
Long-term bullish structure remains intact if it stays above ₹284 (stop level).
🛒 5. Buying Strategy (Educated Approach)
🟩 FIRST BUYING RANGE: ₹371–385 (Conservative Entry)
Enter only if:
Strong bullish candle (engulfing / pin bar / OB reclaim)
RSI bullish divergence
Price closes above structure high (minor CHoCH)
🟦 SECOND BUYING RANGE: ₹293–308 (High-Value Entry)
A deeper correction provides:
Lower risk
Maximum R:R
Stronger probability of reversal
Use this zone if the first one fails.
⚖ 6. Risk–Reward Analysis
If entering at ₹371–385
Stop-Loss: Below ₹284 (daily close basis)
Upside Potential: Up to ₹561
Reward : Risk Ratio: Approx 3.5–4.2 R
If entering at ₹293–308
Stop-Loss: Below ₹284
Upside Potential: Up to ₹473–561
Reward : Risk Ratio: Approx 5–7 R (excellent)
🔐 7. Confirmation Strategies for Better Entries
Use any two or more of the following:
✔ 1. Market Structure Shift
Wait for a CHoCH above the last swing high inside the zone.
✔ 2. Volume Expansion
Rising green volume during rebound increases reliability.
✔ 3. Bullish Divergence (RSI or MACD)
Signals weakening sellers.
✔ 4. Break & Retest Method
Let price break a minor resistance
Enter on retest to confirm strength
✔ 5. Demand Zone Reaction
Look for:
Long tail candles
Absorption wicks
Order block reclaim
These indicate smart money interest.
🧠 8. Summary & View
The stock is in the final leg of a correction and is approaching highly reactive Fibonacci zones.
Structure favors a bullish wave (Primary Wave C) in the coming months if key support holds.
📌 First confirmation: Bounce from ₹371–385
📌 Strongest bullish case: Reversal from ₹293–308
📌 Invalidation: Close below ₹284
The long setup has strong wave logic, clean levels, and attractive R:R.
⚠️ Disclaimer
This analysis is for educational purposes only and reflects wave-structure interpretation based solely on the provided chart.
I am not a SEBI-registered analyst.
Please conduct your own research or consult your financial advisor before trading or investing.
Disclaimer
The information and publications are not meant to be, and do not constitute, financial, investment, trading, or other types of advice or recommendations supplied or endorsed by TradingView. Read more in the Terms of Use.
Disclaimer
The information and publications are not meant to be, and do not constitute, financial, investment, trading, or other types of advice or recommendations supplied or endorsed by TradingView. Read more in the Terms of Use.