📌 NIFTY Trading Plan – 03-Apr-2025
📊 Market Overview:
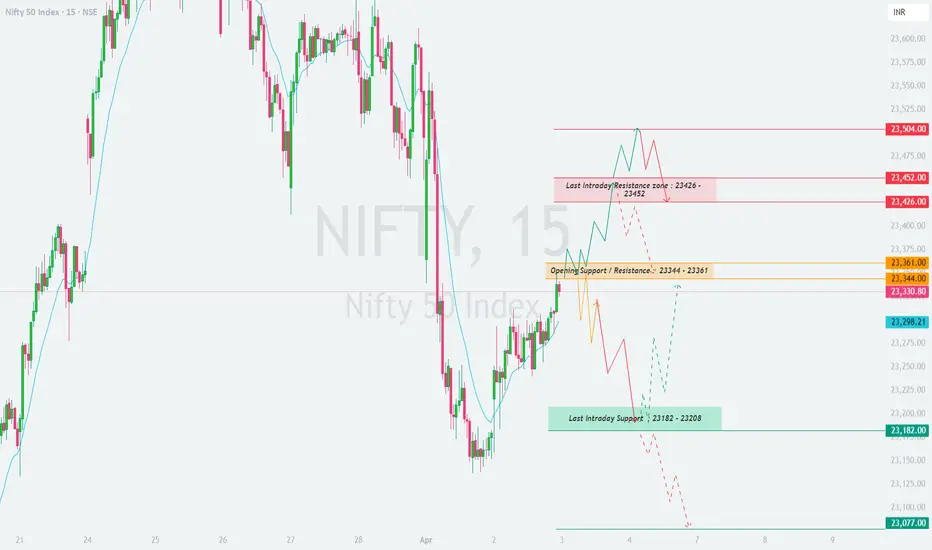
NIFTY closed at 23,330.80, showing signs of recovery from the last intraday support level at 23,182. The opening support/resistance zone (23,344 – 23,361) will be the critical level to watch. The broader trend will be determined by price action near 23,426 – 23,452 resistance and 23,182 – 23,077 support zones.
To trade effectively, let's analyze all possible opening scenarios and structure a trading plan accordingly.
🔼 Scenario 1: Gap-Up Opening (100+ points above 23,426)
A gap-up above 23,426 signals bullish momentum, but the resistance zone at 23,452 – 23,504 will determine whether buyers can sustain higher levels.
✅ Plan of Action:
🎯 Pro Tip: If the gap-up fails to hold 23,426 within the first 15 minutes, it indicates weak buying strength, increasing the probability of a pullback.
⚖ Scenario 2: Flat Opening (Within ±100 points, around 23,330)
A flat opening suggests indecision, where price action near the opening support/resistance zone (23,344 – 23,361) will determine the direction.
✅ Plan of Action:
🎯 Pro Tip: Patience is key in a flat opening. Wait for a strong 15-minute candle closing outside the range before entering a trade.
🔽 Scenario 3: Gap-Down Opening (100+ points below 23,182)
A gap-down below 23,182 indicates bearish sentiment, with buyers likely to step in near the major support zone (23,077 – 23,000).
✅ Plan of Action:
🎯 Pro Tip: If the gap-down happens near a strong support zone, wait for bullish confirmation (e.g., reversal candlestick patterns) before going long.
⚠️ Risk Management Tips for Options Traders
🛑 Avoid Over-leveraging – Maintain proper position sizing to control risk.
⌛ Theta Decay Awareness – Sideways movement will erode option premiums; avoid buying options in a choppy market.
🔄 Use Spreads for Risk Control – Instead of naked options, use spreads to hedge and improve probabilities.
📊 Trade at Key Levels – Avoid random trades; focus on well-defined support and resistance zones.
📌 Summary & Conclusion
📍 Key Levels to Watch:
🟥 Resistance: 23,426 → 23,452 → 23,504 → 23,575
🟧 Opening Support/Resistance Zone: 23,344 – 23,361
🟩 Support: 23,298 → 23,182 → 23,077 → 23,000
🔸 Bullish Bias: Above 23,426, targeting 23,452 – 23,575
🔸 Bearish Bias: Below 23,182, expecting a drop towards 23,077 – 23,000
🔸 Neutral/Choppy: Inside 23,344 – 23,361, avoid unnecessary trades
🎯 Final Advice:
Stick to the structured trading plan and execute only at key levels.
Avoid emotional trading—wait for confirmation before entering trades.
The first 15-30 minutes after market open will provide better clarity—observe price action before committing to a trade.
📢 Disclaimer
I am not a SEBI-registered analyst. This trading plan is for educational purposes only. Please conduct your own research or consult a financial advisor before making any trades.
🚀 Stay updated with live trade setups!
📊 Market Overview:
NIFTY closed at 23,330.80, showing signs of recovery from the last intraday support level at 23,182. The opening support/resistance zone (23,344 – 23,361) will be the critical level to watch. The broader trend will be determined by price action near 23,426 – 23,452 resistance and 23,182 – 23,077 support zones.
To trade effectively, let's analyze all possible opening scenarios and structure a trading plan accordingly.
🔼 Scenario 1: Gap-Up Opening (100+ points above 23,426)
A gap-up above 23,426 signals bullish momentum, but the resistance zone at 23,452 – 23,504 will determine whether buyers can sustain higher levels.
✅ Plan of Action:
- [] If NIFTY holds above 23,426, it may attempt to break 23,452 and head toward 23,504. A sustained move above 23,504 can push the index towards 23,575.
[] If price struggles near 23,452 – 23,504, expect profit booking and a potential retracement towards 23,361 → 23,344. A breakdown below 23,344 could trigger further selling towards 23,298. - Avoid aggressive longs at resistance (23,452 – 23,504) unless a strong breakout with volume occurs. Instead, look for either a retest entry or a breakout confirmation.
🎯 Pro Tip: If the gap-up fails to hold 23,426 within the first 15 minutes, it indicates weak buying strength, increasing the probability of a pullback.
⚖ Scenario 2: Flat Opening (Within ±100 points, around 23,330)
A flat opening suggests indecision, where price action near the opening support/resistance zone (23,344 – 23,361) will determine the direction.
✅ Plan of Action:
- [] Upside case: If NIFTY sustains above 23,361, expect a move towards 23,426 → 23,452. A breakout above 23,452 could push it towards 23,504.
[] Downside case: If NIFTY falls below 23,344, expect a decline towards 23,298 → 23,182. A breakdown below 23,182 will confirm bearish momentum. - No Trade Zone (23,344 – 23,361): Avoid trading within this range unless a clear direction is established.
🎯 Pro Tip: Patience is key in a flat opening. Wait for a strong 15-minute candle closing outside the range before entering a trade.
🔽 Scenario 3: Gap-Down Opening (100+ points below 23,182)
A gap-down below 23,182 indicates bearish sentiment, with buyers likely to step in near the major support zone (23,077 – 23,000).
✅ Plan of Action:
- [] If NIFTY sustains below 23,182, expect a drop towards 23,077 → 23,000. A breakdown below 23,000 could accelerate selling towards 22,907.
[] If NIFTY finds support at 23,077 and rebounds, look for a potential recovery towards 23,182 → 23,298. A strong breakout above 23,298 would signal a bullish reversal. - Be cautious of bear traps – If the market gaps down but quickly recovers, short-covering rallies can trigger a sharp upside move.
🎯 Pro Tip: If the gap-down happens near a strong support zone, wait for bullish confirmation (e.g., reversal candlestick patterns) before going long.
⚠️ Risk Management Tips for Options Traders
🛑 Avoid Over-leveraging – Maintain proper position sizing to control risk.
⌛ Theta Decay Awareness – Sideways movement will erode option premiums; avoid buying options in a choppy market.
🔄 Use Spreads for Risk Control – Instead of naked options, use spreads to hedge and improve probabilities.
📊 Trade at Key Levels – Avoid random trades; focus on well-defined support and resistance zones.
📌 Summary & Conclusion
📍 Key Levels to Watch:
🟥 Resistance: 23,426 → 23,452 → 23,504 → 23,575
🟧 Opening Support/Resistance Zone: 23,344 – 23,361
🟩 Support: 23,298 → 23,182 → 23,077 → 23,000
🔸 Bullish Bias: Above 23,426, targeting 23,452 – 23,575
🔸 Bearish Bias: Below 23,182, expecting a drop towards 23,077 – 23,000
🔸 Neutral/Choppy: Inside 23,344 – 23,361, avoid unnecessary trades
🎯 Final Advice:
Stick to the structured trading plan and execute only at key levels.
Avoid emotional trading—wait for confirmation before entering trades.
The first 15-30 minutes after market open will provide better clarity—observe price action before committing to a trade.
📢 Disclaimer
I am not a SEBI-registered analyst. This trading plan is for educational purposes only. Please conduct your own research or consult a financial advisor before making any trades.
🚀 Stay updated with live trade setups!
Disclaimer
The information and publications are not meant to be, and do not constitute, financial, investment, trading, or other types of advice or recommendations supplied or endorsed by TradingView. Read more in the Terms of Use.
Disclaimer
The information and publications are not meant to be, and do not constitute, financial, investment, trading, or other types of advice or recommendations supplied or endorsed by TradingView. Read more in the Terms of Use.