📊 NIFTY TRADING PLAN — 10 DEC 2025
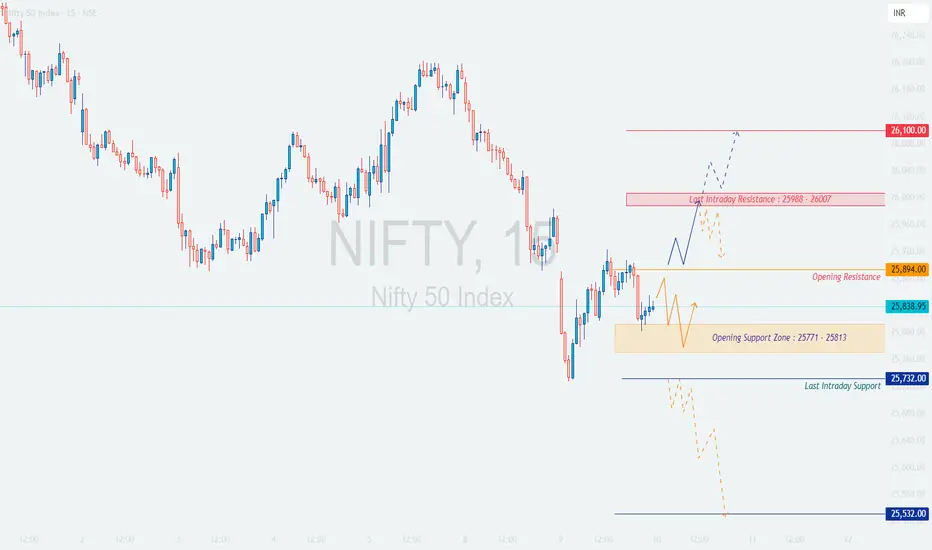
Nifty closed near 25,839, sitting just below the Opening Resistance (25,894) and just above a broad Opening Support Zone (25,771–25,813).
Major levels from the chart:
• Opening Resistance: 25,894
• Last Intraday Resistance: 25,988 – 26,007
• Major Resistance: 26,100
• Opening Support Zone: 25,771 – 25,813
• Last Intraday Support: 25,732
• Deep Support: 25,532
Tomorrow’s opening direction near these zones will define the intraday trend.
🚀 1. GAP-UP OPENING (100+ points)
A gap-up above 25,930–25,950 takes price close to the major resistance cluster.
📌 Educational Note:
Gap-ups often run into overhead supply. A retest-based entry confirms institutional participation and filters out false breakouts.
⚖ 2. FLAT OPENING (around 25,820–25,860)
This scenario offers clean structural trades as the market develops organically.
📌 Educational Note:
Flat opens reveal trend direction slowly but clearly. Early structure (higher-lows or lower-highs) guides bias for the rest of the session.
📉 3. GAP-DOWN OPENING (100+ points)
A gap-down toward 25,700–25,750 places Nifty near major liquidity zones.
📌 Educational Note:
Gap-downs often sweep stops before reversing. Your edge lies in patience and confirmation, not prediction.
🛡 RISK MANAGEMENT TIPS FOR OPTIONS TRADERS
📌 SUMMARY & CONCLUSION
• Bullish bias only above 25,894, with upside toward 25,988 → 26,007 → 26,100.
• Range zone between 25,771–25,894 until a breakout occurs.
• Strong reversal opportunities near support zones:
– 25,771–25,813
– 25,732
– 25,532
• Always trade breakout + retest or reversal confirmation.
• Proper risk management is more important than direction.
⚠ DISCLAIMER
I am not a SEBI-registered analyst.
This trading plan is purely for educational purposes and must not be considered investment advice.
Always apply your own judgment and strict risk management while trading.
Nifty closed near 25,839, sitting just below the Opening Resistance (25,894) and just above a broad Opening Support Zone (25,771–25,813).
Major levels from the chart:
• Opening Resistance: 25,894
• Last Intraday Resistance: 25,988 – 26,007
• Major Resistance: 26,100
• Opening Support Zone: 25,771 – 25,813
• Last Intraday Support: 25,732
• Deep Support: 25,532
Tomorrow’s opening direction near these zones will define the intraday trend.
🚀 1. GAP-UP OPENING (100+ points)
A gap-up above 25,930–25,950 takes price close to the major resistance cluster.
1. If price opens above 25,894 and retests the level successfully
• Avoid jumping in on the first candle.
• Wait for a retest of 25,894 — if it holds with bullish wicks or CHoCH → Long entry.
• Targets: 25,988 → 26,007 → 26,100.
• Book partial profits near 26,007 (previous rejection zone).
2. If price opens directly inside 25,988–26,007 (Last Intraday Resistance)
• Avoid fresh longs — very high chance of sellers reacting here.
• Look for rejection → If price drops back below 25,894, safe short entries activate with downside targets:
→ 25,850 → 25,800.
3. If price breaks above 26,100 and sustains
• Signals strong bullish momentum.
• Upside extension possible toward 26,150–26,180.
• Trail SL aggressively to protect profits.
📌 Educational Note:
Gap-ups often run into overhead supply. A retest-based entry confirms institutional participation and filters out false breakouts.
⚖ 2. FLAT OPENING (around 25,820–25,860)
This scenario offers clean structural trades as the market develops organically.
1. If price reclaims and sustains above 25,894
• Bullish momentum begins.
• Break + retest of 25,894 triggers long entries.
• Targets: 25,950 → 25,988 → 26,007.
2. If price rejects 25,894
• Bearish structure appears with lower highs.
• Short trades valid toward the Opening Support Zone (25,771–25,813).
• Break below this support opens next target: 25,732.
3. If price remains between 25,813–25,894
• Range-bound behavior highly likely.
• Trade only extremes:
– Buy near 25,771–25,813 (with confirmation).
– Sell near 25,894 (with confirmation).
📌 Educational Note:
Flat opens reveal trend direction slowly but clearly. Early structure (higher-lows or lower-highs) guides bias for the rest of the session.
📉 3. GAP-DOWN OPENING (100+ points)
A gap-down toward 25,700–25,750 places Nifty near major liquidity zones.
1. If price opens near 25,771–25,813 (Opening Support Zone)
• This zone is designed to catch liquidity.
• Avoid shorting immediately.
• Look for bullish reversal signs → If confirmed → Long toward 25,850 → 25,894.
2. If price opens around 25,732 (Last Intraday Support)
• Expect a potential sharp reaction.
• Buyers may step in aggressively.
• Reversal = Long opportunities toward 25,800 → 25,894.
3. If price opens near or below 25,532 (Deep Support)
• Do NOT catch a falling knife.
• Wait for a strong reversal or retest.
• If price retests 25,532 and rejects → Short continuation toward 25,480–25,450.
• If reversal occurs → Long back toward 25,650–25,700.
📌 Educational Note:
Gap-downs often sweep stops before reversing. Your edge lies in patience and confirmation, not prediction.
🛡 RISK MANAGEMENT TIPS FOR OPTIONS TRADERS
1. Avoid trading the first 5 minutes of market open during gap scenarios.
Premiums behave irrationally.
2. Do NOT buy far OTM calls/puts after big gaps.
IV crush + theta decay = rapid losses.
3. Use price-level-based stop-loss, not premium SL.
Price structure is more reliable.
4. Risk per trade = maximum 1–2% of capital.
5. High IV → Prefer selling strategies (credit spreads).
Low IV → Buying strategies become more efficient.
6. Always book partial profits at marked levels:
25,894 / 25,988 / 26,007 / 26,100.
7. Avoid revenge trading — protect capital first.
📌 SUMMARY & CONCLUSION
• Bullish bias only above 25,894, with upside toward 25,988 → 26,007 → 26,100.
• Range zone between 25,771–25,894 until a breakout occurs.
• Strong reversal opportunities near support zones:
– 25,771–25,813
– 25,732
– 25,532
• Always trade breakout + retest or reversal confirmation.
• Proper risk management is more important than direction.
⚠ DISCLAIMER
I am not a SEBI-registered analyst.
This trading plan is purely for educational purposes and must not be considered investment advice.
Always apply your own judgment and strict risk management while trading.
Disclaimer
The information and publications are not meant to be, and do not constitute, financial, investment, trading, or other types of advice or recommendations supplied or endorsed by TradingView. Read more in the Terms of Use.
Disclaimer
The information and publications are not meant to be, and do not constitute, financial, investment, trading, or other types of advice or recommendations supplied or endorsed by TradingView. Read more in the Terms of Use.